

doi: 10.1038/nbt.4112.
Epub 2018 Apr 9.
Highly scalable generation of DNA methylation profiles in single cells
Affiliations
- PMID: 29644997
- PMCID: PMC5938134
- DOI: 10.1038/nbt.4112
Item in Clipboard
Highly scalable generation of DNA methylation profiles in single cells
Nat Biotechnol.
2018 Jun.
Abstract
We present a highly scalable assay for whole-genome methylation profiling of single cells. We use our approach, single-cell combinatorial indexing for methylation analysis (sci-MET), to produce 3,282 single-cell bisulfite sequencing libraries and achieve read alignment rates of 68 ± 8%. We apply sci-MET to discriminate the cellular identity of a mixture of three human cell lines and to identify excitatory and inhibitory neuronal populations from mouse cortical tissue.
Conflict of interest statement
Figures
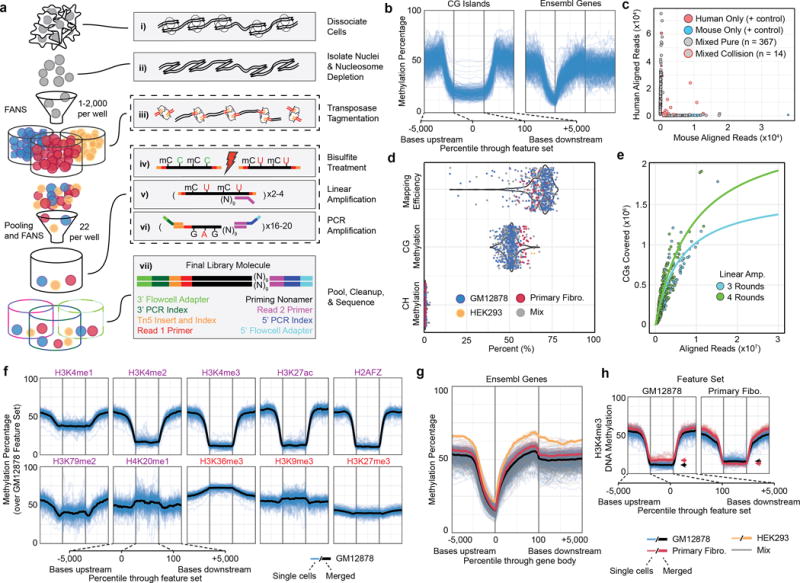
a. The sci-MET workflow. b. Methylation rates for single GM12878 cells (n=283 cells) over CG islands (left) and gene bodies (right). c. sci-MET of mixed mouse and human cells using xSDS nucleosome depletion to estimate barcode collisions. (n=566 cells). d. Mapping efficiency, global CG methylation and global CH methylation for a mix of human cell lines (n=641 cells). e. The number of CG dinucleotides covered by the total aligned reads per cell. f. Methylation rates for GM12878 cells. (Purple are generally activating and red are generally repressive features). g. Methylation rates for the three cell types over annotated genes. h. Methylation rates over GM12878 and Primary Fibroblast ENCODE H3K4me3 ChIP-seq peaks. Arrows indicate the mean for the feature set.
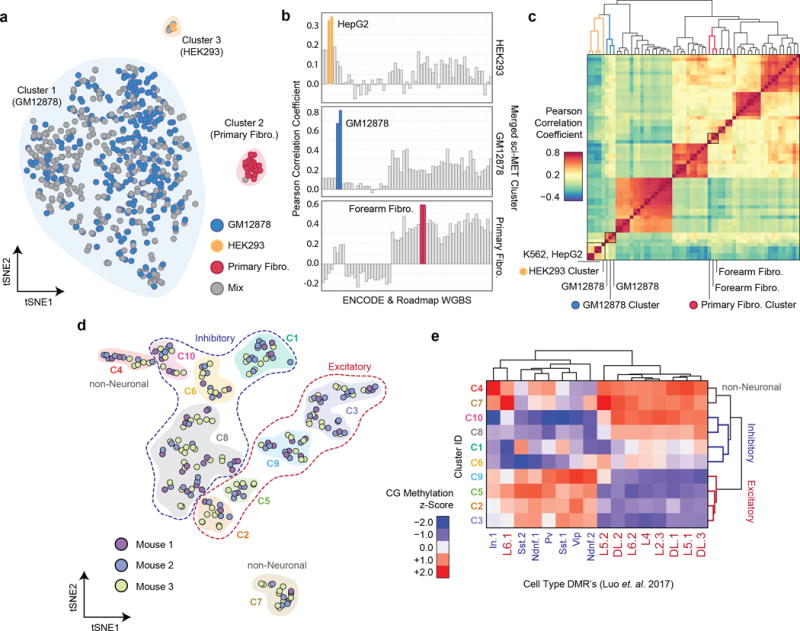
a. NMF-tSNE projections of single-cell methylomes. Clusters are indicated by a shaded background b. Single-cell methylomes (n=641 cells) were aggregated over the three clusters and then correlated with publically available whole genome bisulfite sequencing data. Closely matched cell types are in color. c. Hierarchical clustering on the Pearson correlation values of HEK293, GM12878, and Primary Fibro. d. NMF-tSNE projection of cortical cells based on CG and CH methylation. Clusters are indicated by a shaded background and grouped by class using dashed lines. e. Methylation z-score heatmap of aggregate cell clusters over previously described DMRs (n=285 cells).
References
Online Methods Reference
-
- Lee D, Seung S. Nature. 1999;401:778. - PubMed
-
- Ester M, et al. Proc 2nd Int Conf Knowl Discov Data Min. 1996:226–231.
Publication types
MeSH terms
Grants and funding
LinkOut - more resources
Full Text Sources
Other Literature Sources
Medical
Molecular Biology Databases
Research Materials
Miscellaneous
