. 2018 Sep;155(1):123-136.
doi: 10.1111/imm.12935. Epub 2018 May 7.

A humanized TCR retaining authentic specificity and affinity conferred potent anti-tumour cytotoxicity

Affiliations

A humanized TCR retaining authentic specificity and affinity conferred potent anti-tumour cytotoxicity

Lin Chen et al. Immunology. 2018 Sep.

Abstract

The affinity of T-cell receptor (TCR) determines the efficacy of TCR-based immunotherapy. By using human leucocyte antigen (HLA)-A*02 transgenic mice, a TCR was generated previously specific for human tumour testis antigen peptide MAGE-A3112-120 (KVAELVHFL) HLA-A*02 complex. We developed an approach to humanize the murine TCR by replacing the mouse framework with sequences of folding optimized human TCR variable domains for retaining binding affinity. The resultant humanized TCR exhibited higher affinity and conferred better anti-tumour activity than its parent murine MAGE-A3 TCR (SRm1). In addition, the affinity of humanized TCR was enhanced further to achieve improved T-cell activation. Our studies demonstrated that the human TCR variable domain frameworks could provide support for complementarity-determining regions from a murine TCR, and retain the original binding activity. It could be used as a generic approach of TCR humanization.

Keywords: T-cell; activation; humanized TCR; immunogenicity; murine TCR.


Figures

Figure 1
Figure 1
Construction and production of humanized T‐cell receptors (TCRs) in vitro. (a) The design for different TCR expression cassettes. All these genes were cloned into pET‐28a vector. Vα, variable domain of α chain; Cα, constant domain of α chain; Vβ, variable domain of β chain; Cβ, constant domain of β chain. (b) The gel filtration chromatography of in vitro refolded SRm1 and SRm1g13t eluted with phosphate‐buffered saline. The desired fractions were collected and pooled. (c) The gel filtration chromatography of refolded peptide human leucocyte antigen (pHLA) (MAGE‐A3) and biotinylation efficiency analysis of purified pHLA (MAGE‐A3). The HLA‐A*0201 and β 2 m inclusion bodies (IBs) were purified firstly, and then denatured protein products were refolded in vitro. The refolded products were purified by AKTA system. The desired fractions were collected and concentrated to do a biotinylation assay, and the reaction efficiency was checked on sodium dodecyl sulphate–polyacrylamide gel electrophoresis (SDS–PAGE). Lane M: protein ladder (NEB, P7703V); Lane 1: streptavidin (SA); Lane 2: pHLA (MAGE‐A3) monomer; Lanes 3–5: the mole ratio of SA to pHLA (MAGE‐A3) monomer is 1 : 1, 1 : 4, 1 : 8.
Figure 2
Figure 2
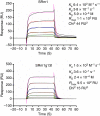
Surface plasmon resonance (SPR) analysis of the binding affinity between T‐cell receptors (TCRs) and the peptide human leucocyte antigen (pHLA) (MAGE‐A3). The binding activity of these TCRs was analysed by Biacore T200. CM5 Biacore chips were coated with streptavidin (SA) using amine coupling, then the biotinylated pHLA (MAGE‐A3) was captured on the active channel. After blocking non‐specific binding sites of both the reference and active channels with 50 mm biotin, SRm1and SRm1g13t were injected sequentially through the reference and active channels at various concentrations, and buffer alone was used as a blank control. The affinities of TCRs were determined by multiple cycle kinetics. And the analytic concentrations were 5, 10, 20, 40, 80, 160 μm for SRm1, and 2·5, 5, 10, 20, 40, 80, 160 μm for SRm1g13t. After subtracting the blank control signals, the data were fitted with a 1 : 1 binding model using Biacore T200 evaluation software to obtain the kinetic constants (k a, k d and K D).
Figure 3
Figure 3
SRm1g13t‐transfected CD3+ T‐cells showed potent function. (a) Schematic illustration of RNA expression vectors encoding SRm1 and SRm1g13t expression cassette. (b) Flow cytometric analysis of T‐cell receptor (TCR)‐transfected CD3+ T‐cells. Dot plots showing the FACS profiles of CD3+ T‐cells stained with anti‐human‐CD8‐APC antibody and peptide human leucocyte antigen (pHLA) (MAGE‐A3) tetramer‐PE, or anti‐human CD3‐FITC and anti‐mouse‐TCR beta‐APC antibodies. (c) Recognition of tumour cells by the TCR‐transfected CD3+ T‐cells. The CD3+ T‐cells transfected with SRm1 or SRm1g13t were co‐cultured for 24 hr with different tumour cells. The release of interferon (IFN)γ was measured by IFNγ enzyme‐linked immunosorbent spot (ELISpot) assay, and values indicated the mean of duplicate samples. (d) Specific killing of tumour cell lines by TCR‐transfected CD3+ T‐cells. Cytotoxicity activity of TCR‐transfected CD3+ T‐cells was determined by lactate dehydrogenase (LDH) release after 24 hr. Polyclonal CD3+ T‐cells, obtained from a healthy donor, were transfected and used at 75 000 cells per well at an effector to target ratio of 5 : 1. (e) Intracellular cytokine staining for interleukin (IL)‐2, tumour necrosis factor (TNF) α and IFNγ of SRm1‐ or SRm1g13t‐transfected CD3+ T‐cells after antigen‐specific stimulation. SRm1‐ or SRm1g13t‐transfected CD3+ T‐cells were co‐cultured with NCI‐H1299‐A2 overnight, the cells were then collected and stained for the detection of cell surface CD3 molecule expression and intracellular IL‐2, TNF α or IFNγ expression. The plots were gated on CD3+ T‐cells, and the percentage of positive cells was indicated in the upper‐right quadrant. A representative experiment was shown.
Figure 4
Figure 4
Antigen‐binding sensitivity and specificity of single‐chain T‐cell receptor (TCR) variable‐fragment (sTv) phage particles. Specific peptide human leucocyte antigen (pHLA) (MAGE‐A3) at different concentrations and non‐specific pHLA were coated in microtitres, and 1010 purified sTv and helper phage particles were applied to each well for phage ELISA. The same amount of helper phage was used as a negative control. The bound phages were detected with HRP‐conjugated anti‐M13 antibody. The binding signal was analysed at OD 450. The phage ELISA was performed as described above, except serial dilutions of purified specific pHLA (MAGE‐A3). The non‐specific pHLA was used at the concentration of 200 nm.
Figure 5
Figure 5
High‐affinity T‐cell receptors (HATs) refolded in vitro. (a and b) Coomassie‐stained sodium dodecyl sulphate–polyacrylamide gel electrophoresis (SDS–PAGE) of purified T‐cell receptors (TCRs). (a) After in vitro refolding, all TCRs were ultimately purified by gel filtration chromatography, and the desired fractions were collected and pooled to be analysed in non‐reducing SDS–PAGE. The non‐reduced TCRs run as a single band of 45 kDa. (b) The purified TCRs were analysed in reducing SDS–PAGE. The reduced TCRs run as two separate bands of 22 and 28 kDa, respectively. Lane M: protein marker; Lane 1: A31C2‐B31G1; Lane 2: A31C2‐B32B5; Lane 3: A31C2‐B32B6; Lane 4: A31C2‐B32C6; Lane 5: A31C2‐B32G3; Lane 6: A31C2‐B32G7; Lane 7: A31D5‐B31G1; Lane 8: A31D5‐B32B5; Lane 9: A31D5‐B32B6; Lane 10: A31D5‐B32C6; Lane 11: A31D5‐B32G3; Lane 12: A31D5‐B32G7; Lane 13: A32E6‐B31G1; Lane 14: A32E6‐B32B5; Lane 15: A32E6‐B32B6; Lane 16: A32E6‐B32C6; Lane 17: A32E6‐B32G3; Lane 18: A32E6‐B32G7. (c) Biacore T200 analysis of purified TCRs bound to the peptide human leucocyte antigen (pHLA) (MAGE‐A3) immobilized on CM5 sensor chip. The biotinylated pHLA (MAGE‐A3) was captured on the active channel, and all the TCRs were determined by single concentration (0·5 μm) kinetics. After subtracting the blank control signal, the data were fitted with a 1 : 1 binding model using Biacore T200 evaluation software to obtain the kinetic constants (k a, k d and K D). The kinetic constants of the 18 TCRs were obtained by setting their R max to constant values (using the formula: R max = level of captured pHLA × MWTCR/MW p HLA× 0·7) before fitting. MW, molecular weight.
Figure 6
Figure 6
Enhanced function in high‐affinity T‐cell receptor (HAT)‐transfected CD3+ T‐cells. (a and b) Flow cytometric analysis of T‐cell receptor (TCR)‐transfected CD3+ T‐cells. (a) Dot plots showing the FACS profile of transfected CD3+ T‐cells stained with anti‐human CD3‐FITC and anti‐mouse‐TCR beta‐APC antibodies. (b) Dot plots showing the FACS profile of transfected CD3+ T‐cells stained with anti‐human‐CD8‐APC antibody and peptide human leucocyte antigen (pHLA) (MAGE‐A3) tetramer‐PE. (c) Recognition of tumour cells by the TCR‐transfected CD3+ T‐cells. CD3+ T‐cells transfected with SRm1g13t, A31D5‐B32G3 or A32E6‐B32G3 were co‐cultured for 24 hr with different tumour cells. The release of interferon (IFN)γ was measured by IFNγ enzyme‐linked immunosorbent spot (ELISpot) assay, and values indicated the mean of duplicate samples. (d) Intracellular cytokine staining for tumour necrosis factor (TNF) α, interleukin (IL)‐2 and IFNγ of different affinity TCRs‐transfected CD3+ T‐cells after antigen‐specific stimulation. SRm1g13t‐, A31D5‐B32G3‐ or A32E6‐B32G3‐transfected CD3+ T‐cells were co‐cultured with NCI‐H1299‐A2 cells overnight. Cells were then collected and stained for the detection of cell surface CD3 expression and intracellular IL‐2, TNF α or IFNγ expression. The plots are gated on CD3+ T‐cells, and the percentage of positive cells was indicated in the upper‐right quadrant. A representative experiment was shown.

Similar articles

Cited by

References

    1. Morgan RA, Chinnasamy N, Abate‐Daga D, Gros A, Robbins PF, Zheng Z et al Cancer regression and neurological toxicity following anti‐MAGE‐A3 TCR gene therapy. J Immunother 2013; 36:133–51. - PMC - PubMed
    1. Robbins PF, Kassim SH, Tran TL, Crystal JS, Morgan RA, Feldman SA et al A pilot trial using lymphocytes genetically engineered with an NY‐ESO‐1‐reactive T‐cell receptor: long‐term follow‐up and correlates with response. Clin Cancer Res 2015; 21:1019–27. - PMC - PubMed
    1. Krogsgaard M, Davis MM. How T cells ‘see’ antigen. Nat Immunol 2005; 6:239–45. - PubMed
    1. Davis MM, Bjorkman PJ. T‐cell antigen receptor genes and T‐cell recognition. Nature 1988; 334:395–402. - PubMed
    1. Chapuis AG, Thompson JA, Margolin KA, Rodmyre R, Lai IP, Dowdy K et al Transferred melanoma‐specific CD8 + T cells persist, mediate tumor regression, and acquire central memory phenotype. Proc Natl Acad Sci USA 2012; 109:4592–7. - PMC - PubMed

Publication types