. 2018 May;18(10):e1700064.
doi: 10.1002/pmic.201700064. Epub 2018 May 2.

Identifying New Small Proteins in Escherichia coli

Affiliations

Identifying New Small Proteins in Escherichia coli

Caitlin E VanOrsdel et al. Proteomics. 2018 May.

Abstract

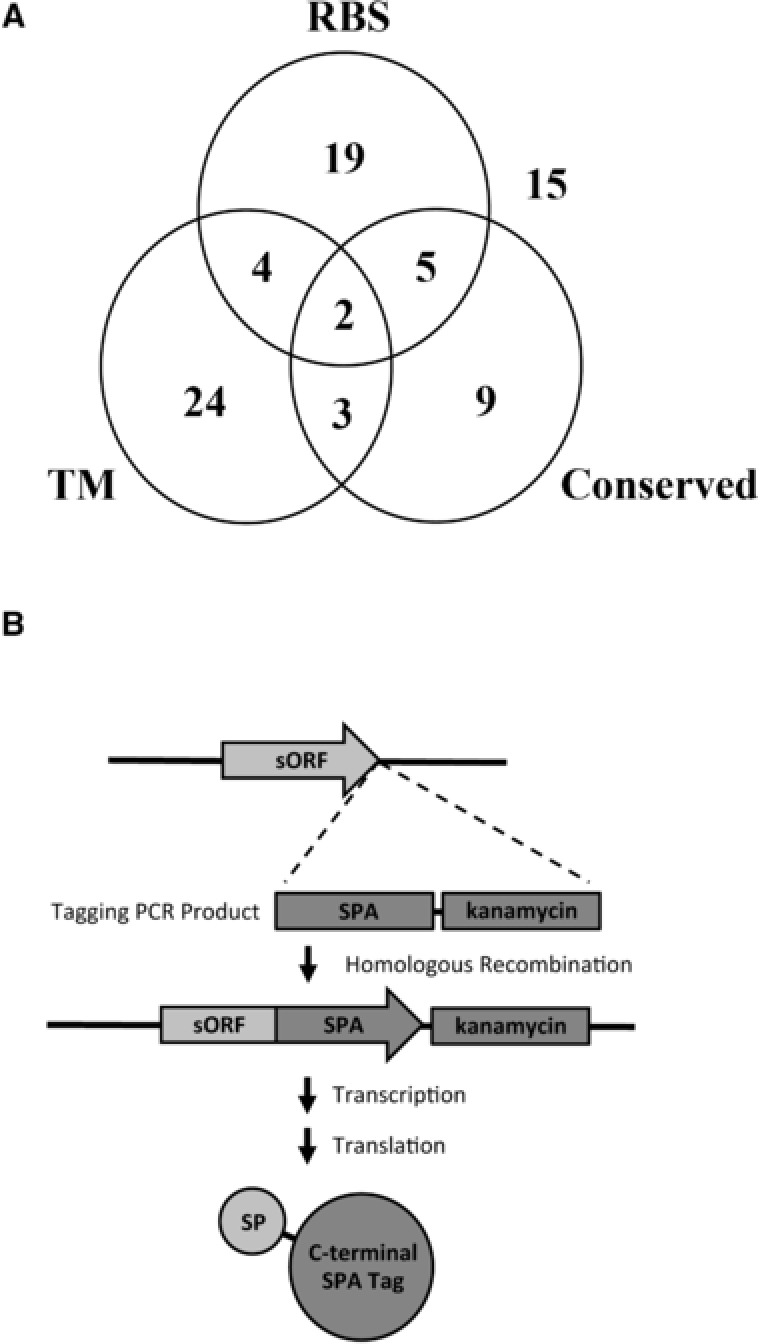
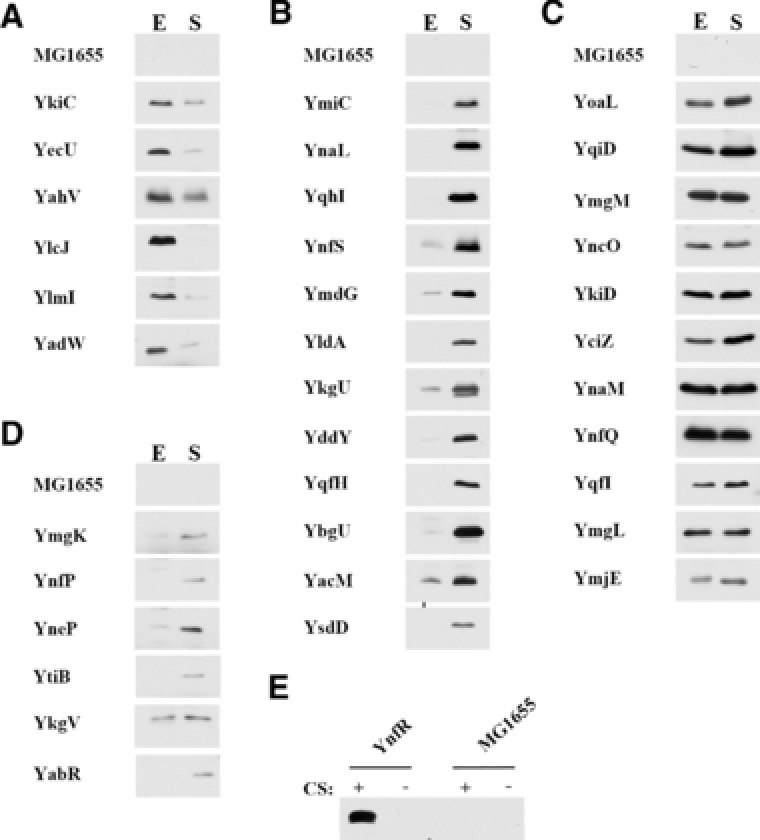
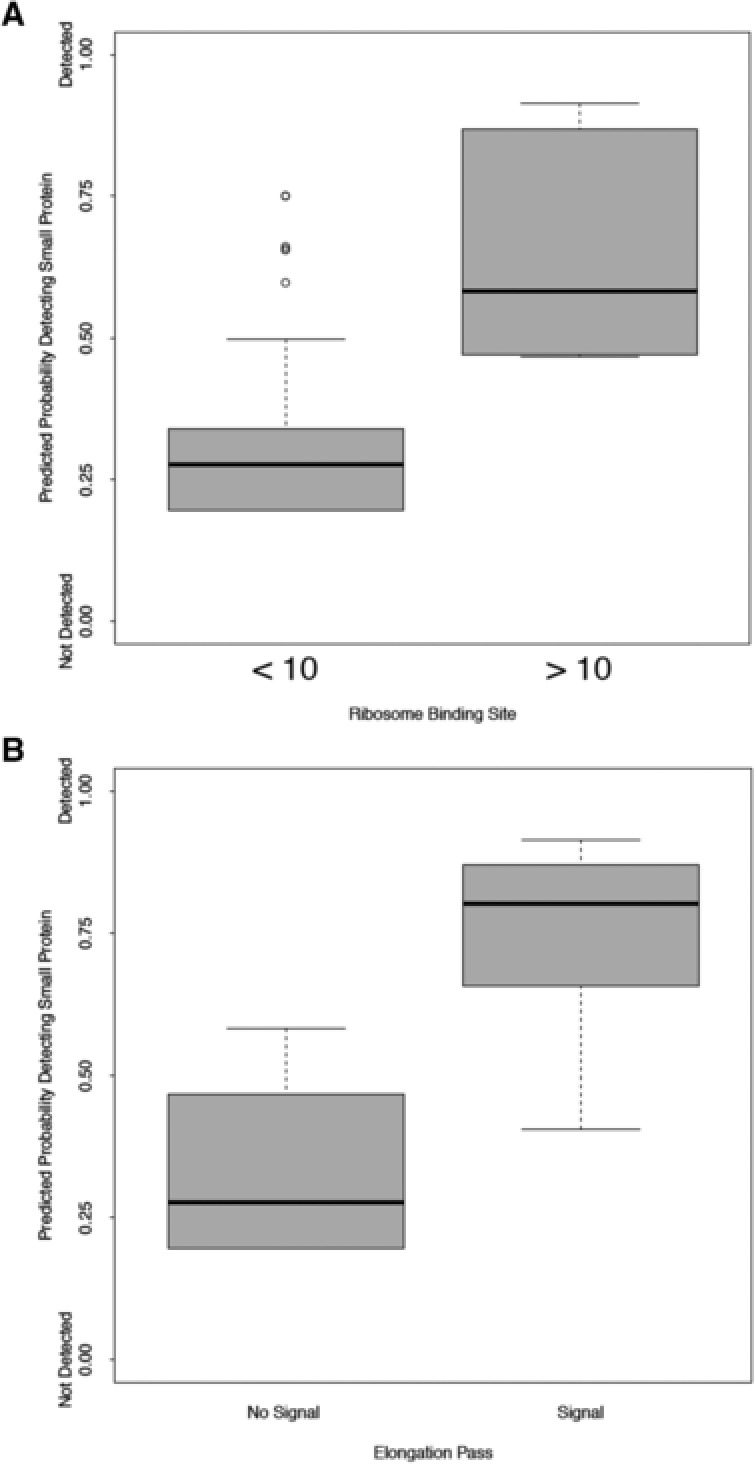
The number of small proteins (SPs) encoded in the Escherichia coli genome is unknown, as current bioinformatics and biochemical techniques make short gene and small protein identification challenging. One method of small protein identification involves adding an epitope tag to the 3' end of a short open reading frame (sORF) on the chromosome, with synthesis confirmed by immunoblot assays. In this study, this strategy was used to identify new E. coli small proteins, tagging 80 sORFs in the E. coli genome, and assayed for protein synthesis. The selected sORFs represent diverse sequence characteristics, including degrees of sORF conservation, predicted transmembrane domains, sORF direction with respect to flanking genes, ribosome binding site (RBS) prediction, and ribosome profiling results. Of 80 sORFs, 36 resulted in encoded synthesized proteins-a 45% success rate. Modeling of detected versus non-detected small proteins analysis showed predictions based on RBS prediction, transcription data, and ribosome profiling had statistically-significant correlation with protein synthesis; however, there was no correlation between current sORF annotation and protein synthesis. These results suggest substantial numbers of small proteins remain undiscovered in E. coli, and existing bioinformatics techniques must continue to improve to facilitate identification.

Keywords: SPA-tagging; small proteins.


Figures

Figure 1
Figure 1
Testing sORFs for SP synthesis. A) sORFs selected for experimentation grouped according to bioinformatic characteristics. The numbers represent the sORFs selected with an RBS bits of >10 (“RBS”), conservation in at least three genera outside Escherichia and Shigella (“Conserved”), and/or a predicted transmembrane domain in the putative protein (“TM”). B) Strategy used to SPA‐tag sORFs for detection of SP synthesis. A PCR product containing the SPA tag and a kanamycin resistance cassette was amplified with flanking DNA homologous to the sORF and its downstream region. The PCR product was transformed into a recombinase‐positive strain, and recombinants were identified by kanamycin resistance and PCR screening using primers flanking the sORF. Sequencing of the sORF and the tag was performed to confirm that the SPA tag was inserted at the 3′ end of the sORF immediately upstream of the stop codon. SPs were detected by immunoblot analysis using an antibody that recognizes the C‐terminal SPA tag introduced at the 3′ end of the sORF.
Figure 2
Figure 2
SPs detected in cells grown in rich media. Immunoblot analysis using anti‐3xFLAG, horseradish peroxidase‐conjugated antibodies was performed with whole‐cell extracts from MG1655 cultures. A) Cultures were grown to Exponential (E) and Stationary (S) phases in LB media. MG1655 control samples were run in each blot, with representative MG1655 lanes shown. Bands shown for the SPA‐tagged sORF strains are unique bands that were not observed in the control lanes. B) sORF strains where the novel SPA‐tagged band resolves close to cross‐reacting bands seen in the control lanes. SPA‐tagged SP bands are labeled with a (*). C) Evidence of the yrbN_PAIR_0 SP accumulating to detectable levels in cold‐shocked cultures. In all cases, a fraction equivalent to the cells in OD600 = 0.057 was loaded in each lane. Exposure times were optimized for each panel for visualization, thus band intensities in different blots do not reflect relative abundance of each SP.
Figure 3
Figure 3
Correlation of ribosome binding site (RBS) model and ribosome profiling data with SP synthesis. A) Predicted probability of detecting an SP based on RBS data. The x‐axis is divided into those sORFs with an RBS bits of less than 10 (“<10”) and greater than 10 (“>10”). B) Predicted probability of detecting an SP based on ribosome profiling results. The x‐axis is dividing into those sORFs with a positive evaluation for ribosome binding compared to flanking genes (“+”) and those with a negative evaluation for ribosome binding compared to flanking genes (“−”). Evaluations of ribosome binding compared to flanking genes were performed as described in Materials and Methods. The y‐axis of both graphs shows the relative predicted probability of detecting an SP encoded in a given sORF, with 0.0 being 0%, up to 1.00, being 100%.

References

    1. Storz G., Wolf Y., Ramamurthi K., Annu. Rev. Biochem. 2014, 83, 753. - PMC - PubMed
    1. Garbis S., Lubec G., Fountoulakis M., J. Chromatogr. A 2005, 1077, 1. - PubMed
    1. Levin P., Fan N., Ricca E., Driks A., Losick R., Cutting S., Mol. Microbiol. 1993, 9, 761. - PubMed
    1. Galperin M., Mekhedov S., Puigbo P., Smirnov S., Wolf Y., Rigden D., Environ. Microbiol. 2012, 14, 2870. - PMC - PubMed
    1. Handler A., Lim J., Losick R., Mol. Microbiol. 2008, 68, 588. - PMC - PubMed

Publication types

MeSH terms

Substances

LinkOut - more resources