Review
. 2018 Apr 1;7(4):1-31.
doi: 10.1093/gigascience/giy014.

Bipartite graphs in systems biology and medicine: a survey of methods and applications

Affiliations
Review

Bipartite graphs in systems biology and medicine: a survey of methods and applications

Georgios A Pavlopoulos et al. Gigascience. .

Erratum in

Abstract

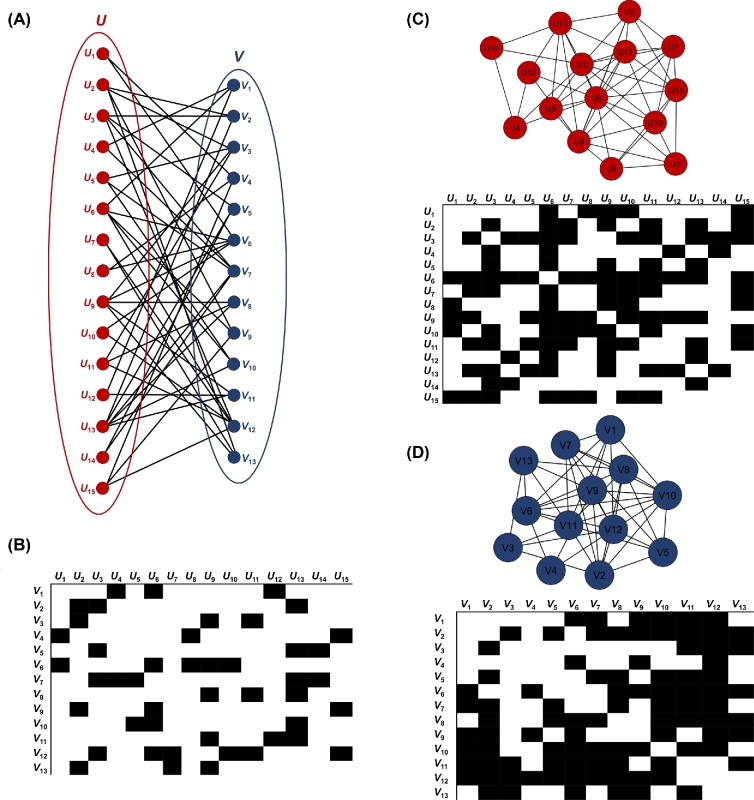
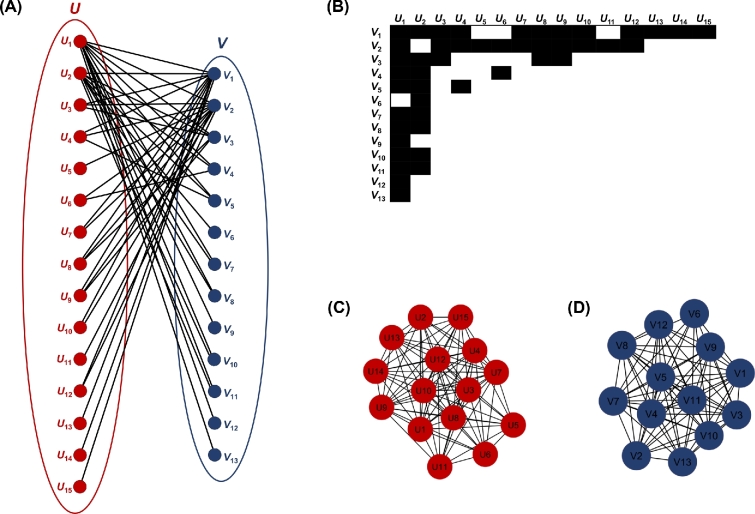
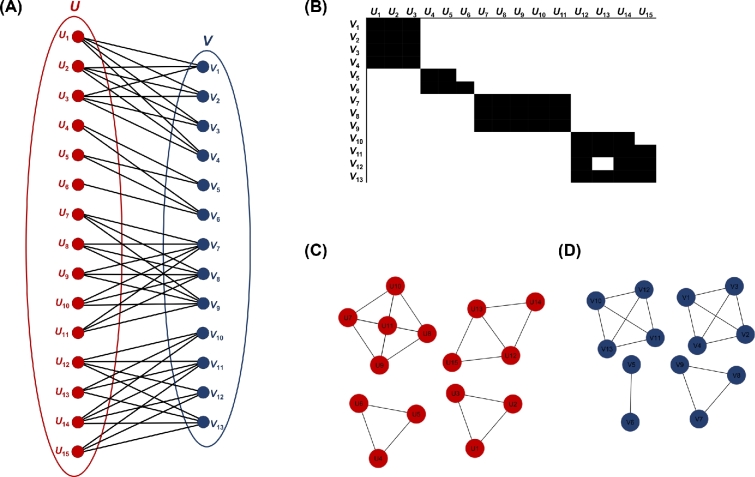
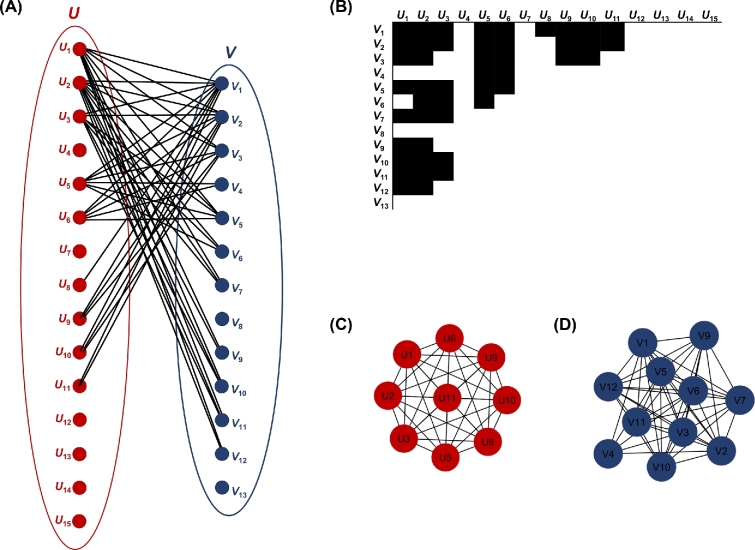
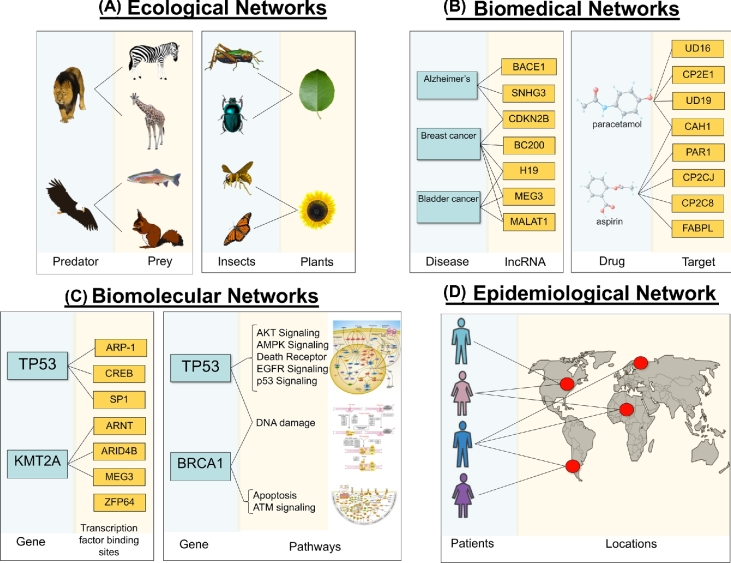
The latest advances in high-throughput techniques during the past decade allowed the systems biology field to expand significantly. Today, the focus of biologists has shifted from the study of individual biological components to the study of complex biological systems and their dynamics at a larger scale. Through the discovery of novel bioentity relationships, researchers reveal new information about biological functions and processes. Graphs are widely used to represent bioentities such as proteins, genes, small molecules, ligands, and others such as nodes and their connections as edges within a network. In this review, special focus is given to the usability of bipartite graphs and their impact on the field of network biology and medicine. Furthermore, their topological properties and how these can be applied to certain biological case studies are discussed. Finally, available methodologies and software are presented, and useful insights on how bipartite graphs can shape the path toward the solution of challenging biological problems are provided.


Figures

Figure 1:
Figure 1:
Construction of unipartite networks from a bipartite network. (A) The bipartite network. (B) The biadjacency matrix of the bipartite network. (C) The first unipartite network with its adjacency matrix. (D) The second unipartite network with its adjacency matrix. The adjacency matrices are symmetrical across the diagonal line.
Figure 2:
Figure 2:
Network nestedness. Example of (A) a bipartite network, (B) the biadjacency matrix of the bipartite network, and (C,D) the projected unipartite networks.
Figure 3:
Figure 3:
Network modularity. Example of (A) a bipartite network, (B) the biadjacency matrix of the bipartite network, and (C, D) the corresponding unipartite networks.
Figure 4:
Figure 4:
Mixed network (nested + modular). Example of (A) a bipartite network, (B) the biadjacency matrix of the bipartite network, and (C, D) the projected unipartite networks.
Figure 5:
Figure 5:
Overview and examples of various types of networks. (A) Ecological networks. An example of a predator–prey (left) and host–parasite example (right) network. (B) Biomedical networks. An example of a disease–gene (left) and a drug–target (right) network. (C) Biomolecular networks. An example of a gene–transcription factor binding site (left) and a gene–pathway (right) network. (D) Epidemiological network. An example of a patient–location network.
Figure 6:
Figure 6:
Numerical examples. (A) A small bipartite network, its adjacency matrix, several calculated topological features for the whole graph, and node ranking according to degree and betweenness centrality. Information relevant to projected unipartite networks (B and C).
Figure 7:
Figure 7:
Two examples of the way some topological features of the projected unipartite networks are affected by the bipartite graph's nestedness. (A) Nested bipartite graph. (B) Fully nested bipartite graph. The higher the nestedness of the bipartite graph, the more connected the projected networks. Maximum nestedness leads to fully connected unipartite networks (cliques).
Figure 8:
Figure 8:
Example of the extent to which a bipartite graph's modularity affects the unipartite projected networks.
Figure 9:
Figure 9:
A test case of a bipartite gene–disease network from the genetic association database. (A) Topological features of the whole bipartite network. (B) Data example of bipartite network (gene–disease). (C) Circular visualization of the bipartite network (genes, red; diseases, blue) using PowerClust. (D) Random visualization of the bipartite network showing the directed connections between the 2 disjoint sets of nodes using PowerClust. (E) Random visualization of the bipartite network showing the indirect connections between the 2 disjoint sets of nodes using PowerClust. (F) Topological features of the projected disease–disease network and an example of the monopartite network and different types of visualization. (G) Topological features of the projected gene–gene network and an example of the monopartite network and different types of visualization.
Figure 10:
Figure 10:
Various types of visualizations of n-partite networks. (A) Visualization using a generic network tool such as Cytoscape. Nodes from each group are colored accordingly. (B) Vertical bipartite visualization. (C) Circular visualization using a Circos-like view often used in genomics. (D) A hive plot view visualizing a tripartite graph. (E) Visualization of a multilayered network using Arena3D. (F) Visualization of a bipartite network over a world map.

Similar articles

Cited by

References

    1. Fields S, Song O. A novel genetic system to detect protein-protein interactions. Nature 1989;340(6230):245–6. - PubMed
    1. Zhu H, Bilgin M, Bangham R et al. . Global analysis of protein activities using proteome chips. Science 2001;293(5537):2101–5. - PubMed
    1. Ito T, Chiba T, Ozawa R et al. . A comprehensive two-hybrid analysis to explore the yeast protein interactome. Proceedings of the National Academy of Sciences 2001;98(8):4569–74. - PMC - PubMed
    1. Uetz P, Giot L, Cagney G et al. . A comprehensive analysis of protein-protein interactions in Saccharomyces cerevisiae. Nature 2000;403(6770):623–7. - PubMed
    1. McCraith S, Holtzman T, Moss B et al. . Genome-wide analysis of vaccinia virus protein-protein interactions. Proceedings of the National Academy of Sciences 2000;97(9):4879–84. - PMC - PubMed

Publication types