. 2018 Apr 12;16(4):e2003998.
doi: 10.1371/journal.pbio.2003998. eCollection 2018 Apr.

Stable centrosomal roots disentangle to allow interphase centriole independence

Affiliations

Stable centrosomal roots disentangle to allow interphase centriole independence

Robert Mahen. PLoS Biol. .

Update in

Abstract

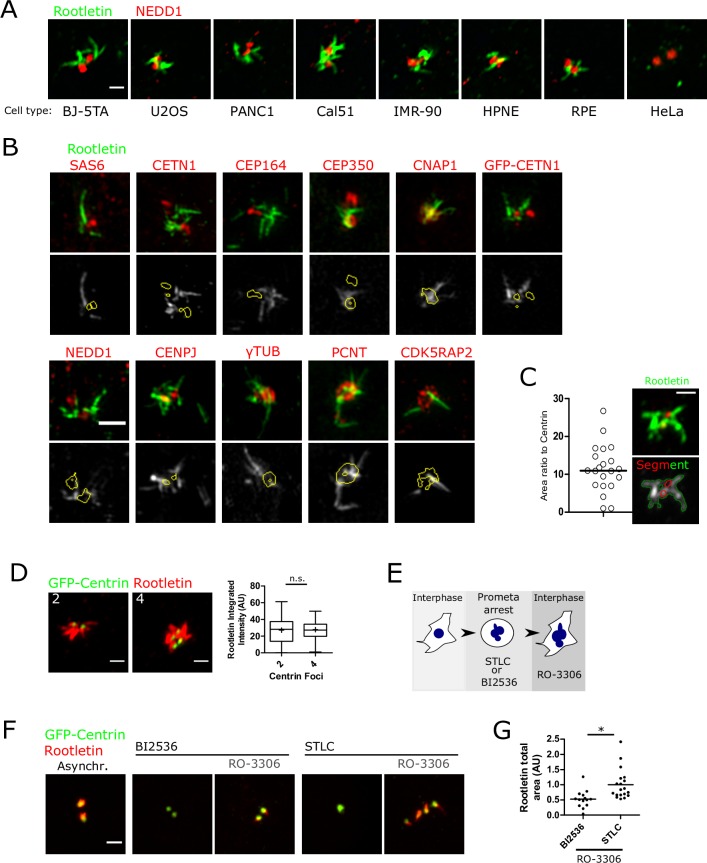
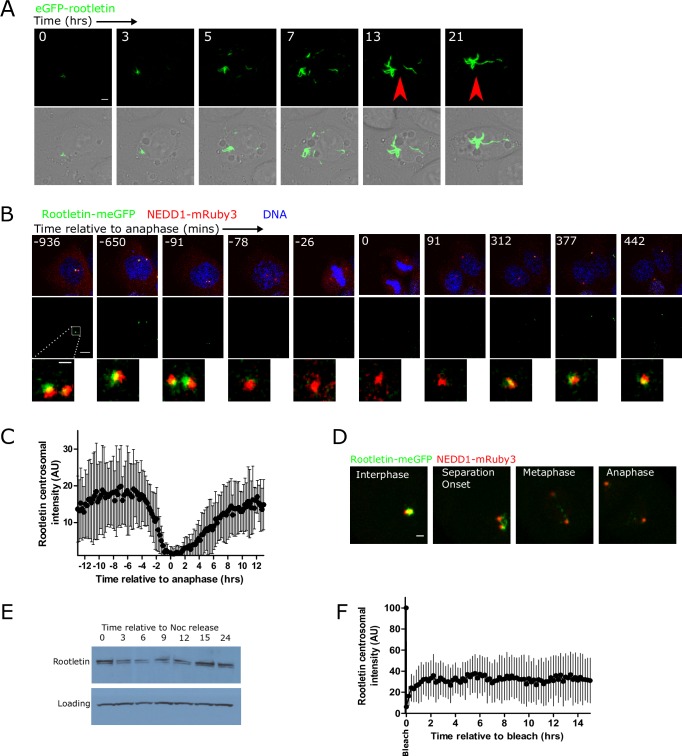
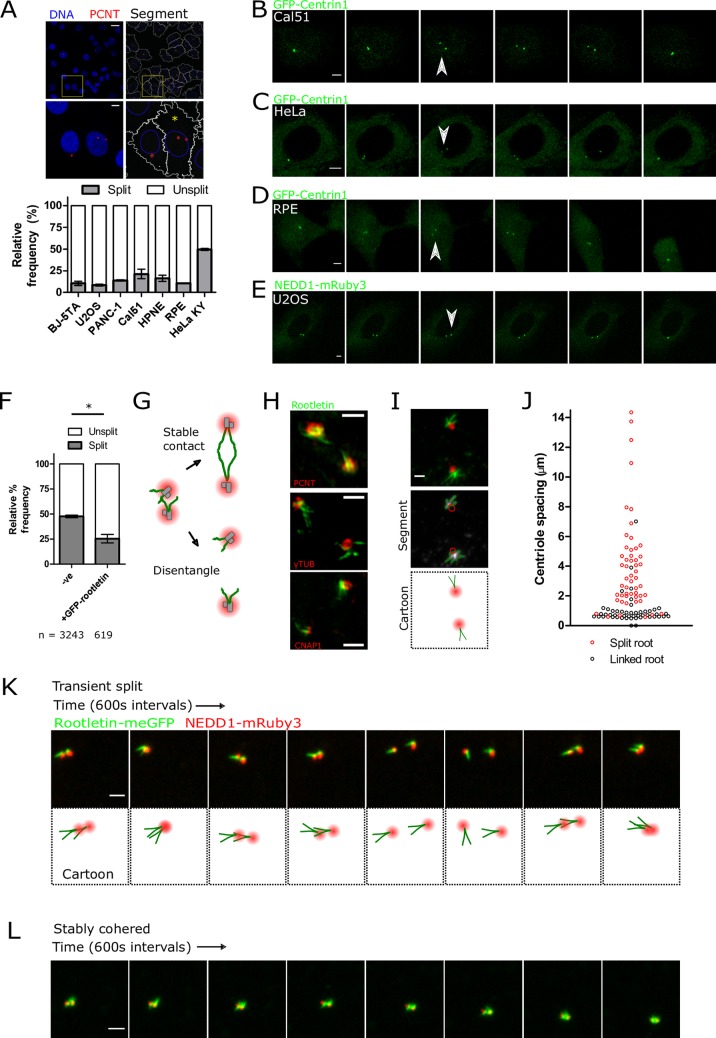
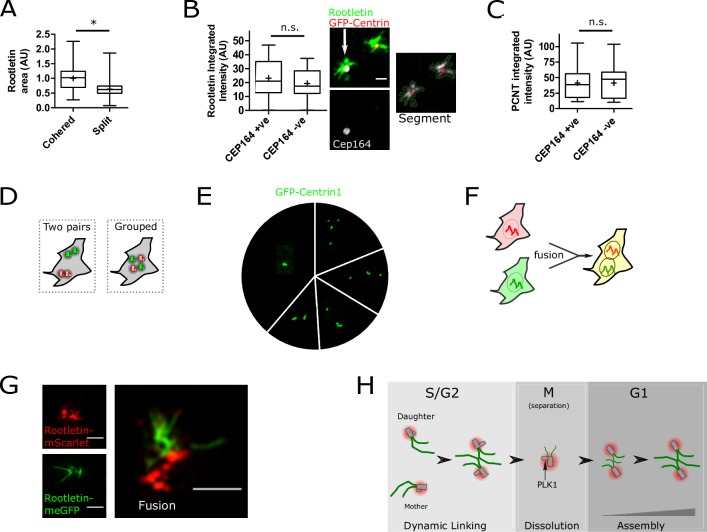
The centrosome is a non-membrane-bound cellular compartment consisting of 2 centrioles surrounded by a protein coat termed the pericentriolar material (PCM). Centrioles generally remain physically associated together (a phenomenon called centrosome cohesion), yet how this occurs in the absence of a bounding lipid membrane is unclear. One model posits that pericentriolar fibres formed from rootletin protein directly link centrioles, yet little is known about the structure, biophysical properties, or assembly kinetics of such fibres. Here, I combine live-cell imaging of endogenously tagged rootletin with cell fusion and find previously unrecognised plasticity in centrosome cohesion. Rootletin forms large, diffusionally stable bifurcating fibres, which amass slowly on mature centrioles over many hours from anaphase. Nascent centrioles (procentrioles), in contrast, do not form roots and must be licensed to do so through polo-like kinase 1 (PLK1) activity. Transient separation of roots accompanies centriolar repositioning during the interphase, suggesting that centrioles organize as independent units, each containing discrete roots. Indeed, forced induction of duplicate centriole pairs allows independent reshuffling of individual centrioles between the pairs. Therefore collectively, these findings suggest that progressively nucleated polymers mediate the dynamic association of centrioles as either 1 or 2 interphase centrosomes, with implications for the understanding of how non-membrane-bound organelles self-organise.


Conflict of interest statement

The authors have declared that no competing interests exist.

Figures

Fig 1
Fig 1. Centrosomal roots are large bifurcating fibres licensed to form on procentrioles by PLK1 activity.
(A) Systematic immunofluorescent airyscan imaging of rootletin (green) and the PCM marker NEDD1 (red), using the same conditions throughout all cell types. Confocal slices are shown. Scale bar 1 μm. (B) 3D SIM imaging of rootletin (green) and various centrosomal components (red). Rootletin is stained either by anti-rootletin antibody or by anti-GFP nanobody. Z-projections and single z-slices with segmentation are shown on the top and bottom rows, respectively. Scale bar 1 μm. (C) Quantification of the ratio of rootletin immunostaining area relative to GFP-Centrin 1 area from maximum-intensity projected airyscan images. (D) Rootletin immunofluorescent staining is equal in unreplicated centrosomes and diplosomes. Centrosomes were classified based on GFP-Centrin1 foci number, and anti-rootletin staining was segmented. Scale bar 1 μm. The mean is shown as + and the median as a horizontal bar. n.s., t test. N = 21 cells. Note that rootletin is shown in red in this panel. (E) Cells were arrested in prometaphase with either STLC (Eg5 inhibition) or BI2536 (PLK1 kinase inhibition) before being forced into interphase with RO-3306 (CDK1 inhibition). (F) Cells expressing GFP-Centrin1 (green) were treated as depicted in panel E before staining with anti-rootletin antibody (red). Maximum-intensity projections are shown. Scale bar 1 μm. (G) Root area per cell was quantified by direct segmentation of rootletin staining from images obtained as described in panel F. The horizontal bar shows the median. *P = 0.0006, t test. See S1 Data for source data for the charts. 3D, three-dimensional; CDK1, cyclin-dependent kinase 1; NEDD1, neural precursor cell expressed, developmentally down-regulated 1; PCM, pericentriolar material; PLK1, polo-like kinase 1; SIM, structured illumination microscopy; STLC, S-trityl-L-cysteine.
Fig 2
Fig 2. Diffusionally stable roots are progressively formed from anaphase.
(A) eGFP-rootletin fibres progressively assemble following transfection. The images are timepoints from a single cell, taken by live-cell 3D confocal time-lapse imaging. The arrows point to a fusion event of 2 preexisting fibres. Scale bar 3 μm. See also S1 Video for the full time course. (B) Representative images from single-cell 3-colour 3D confocal time-lapse imaging of rootletin-meGFP (green), NEDD1-mRuby3 (red; marking the PCM), and DNA (blue; marked by SiR-hoechst), showing root disassembly during mitosis. Images were smoothed for display purposes here using a 2-pixel median filter, but not for analysis. Scale bar 1 μm. See also S2 Video. (C) Cell cycle–dependent changes in rootletin-meGFP centrosomal fluorescence intensity. Centrosomes were automatically tracked as described in Materials and methods. Individual cell traces were manually aligned relative to anaphase onset based on SiR-hoechst staining of DNA (time 0). Mean +/- SD; N = 17 cells. (D) Root splitting during centrosome separation in early mitosis, showing rootletin-meGFP (green) and NEDD1-mRuby3 (red). Scale bar 2 μm. (E) Cell cycle–dependent changes in rootletin levels by western blot. Cells were synchronised in nocodazole, released, and harvested at different cell cycle stages, and western blotted with anti-rootletin antibody. (F) FRAP recovery curve over 15 hours, plotting the mean ± SD centrosomal intensity of rootletin-meGFP from 3D confocal imaging after bleaching the fluorescence of the whole centrosome, in thymidine-arrested cells. Centrosome position was tracked independently of rootletin-meGFP fluorescence through simultaneous NEDD1-mRuby3 imaging in a spectrally distinct channel. N = 11 cells. FRAP, fluorescence recovery after photobleaching; meGFP, monomeric enhanced green fluorescent protein; NEDD1, neural precursor cell expressed, developmentally down-regulated 1; PCM, pericentriolar material.
Fig 3
Fig 3. Roots disentangle during transient centriole splitting in interphase.
(A) Quantification of centrosome cohesion in the interphase of various cell types through systematic immunofluorescent staining and analysis. The images show representative staining of PCNT (red; marking centrosomal PCM) and DNA (blue; hoechst 44432). The right panel shows representative segmentation of centrosomes (red), nuclei (blue), and cytoplasm (white) in Cal51 cells. The yellow asterisk denotes a cell containing 2 centrosome foci, separated by >1.5 μm. Scale bars 20 μm and 5 μm. The bar graph shows the mean percentage of cells with PCNT centroids separated by >1.5 μm, from a minimum of 500 cells. Error bars show SEM from 2 experiments. (B–E) Selected frames showing centriole splitting in live 3D confocal time-lapse imaging. Centrosomes are marked by either GFP-Centrin1 or NEDD1-mRuby3. Arrows denote centriole splitting events. The time intervals between frames are 12 minutes (panel B and C), 24 minutes (panel D), or 8 minutes (panel E). Scale bar 5 μm. See also S3–S5 Videos. (F) Centrosome cohesion in HeLa cells ± overexpression of eGFP-rootletin, measured by automated imaging and analysis. Horizontal bars show the mean of 2 experiments ± SD. *P < 0.001 by Fischer’s exact test. (G) Opposing models of root behaviour during centriole splitting, termed ‘Stable contact’ or ‘Disentangle’. (H) Representative 3D SIM images of roots (green) after centriole splitting, with the indicated costaining marking either the PCM or centrioles (red). Scale bar 1 μm. (I) Representative airyscan image of roots after centriole splitting. Scale bar 1μm. (J) Root linkage plotted as a function of centriole spacing distance. (K, L) Live-cell airyscan time-lapse imaging of endogenous rootletin-meGFP and NEDD1-mRuby3 during a centriole split (panel K) and when remaining stably cohered (panel L) in Cal51 cells. Scale bar 2 μm. See also S6 Video and S7 Video. See S1 Data for source data for the charts.; meGFP, monomeric enhanced green fluorescent protein; NEDD1, neural precursor cell expressed, developmentally down-regulated 1; PCM, pericentriolar material; PCNT, Pericentrin; SIM, structured illumination microscopy.
Fig 4
Fig 4. Independence of mother and daughter centrioles during interphase.
(A) Root fibre area is significantly lower (P < 0.0001, t test) in split versus cohered centrioles. Anti-rootletin immunofluorescent staining was imaged and segmented, N = 36 cells from 2 experiments. (B) Rootletin immunofluorescent staining (green) is the same at both the mother or daughter centriole (n.s., t test). “M” and “D” denote mother and daughter, respectively, on the basis of CEP164 positivity. N = 21 cells per sample. Scale bar 1 μm. (C) PCNT immunofluorescent staining (of the PCM) is the same (n.s., t test) on either mother or daughter centrioles. Cells were imaged and analysed as described in panel B, except segmenting PCNT. N = 21 cells. See S1 Data for source data for the charts. (D) Cells with 4 centrioles might either maintain them as separate pairs or cohere them together (“Grouped”). (E) The pie chart shows the proportion of each GFP-Centrin1 centriole configuration in cells with 4 centrioles, produced as depicted in Fig 1E. The images are representative of each configuration. N = 196 cells. (F) Cells expressing endogenously tagged rootletin-meGFP were fused with cells expressing endogenously tagged rootletin-mScarlet. (G) Representative SIM images of single-colour cells and a fused cell, created as depicted in Fig 4F and described in Materials and methods. Scale bars 1 μm throughout. (H) Interphase centriole pairs contain large bifurcating fibres that disentangle when centrioles move apart >1.5 μm relative to each other. Root dissolution begins prior to mitotic centrosome separation and chromosome condensation. At the time of centrosome separation, roots are diminished in quantity and ripped apart during poleward movement of centrosomes. Roots form slowly over many hours from anaphase, as diffusionally stable fibres. PLK1-dependent modification of procentrioles allows root formation in the ensuing cell cycle. meGFP, monomeric enhanced green fluorescent protein; PCNT, Pericentrin; PLK1, polo-like kinase 1; SIM, structured illumination microscopy.

Similar articles

Cited by

References

    1. Schmidt KN, Kuhns S, Neuner A, Hub B, Zentgraf H, Pereira G. Cep164 mediates vesicular docking to the mother centriole during early steps of ciliogenesis. J Cell Biol. 2012;199: 1083–1101. doi: 10.1083/jcb.201202126 - DOI - PMC - PubMed
    1. Bahe S, Stierhof Y-D, Wilkinson CJ, Leiss F, Nigg EA. Rootletin forms centriole-associated filaments and functions in centrosome cohesion. J Cell Biol. 2005;171: 27–33. doi: 10.1083/jcb.200504107 - DOI - PMC - PubMed
    1. Bernhard W, De Harven E. [Electron microscopic study of the ultrastructure of centrioles in vertebra]. Z Zellforsch Mikrosk Anat Vienna Austria 1948. 1956;45: 378–398. - PubMed
    1. Bornens M, Paintrand M, Berges J, Marty MC, Karsenti E. Structural and chemical characterization of isolated centrosomes. Cell Motil Cytoskeleton. 1987;8: 238–249. doi: 10.1002/cm.970080305 - DOI - PubMed
    1. Graser S, Stierhof Y-D, Nigg EA. Cep68 and Cep215 (Cdk5rap2) are required for centrosome cohesion. J Cell Sci. 2007;120: 4321–4331. doi: 10.1242/jcs.020248 - DOI - PubMed

Publication types

MeSH terms