. 2018 Apr 12;14(4):e1006095.
doi: 10.1371/journal.pcbi.1006095. eCollection 2018 Apr.

Principles that govern competition or co-existence in Rho-GTPase driven polarization

Affiliations

Principles that govern competition or co-existence in Rho-GTPase driven polarization

Jian-Geng Chiou et al. PLoS Comput Biol. .

Abstract

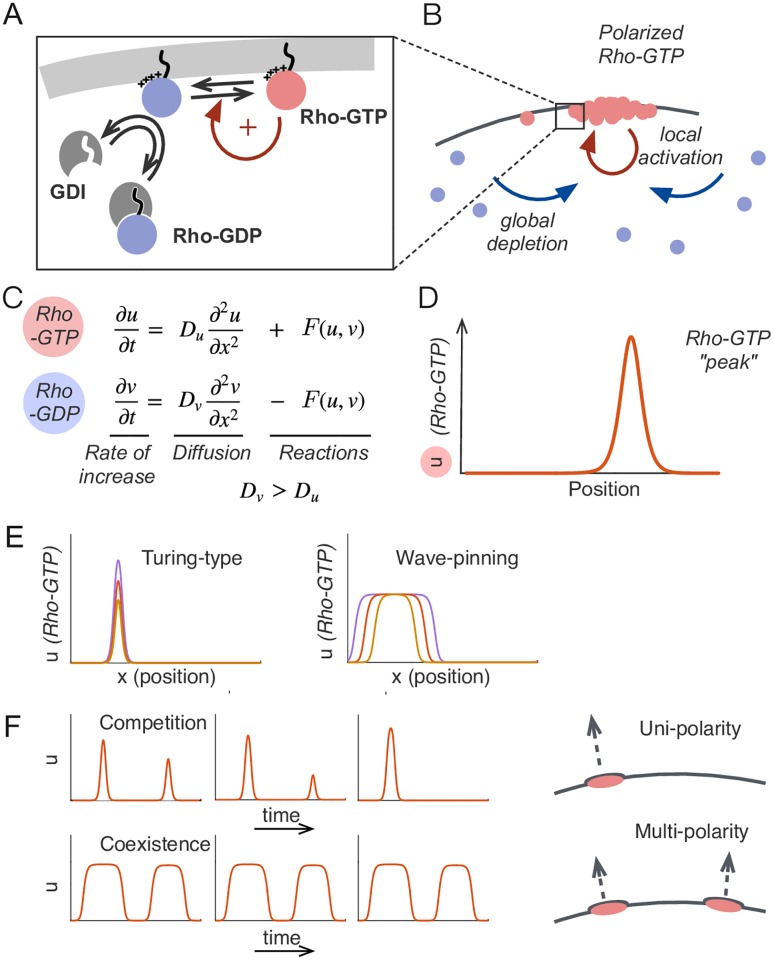
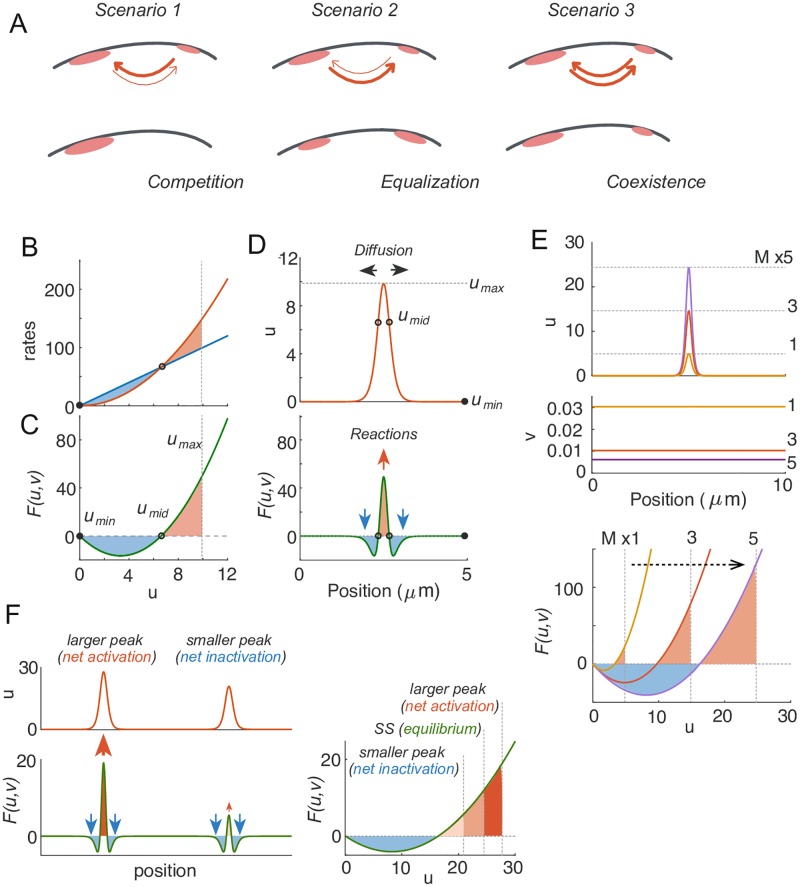
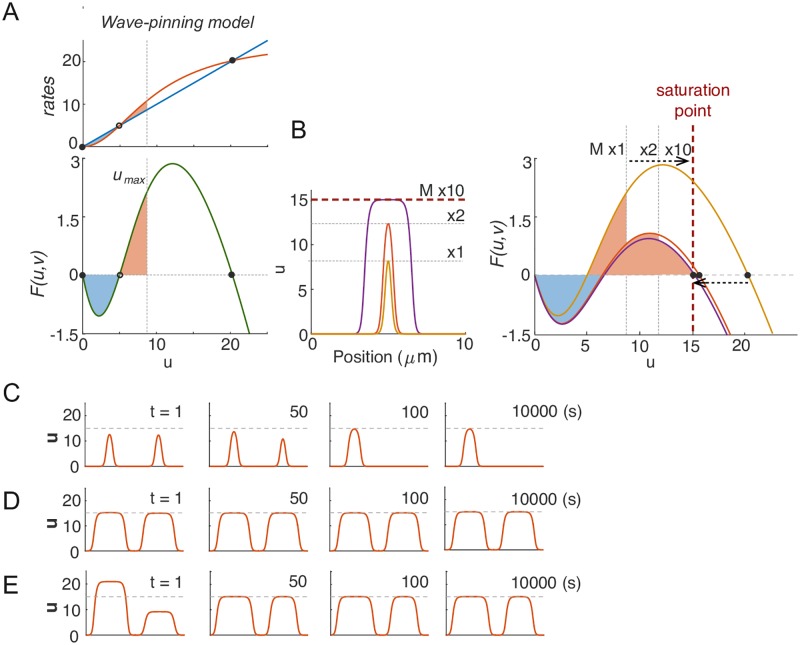
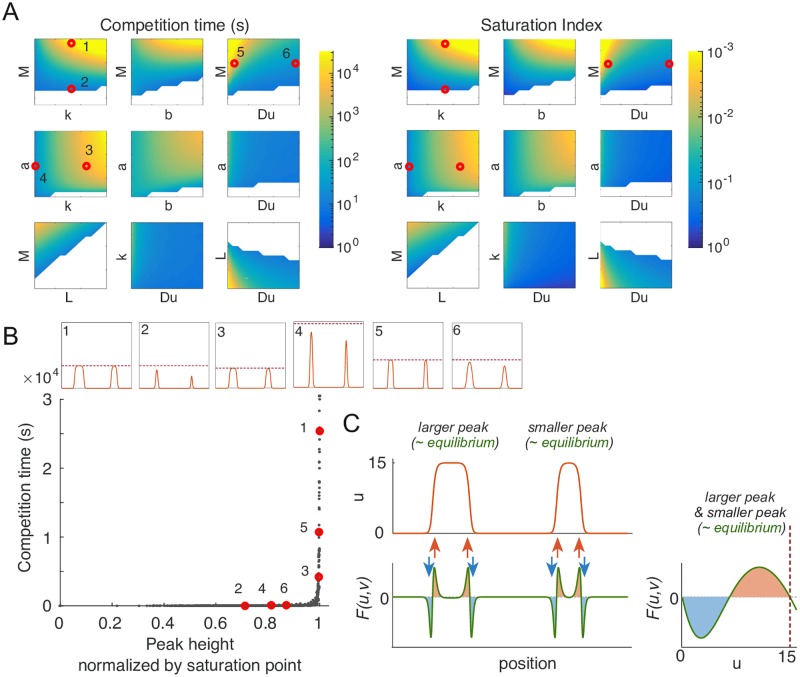
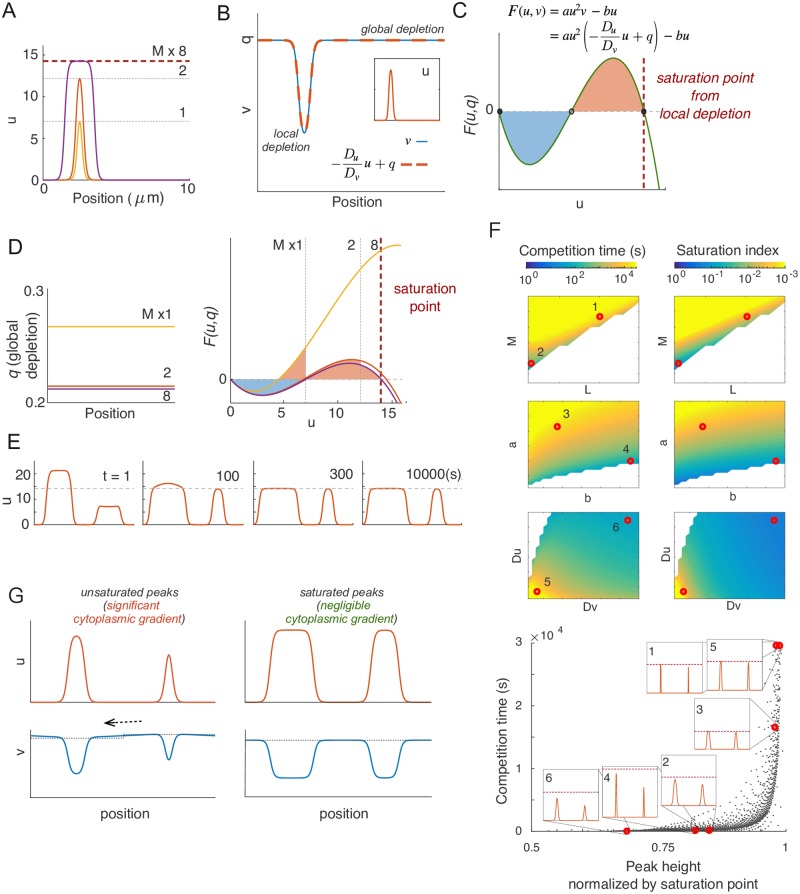
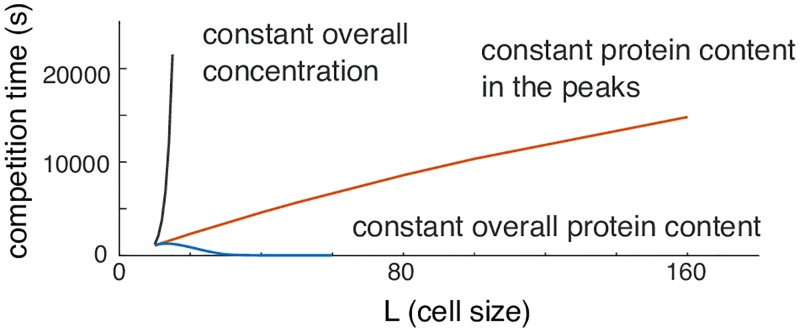
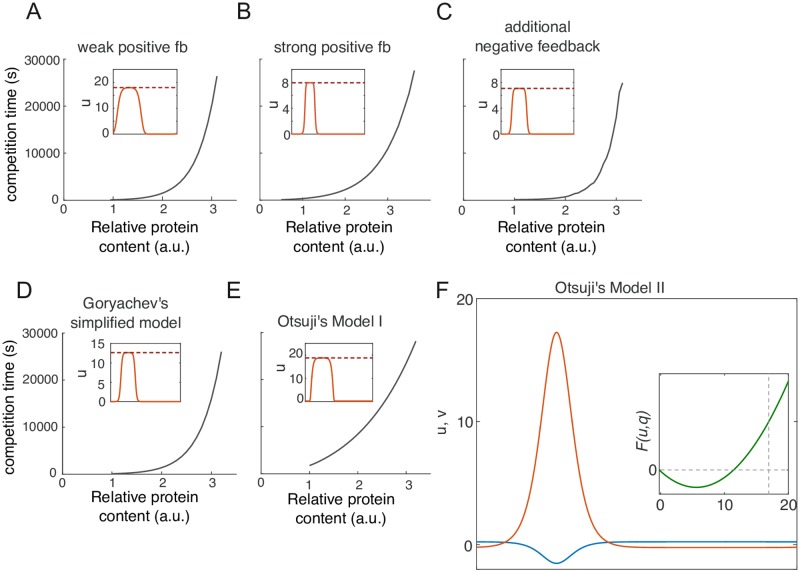
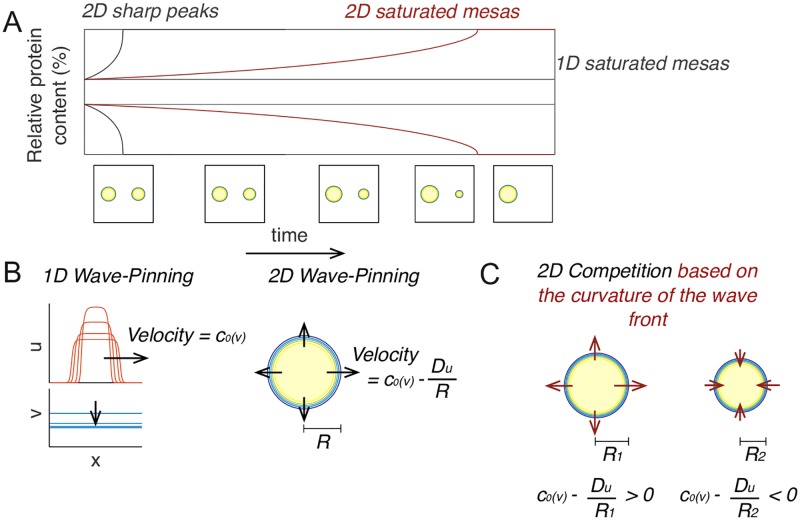
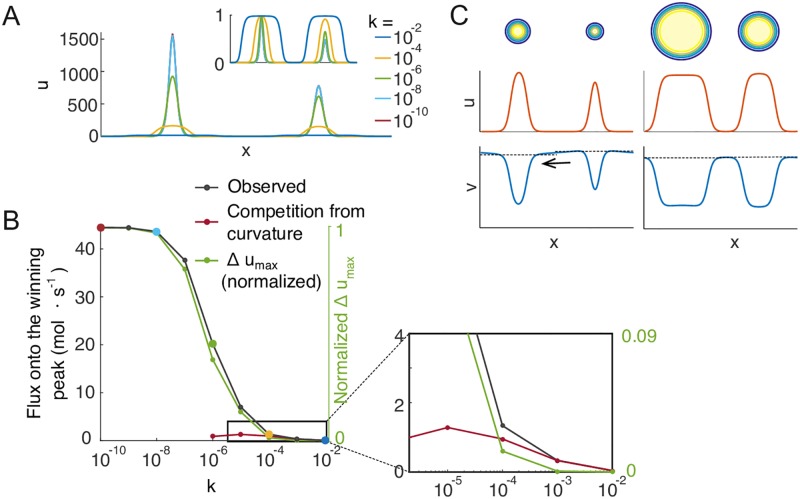
Rho-GTPases are master regulators of polarity establishment and cell morphology. Positive feedback enables concentration of Rho-GTPases into clusters at the cell cortex, from where they regulate the cytoskeleton. Different cell types reproducibly generate either one (e.g. the front of a migrating cell) or several clusters (e.g. the multiple dendrites of a neuron), but the mechanistic basis for unipolar or multipolar outcomes is unclear. The design principles of Rho-GTPase circuits are captured by two-component reaction-diffusion models based on conserved aspects of Rho-GTPase biochemistry. Some such models display rapid winner-takes-all competition between clusters, yielding a unipolar outcome. Other models allow prolonged co-existence of clusters. We investigate the behavior of a simple class of models and show that while the timescale of competition varies enormously depending on model parameters, a single factor explains a large majority of this variation. The dominant factor concerns the degree to which the maximal active GTPase concentration in a cluster approaches a "saturation point" determined by model parameters. We suggest that both saturation and the effect of saturation on competition reflect fundamental properties of the Rho-GTPase polarity machinery, regardless of the specific feedback mechanism, which predict whether the system will generate unipolar or multipolar outcomes.


Conflict of interest statement

The authors have declared that no competing interests exist.

Figures

Fig 1
Fig 1. Polarity establishment and competition in mass conserved activator-substrate (MCAS) models.
A) Rho-GTPases are tethered to the plasma membrane by prenylation and positive charges. The inactive GDP-bound form, or “substrate”, is preferentially bound by the GDI, masking the prenyl group and the positively charged residues, extracting the substrate to the cytoplasm. The active GTP-bound form, or “activator”, promotes local activation of more substrate, yielding positive feedback. B) Local activation via positive feedback and depletion of the substrate in the cytosol generates an activator-enriched domain on the cortex. C) The interconversions of Rho-GTPases between active and inactive forms can be modeled as a system of two reaction-diffusion equations governing the dynamics of the slowly-diffusing activator u and the rapidly-diffusing substrate v. The model conserves mass: generation of u is precisely matched by consumption of v (and vice versa) in the reaction term F(u, v). D) MCAS models generate peaks in the profile of u, representing concentrated active Rho-GTPase on the membrane. E) Turing-type models (Eq 4) can generate narrow peaks of different heights, while wave-pinning models (Eq 5) can generate wide mesas of different widths, when total Rho-GTPase content M increases. M = 4, 6, 10 for Turing-type model and M = 30, 40, 50 for wave-pinning model. F) When two peaks of unequal size form in Turing-type models, they compete rapidly and resolve to a single peak, which would lead to unipolar outgrowth (arrow), whereas two mesas of unequal size in Wave-pinning models are meta-stable, which would lead to multi-polar outgrowth (arrow). Parameter values are a = 1μm2, b = 1s−1 and Du = 0.01μm2s−1, Dv = 1μm2s−1 for both models, and k = 1μm2 for wave-pinning model. All models were simulated on domain size L = 10μm.
Fig 2
Fig 2. The basis for competition.
A) Possible outcomes when there are two unequal clusters of Rho-GTPase in the same cell. Scenario 1: competition occurs if larger clusters recruit GTPase more efficiently than smaller clusters. Scenario 2: equalization occurs if smaller clusters recruit GTPase more efficiently than larger clusters. Scenario 3: co-existence occurs if both clusters recruit GTPase equally well. B-F: Turing-type model with Dv → ∞. B) Rate balance plot: activation and inactivation rates are balanced at two fixed points of F(u, v). Filled circle indicates stable fixed point, and empty circle indicates unstable fixed point. C) Net activation (shaded red) and net inactivation (shaded blue) from the trough (umin) to the top (umax) of the peak must be balanced at steady state in 1D. This determines the peak height (umax). D) Net activation at the center of the peak is balanced by diffusion, which drives GTPase towards the flanks, where there is net inactivation. The activation curve and net reaction curves were plotted given v at steady state in B, C, and D. E) If total GTPase content M is raised, the model generates higher peaks (larger umax), accompanied by more severely depleted v, which lowers F(u, v) such that the blue and red shaded areas are once again balanced. F) When two peaks are present, they share the same v and hence the same F(u, v) curve. The larger peak will always have excess net activation, and the smaller peak will always have excess net inactivation, so competition is inevitable. Parameter values used: a = 1μm2, b = 1s−1 and Du = 0.01μm2s−1, Dv = ∞. All models were simulated on domain size L = 10μm.
Fig 3
Fig 3. Wave-pinning models can generate coexisting clusters due to saturation.
A) The wave-pinning model has a saturable activation term, introducing a third fixed point in F(u, v). Dashed line indicates usat. Circles indicate stable (filled) and unstable (empty) fixed points. B) As total GTPase levels M increase, the peaks get higher until umax reaches the saturation point (the third fixed point), after which peaks broaden into mesas. C) With M = 40, two identical peaks were perturbed by 1% at t = 0s. The resulting competition led to a single-peak steady state within 100s. D) With M = 200, the same 1% perturbation did not result in noticeable competition in 10000s. E) Starting from the same two-peak steady state as in D, we introduced a large 50% perturbation. The two mesas quickly evolved back to the original umax, and then persisted for 10000s. k = 0.01μm2. Other parameters same as Fig 2.
Fig 4
Fig 4. Saturation is a major contributor to differences in competition times.
A) Competition time and saturation are tightly correlated. Competition time (s) is shown in color (note log scale). Saturation index is defined here as (usatumax)/usat, and colored in inverse log scale (smaller saturation index indicates peaks are closer to saturation). Basal parameters: a = 1μm2s−1, b = 1s−1, k = 0.01μm2 and Du = 0.01μm2s−1, Dv = ∞, M = 40, L = 20μm. Each color plot represents a 15-fold parameter variation from 0.2× to 3× of the basal parameter value. White regions indicate parts of parameter space where polarized states collapse to homogeneous states. Numbered red dots correspond to the simulations illustrated in the inset of panel B). B) Each of the simulations performed for panel A) is plotted as one dot. Competition time (vertical axis) is plotted against peak height umax normalized to the saturation point usat for that simulation (horizontal axis). Inset graphs indicate starting conditions for the selected simulations with parameters indicated by red dots in A). C) When two mesas coexist, they share the same F(u, v) curve and almost the same umax. Thus, the wider peak has a negligible recruitment advantage over the narrower one.
Fig 5
Fig 5. Local substrate depletion leads to saturation and slow competition.
A) Turing-type model with Dv < ∞ displays a transition between unsaturated peaks and saturated mesas with increased M. B) Local depletion of v in the cytoplasm beneath the peak results in a linear relationship between the concentration profile of v and u. Inset indicates u profile. C) The effect of local depletion transforms the reaction term of the Turing-type model from a quadratic F(u, v) to a cubic F(u, q), yielding a third fixed point. D) The cubic reaction term F(u, q) results in a behavior similar to that of the wave-pinning model: When M is low, q is high, and the peak is sharp; when M increases, depletion of cytoplasmic substrate makes F(u, q) drop, and umax eventually approaches a saturation point. E) Peaks saturated by local depletion are meta-stable. F) Saturation index correlates with competition timescale. Simulations and display as in Fig 4A and 4B. Parameter variations in a vs b and Du vs Dv consist of 30 × 30 simulations each of 0.1× to 3× of the basal parameter values. Parameter variations in M vs L consists of 15x15 simulations of 0.2× to 3× basal parameter values. Basal parameters are as in Fig 4A, except that Dv = 1μm2s−1. Graph shows all simulations plotted as in Fig 4B, with illustrative simulations corresponding to numbered red dots. G) When Dv is finite, the basal cytoplasmic substrate concentration underneath each peak (shown in dashed lines) quickly reaches a quasi-steady state with the recruitment power of the peak. The stronger the recruitment power of the peak, the lower the basal cytoplasmic substrate level. This creates a cytoplasmic gradient when two peaks have different recruitment power, resulting in a cytoplasmic flux towards the larger peak. The gradient becomes negligible when both peaks are saturated, resulting in meta-stable peaks.
Fig 6
Fig 6. Effect of domain size on competition time.
Effect of expanding the domain size on competition time. Gray: overall concentration was held constant as L increases (proportional increase of total protein content in the system M; peaks saturate). Blue: overall protein content constant (peaks shrink to feed the larger cytoplasm). Red: protein content in the peaks is maintained constant (identical peak shape).
Fig 7
Fig 7. Other MCAS models also link competition timescale to saturation.
Competition time increase dramatically with increased total protein content (M) in other MCAS models. Insets: peak shape upon reaching saturation. Red dashed lines indicate saturation point. A) weak positive feedback, F(u, v) = u1.2vu; B) strong positive feedback, F(u, v) = u3vu; C) additional negative feedback F(u, v) = (u2 − 0.01u4)vu; D) Goryachev’s simplified model F(u, v) = (u2 + u)vu [9]; E) Otsuji’s model 1 F(u, v) = a1va1(u + v)/[a2(u + v) + 1]2 with the original parameters described in [11]. In each instance, competition time slows down dramatically as peaks saturate. F) In Otsuji’s model 2 with the original parameters, F(u, v) = a1(u + v)[(Du/Dvu + v)(u + v) − a2] [11], saturation is avoided by allowing negative values of u or v.
Fig 8
Fig 8. Competition in 2D can be driven by differences in peak curvature.
A) In 2D, saturated mesas compete faster than they would in 1D, but slower than unsaturated peaks. B) Left: In the 1D wave-pinning model assuming infinite Dv, the velocity of the traveling wave front is a function of v. Right: In 2D, the velocity is also dependent on the radius of the mesa, because GTPase diffusing across the wavefront becomes diluted in a manner dependent on the curvature of the wavefront. C) When two unequal mesas coexist in 2D, they share the same cytoplasmic v and therefore have the same c0, but because of the the difference in radii, the larger mesa will expand at the expense of the smaller, leading to competition.
Fig 9
Fig 9. Comparison of competition fluxes driven by differences in peak height or peak curvature in 2D.
A) Peaks with 60% and 40% protein content were obtained from simulations of the wave-pinning model (Eq 5) using different values of the parameter k. Inset: normalized to umax. Parameter values: L = 10 μm; a = b = 1 s−1; Du = 0.01 μm2s−1; k as labeled by color. B) Simulating competition between the peaks illustrated in A), the net protein transfer (gray line) tracks closely with the differences in peak height when peaks are not saturated (green line, normalized to the flux at k = 10−10). As peaks approach saturation (region expanded in the inset), competition fluxes no longer track with the difference in peak height, and instead approach the fluxes predicted by curvature-driven competition (red line, see Supporting Information section 7). Fluxes driven by differences in peak height are much larger than those driven by differences in peak curvature. C) The Turing-type model Eq 4 was simulated in 2D with finite cytoplasmic diffusion yielding emergent saturation. As in 1D, unsaturated peaks generate a steeper cytoplasmic GTPase gradient than saturated mesas, yielding much faster competition.

Similar articles

Cited by

References

    1. Caceres A, Ye B, Dotti CG. Neuronal polarity: demarcation, growth and commitment. Curr Opin Cell Biol. 2012;24(4):547–53. doi: 10.1016/j.ceb.2012.05.011 - DOI - PMC - PubMed
    1. Etienne-Manneville S, Hall A. Rho GTPases in cell biology. Nature. 2002;420(6916):629–35. doi: 10.1038/nature01148 - DOI - PubMed
    1. Yang Z. Cell polarity signaling in Arabidopsis. Annu Rev Cell Dev Biol. 2008;24:551–75. doi: 10.1146/annurev.cellbio.23.090506.123233 - DOI - PMC - PubMed
    1. Dotti CG, Sullivan CA, Banker GA. The establishment of polarity by hippocampal neurons in culture. J Neurosci. 1988;8(4):1454–68. doi: 10.1523/JNEUROSCI.08-04-01454.1988 - DOI - PMC - PubMed
    1. Wu CF, Lew DJ. Beyond symmetry-breaking: competition and negative feedback in GTPase regulation. Trends Cell Biol. 2013;23(10):476–83. doi: 10.1016/j.tcb.2013.05.003 - DOI - PMC - PubMed

Publication types

MeSH terms

Substances

LinkOut - more resources