. 2018 Apr 12;14(4):e1007282.
doi: 10.1371/journal.pgen.1007282. eCollection 2018 Apr.

New insights into the transposition mechanisms of IS6110 and its dynamic distribution between Mycobacterium tuberculosis Complex lineages

Affiliations

New insights into the transposition mechanisms of IS6110 and its dynamic distribution between Mycobacterium tuberculosis Complex lineages

Jesús Gonzalo-Asensio et al. PLoS Genet. .

Abstract

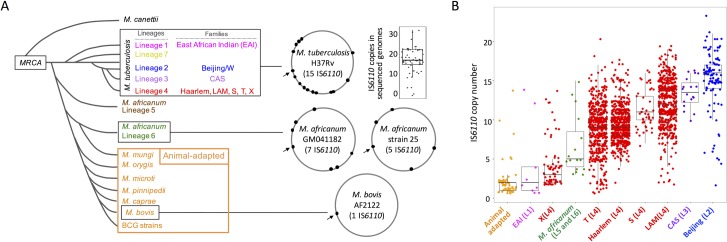
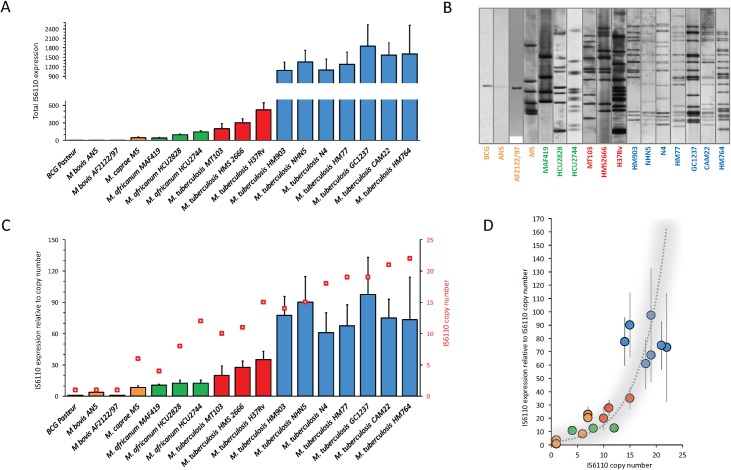
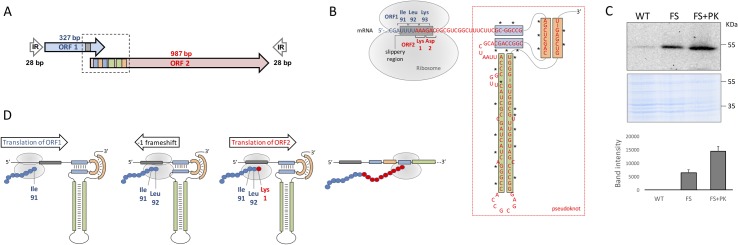
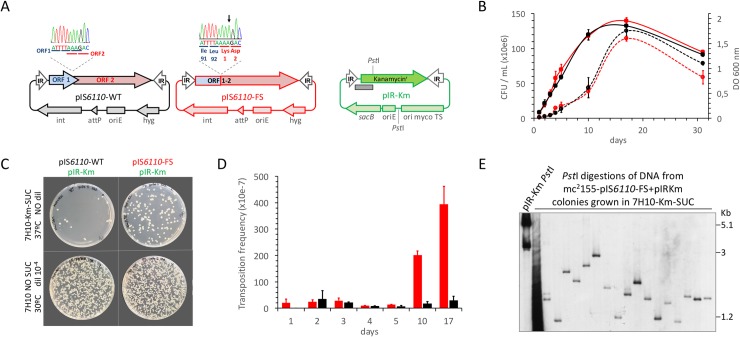
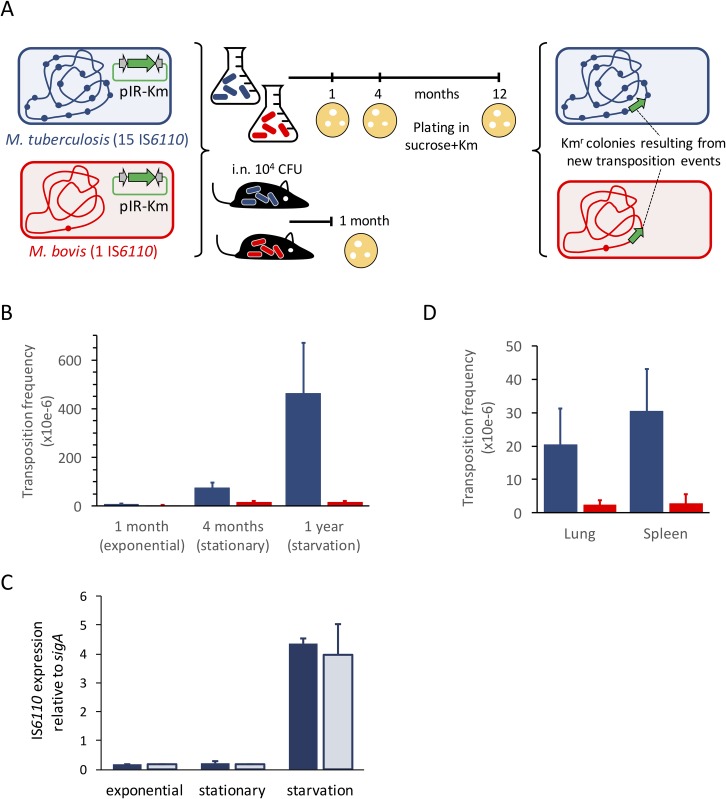
The insertion Sequence IS6110, only present in the pathogens of the Mycobacterium tuberculosis Complex (MTBC), has been the gold-standard epidemiological marker for TB for more than 25 years, but biological implications of IS6110 transposition during MTBC adaptation to humans remain elusive. By studying 2,236 clinical isolates typed by IS6110-RFLP and covering the MTBC, we remarked a lineage-specific content of IS6110 being higher in modern globally distributed strains. Once observed the IS6110 distribution in the MTBC, we selected representative isolates and found a correlation between the normalized expression of IS6110 and its abundance in MTBC chromosomes. We also studied the molecular regulation of IS6110 transposition and we found a synergistic action of two post-transcriptional mechanisms: a -1 ribosomal frameshift and a RNA pseudoknot which interferes translation. The construction of a transcriptionally active transposase resulted in 20-fold increase of the transposition frequency. Finally, we examined transposition in M. bovis and M. tuberculosis during laboratory starvation and in a mouse infection model of TB. Our results shown a higher transposition in M. tuberculosis, that preferably happens during TB infection in mice and after one year of laboratory culture, suggesting that IS6110 transposition is dynamically adapted to the host and to adverse growth conditions.


Conflict of interest statement

The authors have declared that no competing interests exist.

Figures

Fig 1
Fig 1. IS6110 in the MTBC.
(a) Schematic phylogenetic relationships of MTBC members arisen from a most recent common ancestor (MRCA) after an evolutionary bottleneck. For M. tuberculosis different lineages and families are indicated. The position of IS6110 sequences in fully assembled genomes in indicated by black dots. The arrow indicates the position of IS6110 in the Direct Repeat region of the CRISPR-Cas locus, which is common to most MTBC strains. For the remaining 17 M. tuberculosis strains different from H37Rv, the number of IS6110 sequences is indicated by a box plot (median = 17). (b) Box plots showing the IS6110 copies in MTBC families. For each family, the lineage according to panel (a) is provided in parenthesis in the X-axis. For clarity, L4 have been subdivided into 5 different families according to spoligotyping.
Fig 2
Fig 2. IS6110 gene expression and determination of transposition dynamics in the MTBC.
(a) Total IS6110 expression in representative strains from the MTBC. Data are relative to BCG Pasteur. Columns and error bars are the average and standard deviation from three independent cultures. (b) IS6110 RFLP from MTBC strains analysed in panel (a). (c) IS6110 expression values normalised to the copy number content of this element. Columns represent normalised expression of IS6110 according to the left Y-axis. Red squares show the IS6110 copy number in each strain indicated in the right Y-axis. Normalised expression of BCG Pasteur is used as reference. (d) Expression per IS6110 copy relative to the copy number content in MTBC strains. Data fit with an exponential curve (r2 = 0.80) indicated by a grey shadowed line.
Fig 3
Fig 3. Post-transcriptional regulatory mechanisms of IS6110 translation.
(a) Genetic organization of IS6110. Overlapping ORF1 and ORF2 and the sense of transcription are indicated as blue and red arrows respectively. The scheme also shows the 28bp inverted repeats (IR) flanking both overlapping ORFs. (b) Mechanisms of post-transcriptional regulation of IS6110. The image shows an enlarged view of the region indicated with a dotted box from panel (a). The UUUUAAAG slippery sequence is indicated by a grey box. ORF1 and ORF2 as well as their coding triplets are indicated by blue and red letters according to panel (a). The RNA pseudoknot is included within a red rectangle and those regions involved in base pairing formation of secondary structures are indicated by blue, green and orange boxes. The position of the ribosome and the translated codons are also indicated. Asterisks in the pseudoknot indicate positions carrying mutations that disrupt this structure. (c) Expression of 3xFLAG variants of IS6110-WT, the transcriptionally active transposase IS6110-FS and the latter variant carrying mutations to disrupt pseudoknot formation IS6110-FS+PK. The upper and lower parts of the panel show a western-blot using and anti-FLAG antibody and a Coomassie staining which serves as loading control respectively. The right side of the panel shows the band intensity average from three independent experiments. (d) Post-transcriptional regulation of IS6110 to produce a biologically active transposase. The image shows translation steps indicating the sense of ribosomal advance and the mRNA structure indicated in panel (b). Translation of the ORF1 produces the aminoacids from the N-terminus of IS6110 (blue spheres) until it translates Ile91 and Leu92 coded by AUU and UUA triplets in the slippery region (grey box). At this position ribosome stalls probably because the presence of the downstream pseudoknot presenting a tight secondary structure. Stalling favours a -1 frameshift in the slippery region. Translation continues in the AAA codon coding for the Lys1 position of ORF2 (red sphere) until the ribosome reaches the C-terminus of IS6110 coded in this latter ORF.
Fig 4
Fig 4. Construction of a transcriptionally active IS6110 and measure of transposition frequencies during laboratory growth.
(a) Plasmids used in the transposition reporter system. pIS6110-WT and pIS6110-FS are mycobacterial integrative plasmids carrying either the wild type IS6110 or a mutated variant producing a transcriptionally active transposase respectively. The upper side of this panel shows Sanger sequencing histograms indicating the position of the A insertion in pIS6110-FS. pIR-Km is a conditionally replicating plasmid with thermosensitive origin of replication and the sacB gene conferring sucrose sensitivity. This plasmid contains a Kanamycin resistance cassette (km) flanked by the IR regions of IS6110. Positions of PstI sites and probe (grey rectangle) used in RFLP shown in panel (e) are indicated. (b) Growth rates of liquid cultures at 30°C of M. smegmatis transformed with either pIS6110-WT+pIR-Km (black lines) or pIS6110-FS+pIR-Km (red lines). Growth curves measured by OD600 and enumeration of CFU/mL are represented by continuous or dotted lines respectively. Error bars represent the standard deviation from three independent cultures. (c) CFU from M. smegmatis cotransformed with pIS6110-WT+pIR-Km or pIS6110-FS+pIR-Km and plated on 7H10 media supplemented with or without kanamycin and sucrose. Dilution used and incubation temperature are indicated. Note the increase in the number of CFU grown in kanamycin and sucrose medium for the pIS6110-FS variant relative to the pIS6110-WT. (d) Determination of transposition frequencies in M. smegmatis cotransformed with pIS6110-WT+pIR-Km (black columns) or pIS6110-FS+pIR-Km (red columns). Error bars indicate the standard deviation from three independent experiments. Note that the transcriptionally active transposase in pIS6110-FS increases up to 20-fold its transposition frequency relative to the wild type transposase in exponential and stationary periods. (e) RFLP analysis of DNA from colonies grown in kanamycin and sucrose plates resulting from transposition events. Note the loss of signal for pIR-Km indicative of the appropriate plasmid loss and the concomitant presence of an aleatory band pattern indicative of randomised transposition in the M. smegmatis chromosome.
Fig 5
Fig 5. Transposition in the laboratory and in a mouse infection model using reference M. bovis and M. tuberculosis strains.
(a) Experimental model to measure transposition rates in M. tuberculosis H37Rv (15 IS6110 copies) and M. bovis AF2122/97 (1 IS6110 copy). Both strains are transformed with pIR-Km and used to inoculate liquid media or to intranasally infect C57BL/6 mice. After the indicated time points aliquots are plated in kanamycin and sucrose containing plates to ensure pIR-km loss and to recover colonies resulting from transposition. (b) Transposition frequencies in laboratory medium in M. bovis and M. tuberculosis are indicated by red and blue columns respectively. Error bars indicate the standard deviation of the mean value from three independent cultures. Transposition preferentially occurs in M. tuberculosis after the stationary phase reaching it maximum in the starvation period. (c) Expression of M. tuberculosis IS6110 during exponential, stationary and starvation periods in vitro. Expression of ORF1 and ORF2 are indicated by dark and light blue columns respectively. Results are from three independent cultures. (d) Transposition frequencies during mouse infection with M. bovis or M. tuberculosis are indicated by red and blue columns respectively. Data from lung and spleen are shown and error bars indicate the standard deviation of the mean value from three independent mice. M. bovis does not exhibit increased transposition rates in vivo relative to liquid culture. Conversely M. tuberculosis show 10-fold higher transposition rates compared to exponential growth in vitro. In all cases, transposition frequencies were calculated relative to the total number of CFU in either cultures or mouse organs.

Similar articles

Cited by

References

    1. Paulson T. Epidemiology: A mortal foe. Nature. 2013;502(7470):S2–3. doi: 10.1038/502S2a . - DOI - PubMed
    1. WHO. Global Tuberculosis Report 2017. 2017.
    1. Gonzalo-Asensio J, Aguilo N, Marinova D, Martin C. Breaking Transmission with Vaccines: The Case of Tuberculosis. Microbiol Spectr. 2017;5(4). doi: 10.1128/microbiolspec.MTBP-0001-2016 . - DOI - PMC - PubMed
    1. Mc CB. The origin and behavior of mutable loci in maize. Proc Natl Acad Sci U S A. 1950;36(6):344–55. ; PubMed Central PMCID: PMCPMC1063197. - PMC - PubMed
    1. Hedges RW, Jacob AE. Transposition of ampicillin resistance from RP4 to other replicons. Mol Gen Genet. 1974;132(1):31–40. . - PubMed

Publication types

Substances

LinkOut - more resources