

Seasonal asthma in Melbourne, Australia, and some observations on the occurrence of thunderstorm asthma and its predictability
- PMID: 29649224
- PMCID: PMC5896915
- DOI: 10.1371/journal.pone.0194929
Seasonal asthma in Melbourne, Australia, and some observations on the occurrence of thunderstorm asthma and its predictability
Abstract
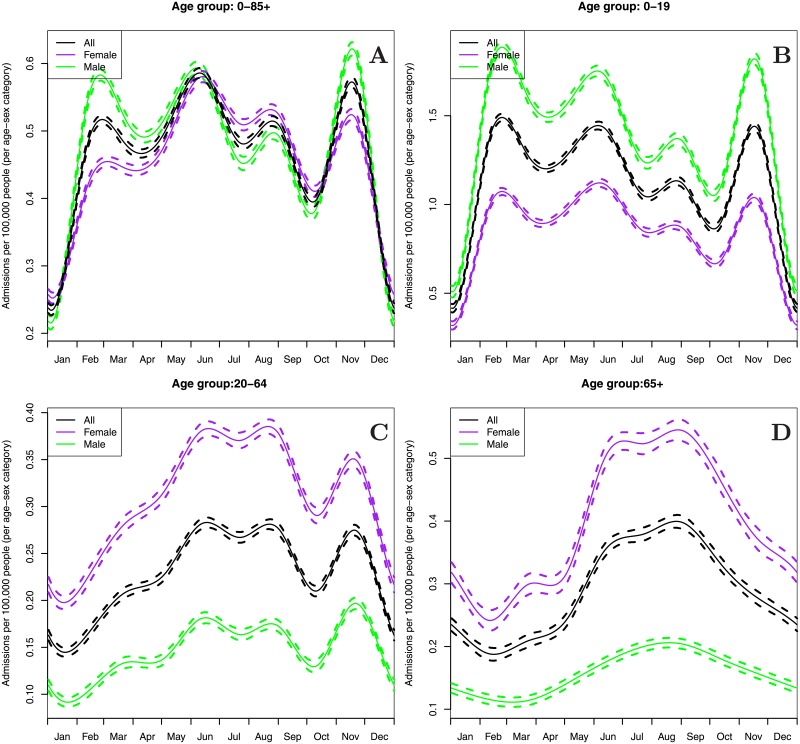
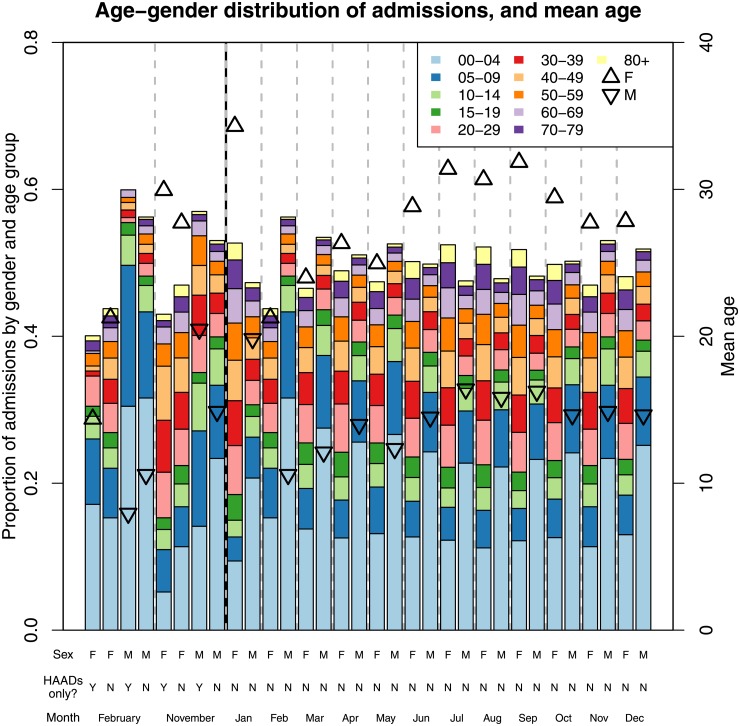
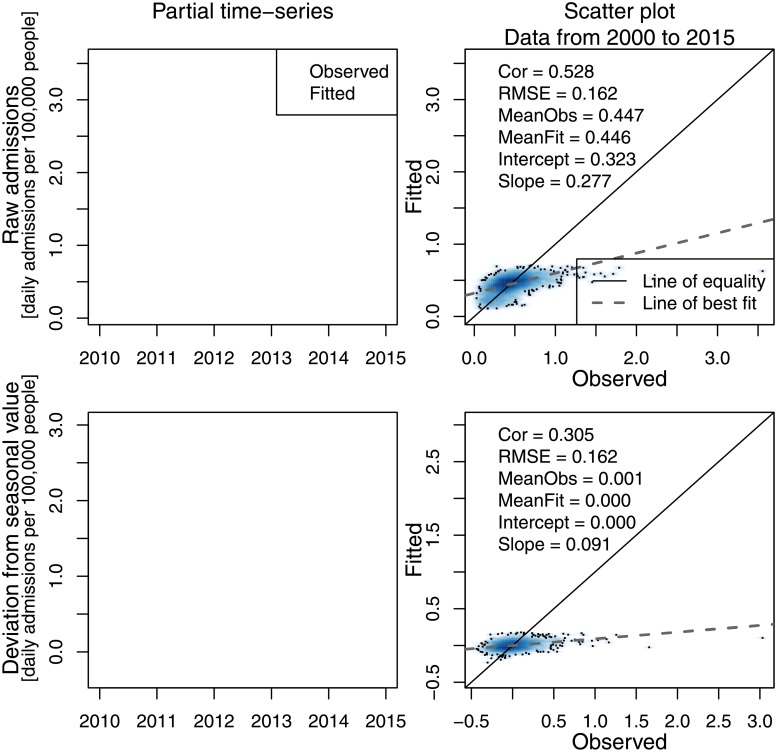
We examine the seasonality of asthma-related hospital admissions in Melbourne, Australia, in particular the contribution and predictability of episodic thunderstorm asthma. Using a time-series ecological approach based on asthma admissions to Melbourne metropolitan hospitals, we identified seasonal peaks in asthma admissions that were centred in late February, June and mid-November. These peaks were most likely due to the return to school, winter viral infections and seasonal allergies, respectively. We performed non-linear statistical regression to predict daily admission rates as functions of the seasonal cycle, weather conditions, reported thunderstorms, pollen counts and air quality. Important predictor variables were the seasonal cycle and mean relative humidity in the preceding two weeks, with higher humidity associated with higher asthma admissions. Although various attempts were made to model asthma admissions, none of the models explained substantially more variation above that associated with the annual cycle. We also identified a list of high asthma admissions days (HAADs). Most HAADs fell in the late-February return-to-school peak and the November allergy peak, with the latter containing the greatest number of daily admissions. Many HAADs in the spring allergy peak may represent episodes of thunderstorm asthma, as they were associated with rainfall, thunderstorms, high ambient grass pollen levels and high humidity, a finding that suggests thunderstorm asthma is a recurrent phenomenon in Melbourne that occurs roughly once per five years. The rarity of thunderstorm asthma events makes prediction challenging, underscoring the importance of maintaining high standards of asthma management, both for patients and health professionals, especially during late spring and early summer.
Conflict of interest statement
Figures
Similar articles
-
Who's at risk of thunderstorm asthma? The ryegrass pollen trifecta and lessons learnt from the Melbourne thunderstorm epidemic.Respir Med. 2017 Nov;132:146-148. doi: 10.1016/j.rmed.2017.10.012. Epub 2017 Oct 18. Respir Med. 2017. PMID: 29229087
-
The effects of air pollution on asthma hospital admissions in Adelaide, South Australia, 2003-2013: time-series and case-crossover analyses.Clin Exp Allergy. 2016 Nov;46(11):1416-1430. doi: 10.1111/cea.12795. Epub 2016 Sep 20. Clin Exp Allergy. 2016. PMID: 27513706
-
Do levels of airborne grass pollen influence asthma hospital admissions?Clin Exp Allergy. 2007 Nov;37(11):1641-7. doi: 10.1111/j.1365-2222.2007.02818.x. Epub 2007 Sep 17. Clin Exp Allergy. 2007. PMID: 17877763
-
Thunderstorm-asthma and pollen allergy.Allergy. 2007 Jan;62(1):11-6. doi: 10.1111/j.1398-9995.2006.01271.x. Allergy. 2007. PMID: 17156336 Review.
-
Thunderstorm-related asthma: what happens and why.Clin Exp Allergy. 2016 Mar;46(3):390-6. doi: 10.1111/cea.12709. Clin Exp Allergy. 2016. PMID: 26765082 Review.
Cited by
-
The perfect storm: temporal analysis of air during the world's most deadly epidemic thunderstorm asthma (ETSA) event in Melbourne.Ther Adv Respir Dis. 2023 Jan-Dec;17:17534666231186726. doi: 10.1177/17534666231186726. Ther Adv Respir Dis. 2023. PMID: 37646293 Free PMC article.
-
Combined Exposure to Birch Pollen and Thunderstorms Affects Respiratory Health in Stockholm, Sweden-A Time Series Analysis.Int J Environ Res Public Health. 2022 May 11;19(10):5852. doi: 10.3390/ijerph19105852. Int J Environ Res Public Health. 2022. PMID: 35627390 Free PMC article.
-
Atmospheric modelling of grass pollen rupturing mechanisms for thunderstorm asthma prediction.PLoS One. 2021 Apr 14;16(4):e0249488. doi: 10.1371/journal.pone.0249488. eCollection 2021. PLoS One. 2021. PMID: 33852572 Free PMC article.
-
Importance of allergen-environment interactions in epidemic thunderstorm asthma.Ther Adv Respir Dis. 2022 Jan-Dec;16:17534666221099733. doi: 10.1177/17534666221099733. Ther Adv Respir Dis. 2022. PMID: 35603956 Free PMC article.
-
Community Response to the Impact of Thunderstorm Asthma Using Smart Technology.Allergy Rhinol (Providence). 2021 Apr 26;12:21526567211010728. doi: 10.1177/21526567211010728. eCollection 2021 Jan-Dec. Allergy Rhinol (Providence). 2021. PMID: 33996193 Free PMC article.
References
-
- Silverman R, Stevenson L, Hastings H. Age-related seasonal patterns of emergency department visits for acute asthma in an urban environment. Ann Emerg Med. 2003;42(4):577–586. doi: 10.1067/S0196-0644(03)00410-4 - DOI - PubMed
-
- Chen C, Xirasagar S, Lin H. Seasonality in adult asthma admissions, air pollutant levels, and climate: a population-based study. J Asthma. 2006;43:287–292. doi: 10.1080/02770900600622935 - DOI - PubMed
-
- Zhang Y, Peng L, Kan H, Xu J, Chen R, Liu Y, et al. Effects of meteorological factors on daily hospital admissions for asthma in adults: a time-series analysis. PloS ONE. 2014;9(7):e102475 doi: 10.1371/journal.pone.0102475 - DOI - PMC - PubMed
-
- Qiu H, Yu I, Tse L, Chan E, Wong T, Tian L. Greater temperature variation within a day associated with increased emergency hospital admissions for asthma. Sci Tot Environ. 2015;505:508–513. doi: 10.1016/j.scitotenv.2014.10.003 - DOI - PubMed
-
- Eggo R, Scott J, Galvani A, Meyers L. Respiratory virus transmission dynamics determine timing of asthma exacerbation peaks: Evidence from a population-level model. Proc Natl Acad Sci U S A. 2016;113:2194–2199. doi: 10.1073/pnas.1518677113 - DOI - PMC - PubMed
Publication types
MeSH terms
Substances
LinkOut - more resources
Full Text Sources
Other Literature Sources
Medical
