

Identifying tumor in pancreatic neuroendocrine neoplasms from Ki67 images using transfer learning
- PMID: 29649302
- PMCID: PMC5896941
- DOI: 10.1371/journal.pone.0195621
Identifying tumor in pancreatic neuroendocrine neoplasms from Ki67 images using transfer learning
Abstract
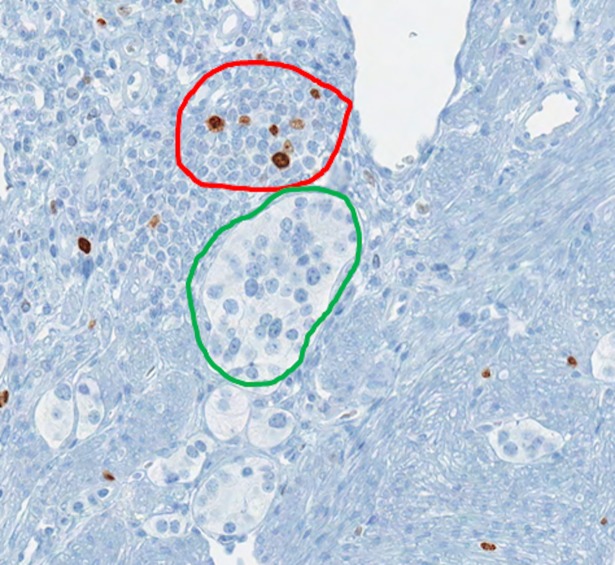
The World Health Organization (WHO) has clear guidelines regarding the use of Ki67 index in defining the proliferative rate and assigning grade for pancreatic neuroendocrine tumor (NET). WHO mandates the quantification of Ki67 index by counting at least 500 positive tumor cells in a hotspot. Unfortunately, Ki67 antibody may stain both tumor and non-tumor cells as positive depending on the phase of the cell cycle. Likewise, the counter stain labels both tumor and non-tumor as negative. This non-specific nature of Ki67 stain and counter stain therefore hinders the exact quantification of Ki67 index. To address this problem, we present a deep learning method to automatically differentiate between NET and non-tumor regions based on images of Ki67 stained biopsies. Transfer learning was employed to recognize and apply relevant knowledge from previous learning experiences to differentiate between tumor and non-tumor regions. Transfer learning exploits a rich set of features previously used to successfully categorize non-pathology data into 1,000 classes. The method was trained and validated on a set of whole-slide images including 33 NETs subject to Ki67 immunohistochemical staining using a leave-one-out cross-validation. When applied to 30 high power fields (HPF) and assessed against a gold standard (evaluation by two expert pathologists), the method resulted in a high sensitivity of 97.8% and specificity of 88.8%. The deep learning method developed has the potential to reduce pathologists' workload by directly identifying tumor boundaries on images of Ki67 stained slides. Moreover, it has the potential to replace sophisticated and expensive imaging methods which are recently developed for identification of tumor boundaries in images of Ki67-stained NETs.
Conflict of interest statement
Figures


References
-
- Halfdanarson TR, Rabe K, Rubin J, Petersen GM. Pancreatic neuroendocrine tumors (PNETs): incidence, prognosis and recent trend toward improved survival. Annals of Oncology. 2008;19(10):1727–33. doi: 10.1093/annonc/mdn351 - DOI - PMC - PubMed
-
- Alsidawi S, Westin GFM, Hobday TJ, Halfdanarson TR. Pancreatic neuroendocrine tumors: A population-based analysis of epidemiology and outcomes. American Society of Clinical Oncology; 2017.
-
- Klöppel G. Tumour biology and histopathology of neuroendocrine tumours. Best practice & research Clinical endocrinology & metabolism. 2007;21(1):15–31. - PubMed
-
- Bosman FT, Carneiro F, Hruban RH, Theise ND. WHO classification of tumours of the digestive system: World Health Organization; 2010.
-
- Niazi MKK, Hartman DJ, Pantanowitz L, Gurcan MN, editors. Hotspot detection in pancreatic neuroendocrine tumors: Density approximation by α-shape maps SPIE Medical Imaging; 2016 2016: International Society for Optics and Photonics.
Publication types
MeSH terms
Substances
Grants and funding
LinkOut - more resources
Full Text Sources
Other Literature Sources
Medical
