

Single camera multi-view anthropometric measurement of human height and mid-upper arm circumference using linear regression
- PMID: 29649306
- PMCID: PMC5896949
- DOI: 10.1371/journal.pone.0195600
Single camera multi-view anthropometric measurement of human height and mid-upper arm circumference using linear regression
Abstract
Background: Manually measured anthropometric quantities are used in many applications including human malnutrition assessment. Training is required to collect anthropometric measurements manually, which is not ideal in resource-constrained environments. Photogrammetric methods have been gaining attention in recent years, due to the availability and affordability of digital cameras.
Objective: The primary goal is to demonstrate that height and mid-upper arm circumference (MUAC)-indicators of malnutrition-can be accurately estimated by applying linear regression to distance measurements from photographs of participants taken from five views, and determine the optimal view combinations. A secondary goal is to observe the effect on estimate error of two approaches which reduce complexity of the setup, computational requirements and the expertise required of the observer.
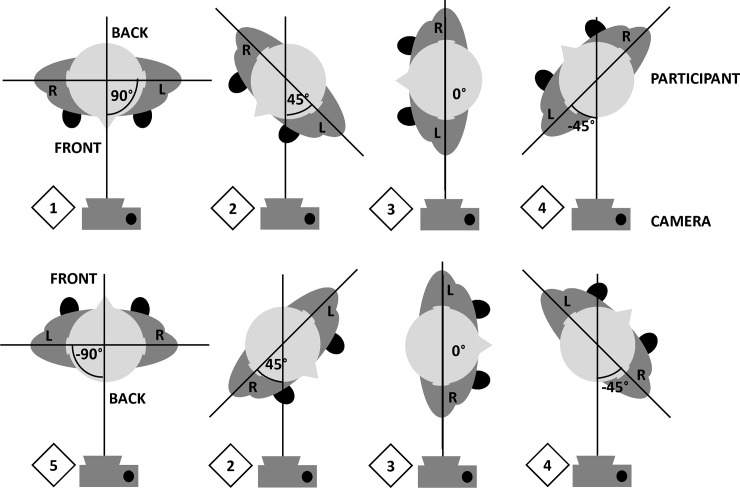
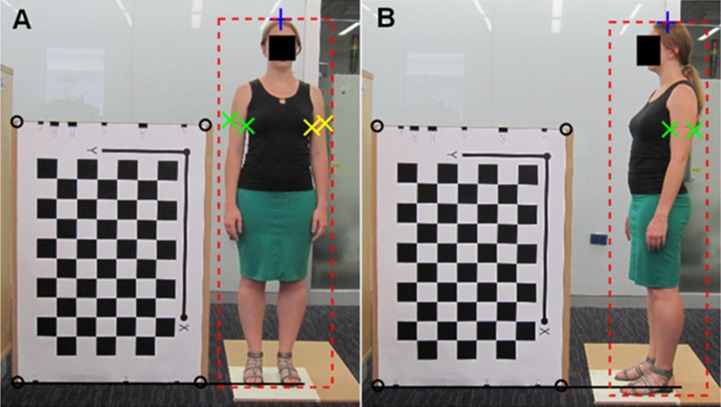
Methods: Thirty-one participants (11 female, 20 male; 18-37 years) were photographed from five views. Distances were computed using both camera calibration and reference object techniques from manually annotated photos. To estimate height, linear regression was applied to the distances between the top of the participants head and the floor, as well as the height of a bounding box enclosing the participant's silhouette which eliminates the need to identify the floor. To estimate MUAC, linear regression was applied to the mid-upper arm width. Estimates were computed for all view combinations and performance was compared to other photogrammetric methods from the literature-linear distance method for height, and shape models for MUAC.
Results: The mean absolute difference (MAD) between the linear regression estimates and manual measurements were smaller compared to other methods. For the optimal view combinations (smallest MAD), the technical error of measurement and coefficient of reliability also indicate the linear regression methods are more reliable. The optimal view combination was the front and side views. When estimating height by linear regression of the distance from the head to the floor, the mean MAD was 10.51 mm ± 6.52 mm SD, and when estimating height from the bounding box using the reference object, the mean MAD per participant was 11.53 mm ± 6.43 mm SD. When estimating MUAC from the mid-upper arm radius using the reference object, the mean MAD was 7.24 mm ± 4.79 mm SD. The mean MAD for all methods when using camera calibration was 2-3 mm smaller.
Conclusions: Applying linear regression to distance measurements from photos of adults taken from multiple view angles has been shown to accurately estimate height and MUAC to within the accuracy required for nutrition assessment. Future work will focus on automating the landmark detection, and validating the methods on populations that include undernourished adults and children of all nutrition statuses. These future works will improve the practicality of this method as a potential tool for nutrition assessment by novice users.
Conflict of interest statement
Figures
Similar articles
-
Mid-Upper-Arm Circumference and Arm-to-Height Ratio to Identify Obesity in School-Age Children.Clin Med Res. 2017 Dec;15(3-4):53-58. doi: 10.3121/cmr.2017.1365. Epub 2017 Oct 10. Clin Med Res. 2017. PMID: 29018004 Free PMC article.
-
Weight estimation for children aged 6 to 59 months in limited-resource settings: A proposal for a tape using height and mid-upper arm circumference.PLoS One. 2018 Jun 7;13(6):e0197769. doi: 10.1371/journal.pone.0197769. eCollection 2018. PLoS One. 2018. PMID: 29879127 Free PMC article.
-
The development of a MUAC-for-height reference, including a comparison to other nutritional status screening indicators.Bull World Health Organ. 1997;75(4):333-41. Bull World Health Organ. 1997. PMID: 9342892 Free PMC article.
-
Mid-upper arm circumference (MUAC) measurement usage among children with disabilities: A systematic review.Nutr Health. 2023 Jun 20:2601060231181607. doi: 10.1177/02601060231181607. Online ahead of print. Nutr Health. 2023. PMID: 37338528 Review.
-
[The development of reference values for the brachial perimeter and body height in comparison with other indicators used for screening of the nutritional status].Rev Panam Salud Publica. 1998 Sep;4(3):187-95. doi: 10.1590/s1020-49891998000900006. Rev Panam Salud Publica. 1998. PMID: 9796391 Review. Spanish.
Cited by
-
Inferring Body Measurements from 2D Images: A Comprehensive Review.J Imaging. 2025 Jun 19;11(6):205. doi: 10.3390/jimaging11060205. J Imaging. 2025. PMID: 40558804 Free PMC article. Review.
-
Exploring the Use of a Length AI Algorithm to Estimate Children's Length from Smartphone Images in a Real-World Setting: Algorithm Development and Usability Study.JMIR Pediatr Parent. 2024 Nov 22;7:e59564. doi: 10.2196/59564. JMIR Pediatr Parent. 2024. PMID: 39576977 Free PMC article.
References
-
- Liu H, Li Z, Zheng L (2008) Rapid preliminary helmet shell design based on three-dimensional anthropometric head data. Journal of Engineering Design 19: 45–54.
-
- Meunier P, Yin S (2000) Performance of a 2D image-based anthropometric measurement and clothing sizing system. Applied Ergonomics 31: 445–451. - PubMed
-
- de Onis M, Onyango AW, Van den Broeck J, Chumlea CW, Martorell R (2004) Measurement and standardization protocols for anthropometry used in the construction of a new international growth reference. Food and Nutrition Bulletin 25: S27–S36. doi: 10.1177/15648265040251S104 - DOI - PubMed
-
- Gurney JM, Jelliffe DB (1973) Arm anthropometry in nutritional assessment: nomogram for rapid calculation of muscle circumference and cross-sectional muscle and fat areas. The American Journal of Clinical Nutrition 26: 912–915. doi: 10.1093/ajcn/26.9.912 - DOI - PubMed
-
- Chagomoka T, Drescher A, Glaser R, Marschner B, Schlesinger J, Nyandoro G (2016) Women's dietary diversity scores and childhood anthropometric measurements as indices of nutrition insecurity along the urban–rural continuum in Ouagadougou, Burkina Faso. Food & Nutrition Research 60: 29425. - PMC - PubMed
Publication types
MeSH terms
LinkOut - more resources
Full Text Sources
Other Literature Sources
