. 2018 Jun:16:401-413.
doi: 10.1016/j.redox.2018.04.001. Epub 2018 Apr 3.

Defective protein repair under methionine sulfoxide A deletion drives autophagy and ARE-dependent gene transcription

Affiliations

Defective protein repair under methionine sulfoxide A deletion drives autophagy and ARE-dependent gene transcription

Steven M Pennington et al. Redox Biol. 2018 Jun.

Abstract

Objective: Reduction of oxidized methionines is emerging as a major protein repair pathway. The lack of methionine sulfoxide reductase A (MsrA) exacerbates cardiovascular disease phenotypes driven by increased oxidative stress. However, the role of MsrA on maintaining cellular homeostasis in the absence of excessive oxidative stress is less well understood.

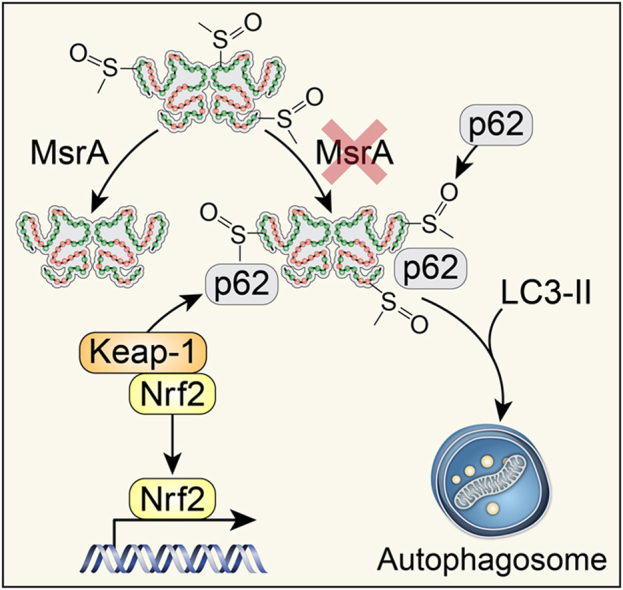
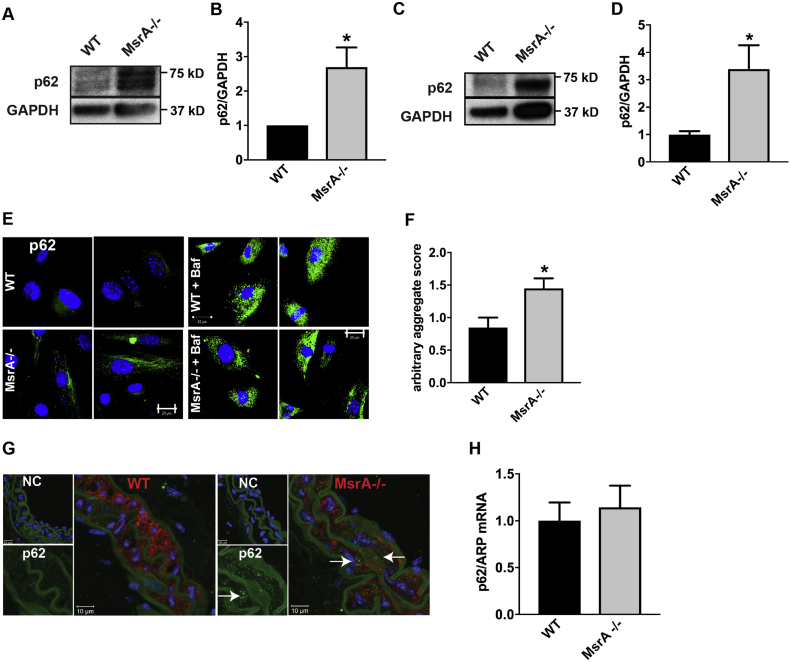
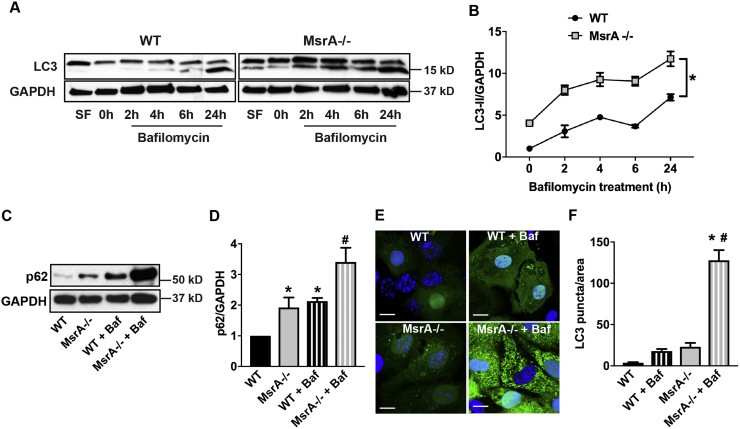
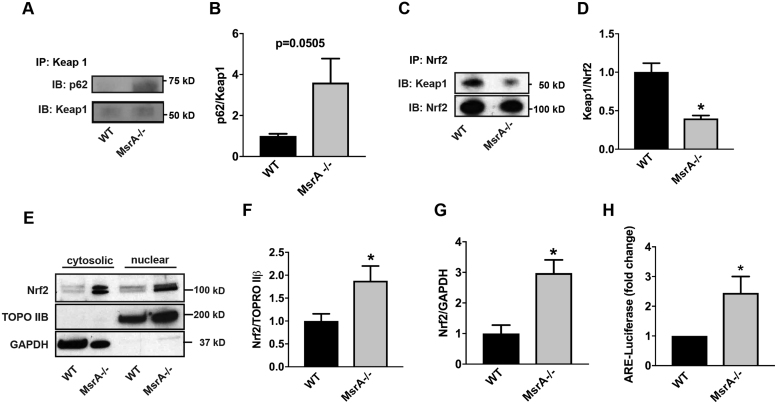
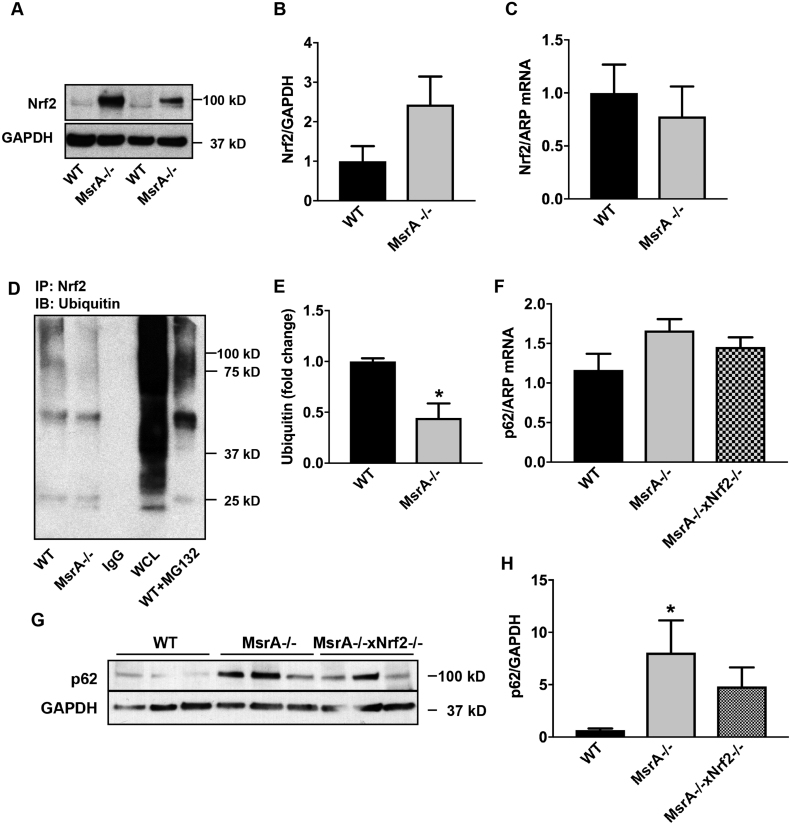
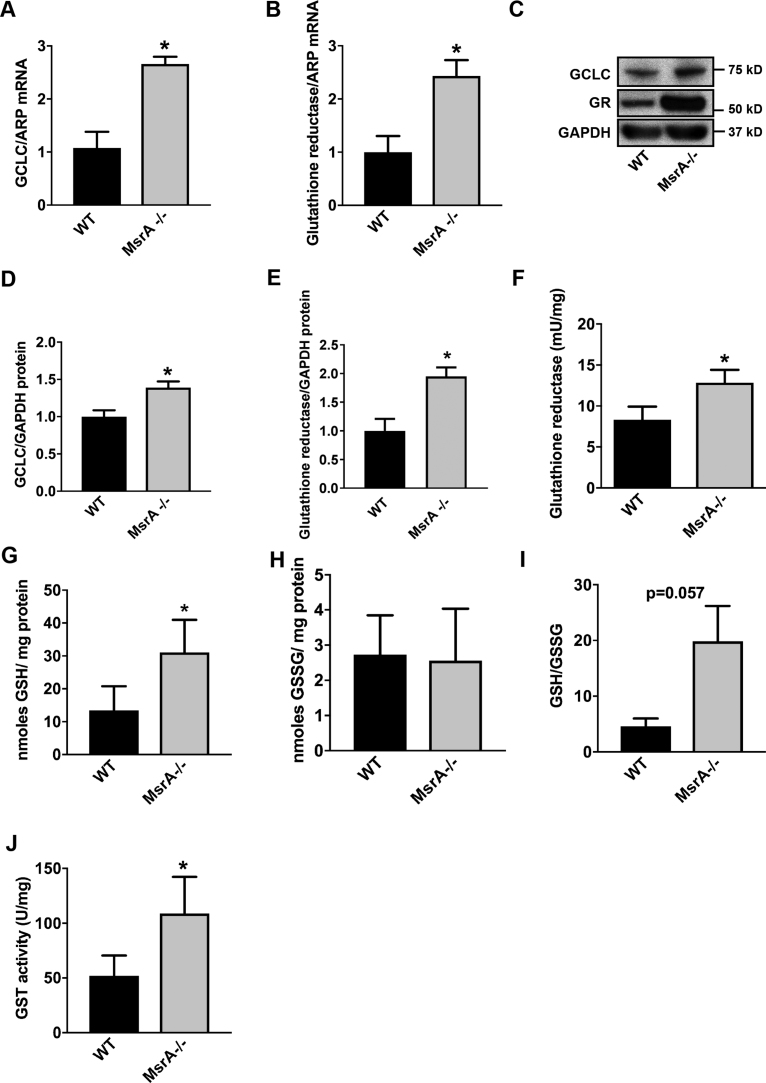
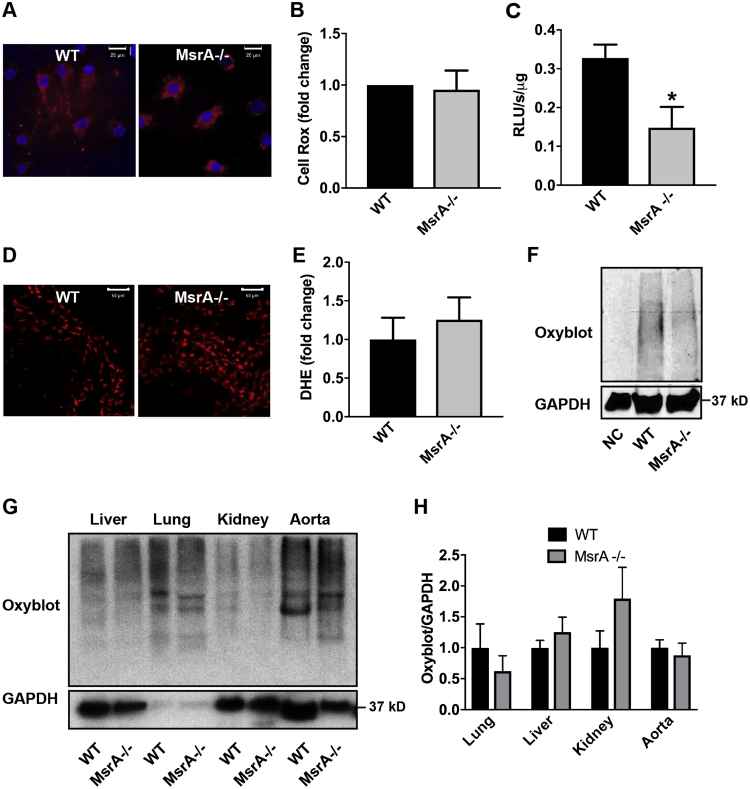
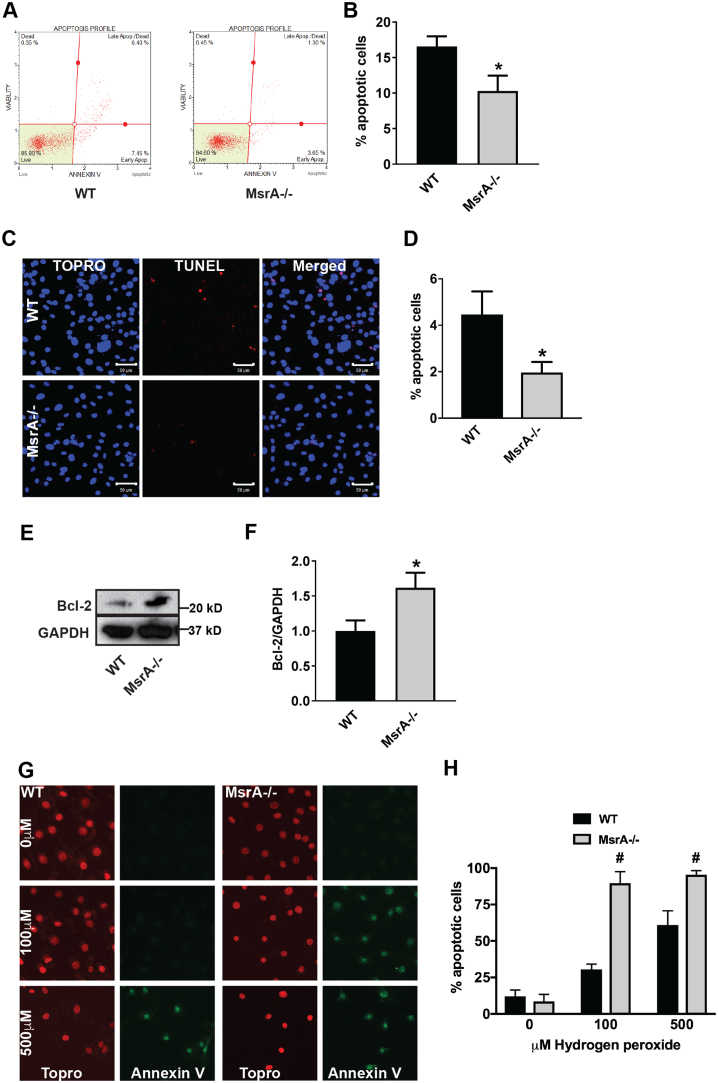
Methods and results: Constitutive genetic deletion of MsrA increased formation of p62-containing protein aggregates, activated autophagy, and decreased a marker of apoptosis in vascular smooth muscle cells (VSMC). The association of Keap1 with p62 was augmented in MsrA-/- VSMC. Keap1 targets the transcription factor Nrf2, which regulates antioxidant genes, for proteasomal degradation. However, in MsrA-/- VSMC, the association of Nrf2 with Keap1 was diminished. Whereas Nrf2 mRNA levels were not decreased in MsrA-/- VSMC, we detected decreased ubiquitination of Nrf2 and a corresponding increase in total Nrf2 protein in the absence of biochemical markers of oxidative stress. Moreover, nuclear-localized Nrf2 was increased under MsrA deficiency, resulting in upregulation of Nrf2-dependent transcriptional activity. Consequently, transcription, protein levels and enzymatic activity of glutamate-cysteine ligase and glutathione reductase were greatly augmented in MsrA-/- VSMC.

Summary: Our findings demonstrate that reversal of methionine oxidation is required for maintenance of cellular homeostasis in the absence of increased oxidative stress. These data provide the first link between autophagy and activation of Nrf2 in the setting of MsrA deletion.

Keywords: Autophagy; Methionine; Methionine sulfoxide reductase; Nrf2; Smooth muscle; Ubiquitination.


Figures

fx1
Graphical abstract
Fig. 1
Fig. 1
p62 is elevated in MsrA-deficient VSMC and arteries. (A, B) Representative immunoblot (A) and summary data (B) for p62 in whole cell lysates of VSMC isolated from MsrA-/- and WT mice. Data were normalized to GAPDH loading control and expressed relative to p62 levels in WT VSMC (n = 9 biological replicates). (C, D) Representative immunoblot (C) and summary data (D) for p62 in whole cell lysates of carotid arteries isolated from MsrA-/- and WT mice (n = 10 biological replicates). E) Representative immunofluorescent images of p62 (green) and nuclei (TOPRO, blue) in VSMC from MsrA-/- and WT mice with or without treatment with bafilomycin a1 (Baf) for 24 h. Scale bars 20 µm. (F) Quantification of p62 aggregates from (E). Arbitrary aggregate score was calculated as the mean GFP fluorescence intensity per cell in at least 5 images per biological replicate (1–5 cells/image; n = 5 biological replicates). (G) Representative immunofluorescent images of p62 (green), smooth muscle actin (red) and nuclei (TOPRO, blue) in carotid artery sections from MsrA-/- and WT mice. 100 × , scale bar 10 µm. NC denotes negative control without primary antibody, p62 inset with p62 (green) only. Arrows denote p62 aggregates. (H) mRNA expression of p62 in VSMC from MsrA-/- and WT mice by qRT-PCR; data were normalized to ARP and expressed relative to p62 in WT VSMC (n = 5 biological replicates). * p < 0.05 versus WT by two-tailed t-test. (For interpretation of the references to color in this figure legend, the reader is referred to the web version of this article.)
Fig. 2
Fig. 2
Autophagy is increased in MsrA-/- VSMC. (A) Immunoblot of autophagy marker LC3 in MsrA-/- and WT VSMC with or without bafilomycin a1 (Baf) for indicated times. Upper band represents full-length LC3-I and lower band active, cleaved LC3-II. Positive control for autophagy: treatment with serum-free media (SF) for 2 h. (B) Quantification of LC3-II in MsrA-/- and WT VSMC relative to LC3-II in WT VSMC at 0 h; data were normalized to GAPDH (n = 4–5 biological replicates). * p < 0.05 versus WT by 2-way ANOVA. (C) Immunoblots for p62 and GAPDH in in MsrA-/- and WT VSMC with or without bafilomycin a1 (Baf) for 24 h. (D) Data in (C) were normalized to GAPDH and expressed relative to p62 in WT VSMC at 0 h. n = 8 biological replicates * p < 0.05 versus WT at untreated and # p < 0.05 vs MsrA-/- untreated by 1-way ANOVA. (E) MsrA-/- and WT VSMC were transduced with an adenovirus expressing LC3-GFP for 72 h. To some samples, bafilomycin was added for 24 h. Nuclei: blue (TOPRO). Scale bars 20 µm. (F) GFP puncta were quantified per cell, adjusted for cell area and expressed per 1000 µm2. n = 5 biological replicates. * p < 0.05 versus WT untreated # p < 0.05 vs MsrA-/- untreated by 1-way ANOVA.
Fig. 3
Fig. 3
MsrA deletion abrogates the interaction of Nrf2 with Keap1, resulting in Nrf2 nuclear localization and transcriptional activity. (A, B) Representative immunoblots (A) and quantitation (B) of the interaction of Keap1 with p62 in MsrA-/- and WT VSMC. Immunoprecipitation for Keap1, immunoblots for p62 and Keap1. n = 6 biological replicates. (C, D) Representative immunoblots (C) and quantitation (D) of the interaction of Keap1 with Nrf2. Immunoprecipitation for Nrf2, immunoblots for Keap1 and Nrf2. n = 4 biological replicates. (E-G) Representative immunoblot (E) and summary data for Nrf2 localization in nuclear (F) and cytoplasmic fractions (G) of MsrA-/- and WT VSMC. TOPO IIβ: nuclear marker; GAPDH: cytoplasmic marker. n = 7 biological replicates. (H) Nrf2-dependent transcriptional activity as determined by quantification of ARE-dependent luciferase activity in MsrA-/- and WT VSMC expressing ARE-luciferase reporter. n = 6 biological replicates. * p < 0.05 versus WT by two-tailed t-test.
Fig. 4
Fig. 4
Elevated Nrf2 protein expression under MsrA deficiency is due to protein stabilization rather than increased transcription. (A, B) Representative immunoblot (A) and quantification (B) for Nrf2 protein levels in whole cell lysates from MsrA-/- and WT VSMC; n = 3 biological replicates. (C) Nrf2 mRNA levels in VSMC by qRT-PCR; n = 5 biological replicates. (D) Representative immunoprecipitation of Nrf2 followed by immunoblot for ubiquitin in MsrA-/- and WT VSMC. IgG: IP with IgG, WT + MC132: IP with anti-Nrf2 in WT VSMC incubated with MG132, WCL: whole cell lysate of WT VSMC as controls. (E) Quantification of (D); n = 7 biological replicates. (F) p62 mRNA levels by qRT-PCR in aortic samples WT, MsrA-/- and MsrA-/- x Nrf2-/- mice; n = 7, 9 biological replicates. (G) Representative Immunoblots for Nrf2 and GAPDH in aortic samples from WT, MsrA-/- and MsrA-/- x Nrf2-/- mice. (H) Quantification of (G) n = 7 biological replicates. (E) * p < 0.05 versus WT by two-tailed t-test, H) p < 0.05 versus WT by 1-way ANOVA.
Fig. 5
Fig. 5
Expression and activity of Nrf2-regulated genes are elevated under MsrA deletion. (A, B) GCLC (A) and GR (B) mRNA levels in MsrA-/- and WT VSMC by qRT-PCR, normalized to ARP; n = 3 biological replicates. (C-E) Representative immunoblot (C) and summary data for GCLC (D) and GR (E) protein levels in whole cell lysates from MsrA-/- and WT VSMC. Data were normalized to GAPDH; n = 6–7 biological replicates. (F) GR activity, normalized to total protein concentration; n = 4 biological replicates. (G, H) Levels of reduced glutathione (GSH, G) and oxidized glutathione (GSSG, H), normalized to total protein; n = 4 biological replicates. (I) Ratio of reduced/oxidized glutathione. (J) Glutathione transferase (GST) activity, normalized to total protein; n = 7 biological replicates. * p < 0.05 versus WT by two-tailed t-test.
Fig. 6
Fig. 6
MsrA deletion does not increase oxidative stress in vascular smooth muscle cells or aorta. (A, B) Representative images (A) and quantification (B) of Cell ROX fluorescence (red) in MsrA-/- and WT VSMC. Nuclei: blue (TOPRO). Data were quantified as the fold-change relative to WT; n = 4 biological replicates. Scale bars 20 µm. (C) Superoxide levels in MsrA-/- and WT VSMC by L-012. Data were normalized to total protein; n = 4 biological replicates* p < 0.05 versus WT by two-tailed t-test. (D, E) Representative images (D) and summary data (E) of DHE staining (red) in aortic sections from MsrA-/- and WT mice; n = 11 biological replicates. Scale bars 50 µm. (F, G) Representative immunoblots (F) and summary data (G) for oxidized proteins in the indicated tissues from MsrA-/- and WT mice. Oxidized proteins were normalized to GAPDH (loading control); n = 4 biological replicates. (For interpretation of the references to color in this figure legend, the reader is referred to the web version of this article.)
Fig. 7
Fig. 7
Apoptosis is decreased at baseline in MsrA-deficient vascular smooth muscle cells. (A, B) Representative dot plot (A) and summary data (B) of Annexin V by flow cytometry in MsrA-/- and WT VSMC. Data were quantified as the number of Annexin V positive cells relative to the total number of cells; n = 7–9 biological replicates. (C, D) Representative images (C) and summary data (D) TUNEL staining (red) in MsrA-/- and WT VSMC. Nuclei: blue (TOPRO); n = 5 biological replicates. Scale bars 50 µm. (E, F) Representative immunoblot (E) and summary data (F) for Bcl-2 expression in whole cell lysates from MsrA-/- and WT VSMC. Data were normalized to GAPDH; n = 6–7 biological replicates. (G) Oxidative stress-induced apoptosis by Annexin V staining (green) in MsrA-/- and WT VSMC treated with the indicated concentrations of H2O2 for 60 min (H) Summary data for G. n = 7–12 replicates. Nuclei: red (TOPRO). (B, D, F) * p < 0.05 versus WT by two-tailed t-test. (H) # p < 0.05 versus WT by multiple t-tests, one per row. (For interpretation of the references to color in this figure legend, the reader is referred to the web version of this article.)

Similar articles

Cited by

References

    1. Robison A. Oxidation of calmodulin alters activation and regulation of CaMKII. Biochem. Biophys. Res. Commun. 2007;356(1):97–101. - PMC - PubMed
    1. Gu S.X., Stevens J.W., Lentz S.R. Regulation of thrombosis and vascular function by protein methionine oxidation. Blood. 2015;125(25):3851–3859. - PMC - PubMed
    1. Erickson J.R. A dynamic pathway for calcium-independent activation of CaMKII by methionine oxidation. Cell. 2008;133(3):462–474. - PMC - PubMed
    1. Ciorba M.A. Modulation of potassium channel function by methionine oxidation and reduction. Proc. Natl. Acad. Sci. USA. 1997;94(18):9932–9937. - PMC - PubMed
    1. Jones E.M., Squier T.C., Sacksteder C.A. An altered mode of calcium coordination in methionine-oxidized calmodulin. Biophys. J. 2008;95(11):5268–5280. - PMC - PubMed

Publication types

MeSH terms

LinkOut - more resources