. 2018 Oct 2;138(14):1431-1445.
doi: 10.1161/CIRCULATIONAHA.117.031231.

Regulation of Blood Pressure by Targeting CaV1.2-Galectin-1 Protein Interaction

Affiliations

Regulation of Blood Pressure by Targeting CaV1.2-Galectin-1 Protein Interaction

Zhenyu Hu et al. Circulation. .

Abstract

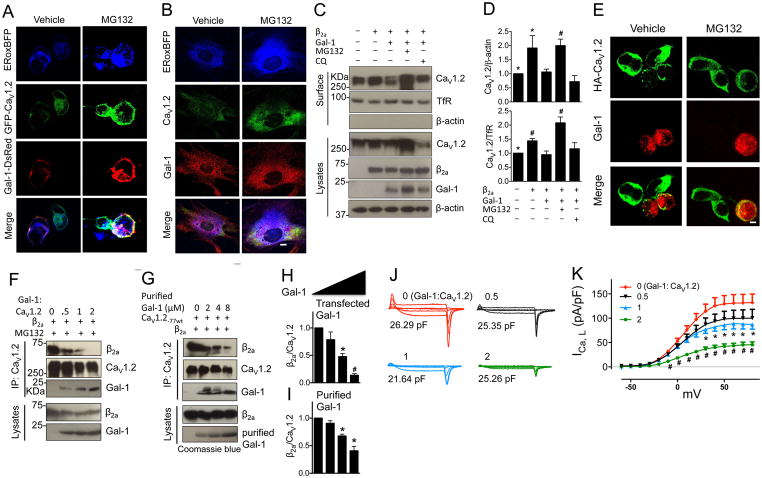
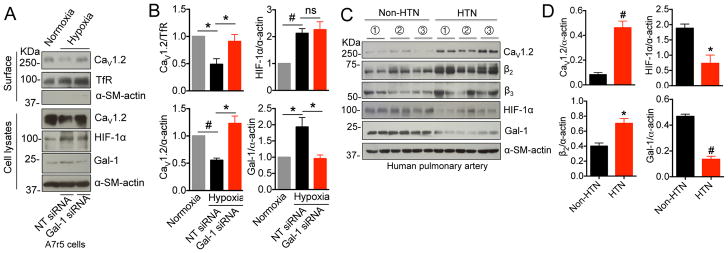
Background: L-type CaV1.2 channels play crucial roles in the regulation of blood pressure. Galectin-1 (Gal-1) has been reported to bind to the I-II loop of CaV1.2 channels to reduce their current density. However, the mechanistic understanding for the downregulation of CaV1.2 channels by Gal-1 and whether Gal-1 plays a direct role in blood pressure regulation remain unclear.

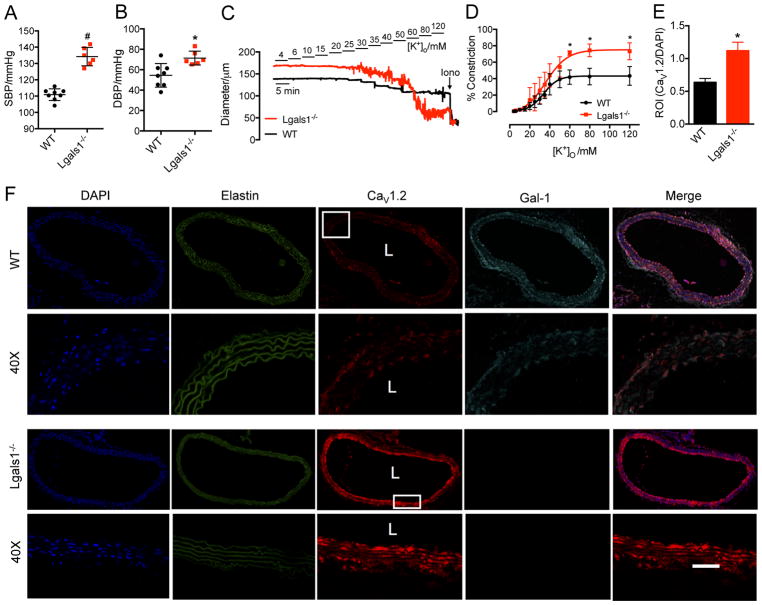
Methods: In vitro experiments involving coimmunoprecipitation, Western blot, patch-clamp recordings, immunohistochemistry, and pressure myography were used to evaluate the molecular mechanisms by which Gal-1 downregulates CaV1.2 channel in transfected, human embryonic kidney 293 cells, smooth muscle cells, arteries from Lgasl1-/- mice, rat, and human patients. In vivo experiments involving the delivery of Tat-e9c peptide and AAV5-Gal-1 into rats were performed to investigate the effect of targeting CaV1.2-Gal-1 interaction on blood pressure monitored by tail-cuff or telemetry methods.

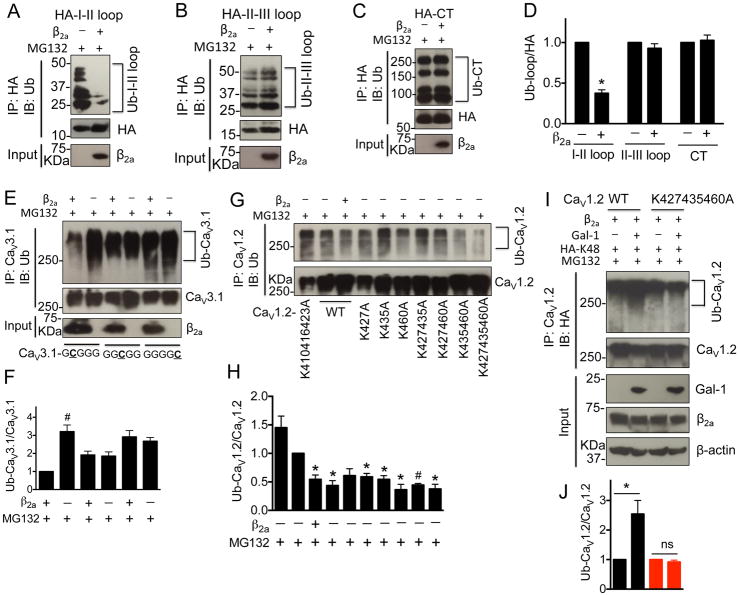
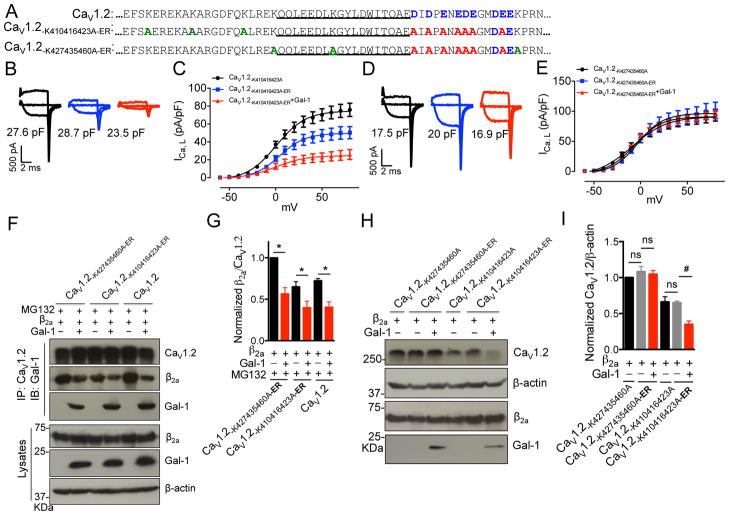
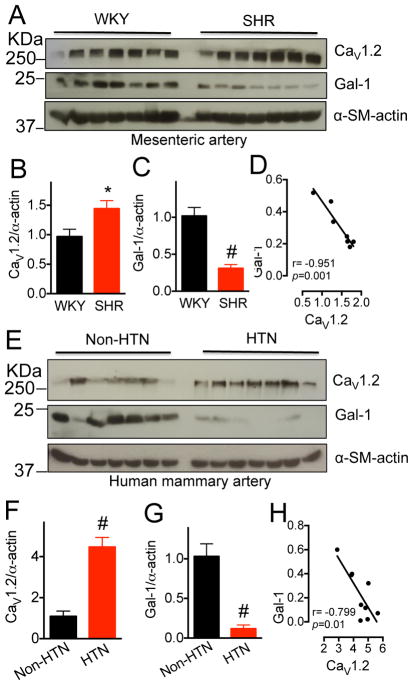
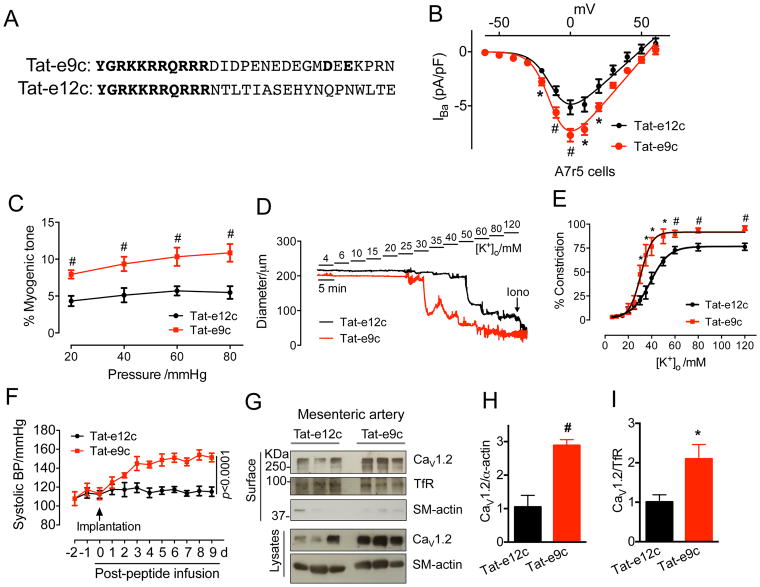
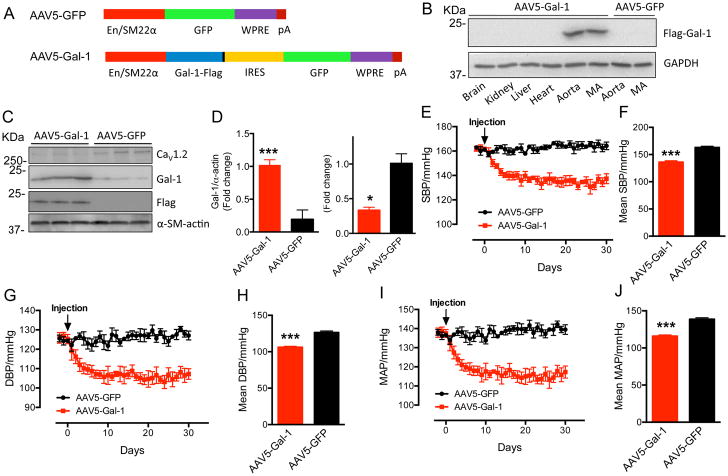
Results: Our study reveals that Gal-1 is a key regulator for proteasomal degradation of CaV1.2 channels. Gal-1 competed allosterically with the CaVβ subunit for binding to the I-II loop of the CaV1.2 channel. This competitive disruption of CaVβ binding led to CaV1.2 degradation by exposing the channels to polyubiquitination. It is notable that we demonstrated that the inverse relationship of reduced Gal-1 and increased CaV1.2 protein levels in arteries was associated with hypertension in hypertensive rats and patients, and Gal-1 deficiency induces higher blood pressure in mice because of the upregulated CaV1.2 protein level in arteries. To directly regulate blood pressure by targeting the CaV1.2-Gal-1 interaction, we administered Tat-e9c, a peptide that competed for binding of Gal-1 by a miniosmotic pump, and this specific disruption of CaV1.2-Gal-1 coupling increased smooth muscle CaV1.2 currents, induced larger arterial contraction, and caused hypertension in rats. In contrasting experiments, overexpression of Gal-1 in smooth muscle by a single bolus of AAV5-Gal-1 significantly reduced blood pressure in spontaneously hypertensive rats.

Conclusions: We have defined molecularly that Gal-1 promotes CaV1.2 degradation by replacing CaVβ and thereby exposing specific lysines for polyubiquitination and by masking I-II loop endoplasmic reticulum export signals. This mechanistic understanding provided the basis for targeting CaV1.2-Gal-1 interaction to demonstrate clearly the modulatory role that Gal-1 plays in regulating blood pressure, and offering a potential approach for therapeutic management of hypertension.

Keywords: blood pressure; calcium channels, L type; galectin-1; hypertension; proteasome endopeptidase complex.


Figures

Figure 1
Figure 1. Gal-1 reduces total and surface biotinlyated CaV1.2 protein by competitively displacing CaVβ subunit and promoting proteasomal degradation of CaV1.2 channels
(A) Representative immunofluorescent staining of total CaV1.2 channels and Gal-1 in HEK293 cells expressing GFP-CaV1.2, Gal-1-DsRed and ERoxBFP (a marker of ER) with or without MG132 treatment. Scale bar, 20 μm. 6 sets of experiments were repeated in HEK293 cells. (B) Representative immunofluorescent staining of total CaV1.2 channels and Gal-1 in permeabilized vascular smooth muscle cells (VSMC) expressing ERoxBFP with or without MG132 treatment. Scale bar, 20 μm. 3 sets of experiments were repeated. (C, D) Western blots and quantifications of total and surface biotinylated CaV1.2 channels co-transfected into HEK 293 cells with α2δ and/or β2a subunit, or Gal-1, in the presence or absence of proteasome inhibitor MG132 (a proteasomal inhibitor, 1 μM) or lysosome inhibitor chloroquine (chloroquine, 40 μM) for 16 h (n=4). Data were shown as mean ± SEM. *p<0.05, #p<0.01 versus second lane. (E) Representative immunofluorescent staining of surface HA-CaV1.2 channels in non-permeabilized HEK293 cells co-expressing β2a subunit (no GFP) or in combination with Gal-1. Scale bar, 20 μm. (F) Western blots of the ratio of β2a subunit to CaV1.2 channels co-expressed with Gal-1 at different amounts (molar ratio of Gal-1 to CaV1.2 ranged from 0 to 2, n=4). (G) Western blots of the ratio of β2a subunit to CaV1.2 channels in cell lysates incubated with purified Gal-1 proteins at different concentrations ranging from 0 to 8 μM and then immunoprecipitated with anti-CaV1.2 (n=4). (H, I) Quantifications of the ratio of β2a subunit to CaV1.2 channels with increasing transfected Gal-1 or purified Gal-1 proteins. (J, K) ICa,L was recorded by Tail protocol in HEK293 cells co-transfected with Cav1.2, α2δ and β2a subunit, vector (red, n=10), or Gal-1 with different molar ratios to CaV1.2 channels (Gal-1:CaV1.2=1/2 (black, n=12), 1 (blue, n=12) or 2 (green, n=14)) in 1.8 mM Ca2+ external solution. Data were shown as mean ± SEM, *p<0.05, #p<0.01 versus vector group.
Figure 2
Figure 2. CaVβ subunits prevent the CaV1.2 ubiquitination by masking the lysines (K427, K435 and K460) within I–II loop
(A–D) Western blots and quantifications of ubiquitinated I–II loop, II–III loop and C-terminus in the presence or absence of β2a subunits in tranfected HEK 293 cells treated with MG132 (1 μM) for 16 h (n=4). (E, F) Western blots and quantifications of ubiquitinated chimeric CaV3.1 channels containing CaV1.2 I–II loop, II–III loop or C-terminus in the presence or absence of β2a subunits in tranfected HEK 293 cells treated with MG132 (1 μM) for 16 h (n=4). (G, H) Western blots and quantifications of ubiquitinated full length CaV1.2 channels with mutations of lysines within I–II loop into alanines in the presence or absence of β2a subunits in tranfected HEK 293 cells treated with MG132 (1 μM) for 16 h (n=5). (I, J) Western blots and quantifications of ubiquitinated CaV1.2-77wt or CaV1.2-K427435460A channels in HEK 293 cells co-transfected with β2a subunit, HA-Ub-K48 (All lysines were mutated except K48) in the presence or absence of Gal-1 (n=4). Cell lysates were harvested after MG132 (1 μM) treatment for 16 h. Data were shown as mean ± SEM. *p<0.05, #p<0.01 versus control group.
Figure 3
Figure 3. Gal-1 binding precludes trafficking of CaV1.2 channel due to ER export signal within exon 9
(A) Alignment of exon 9 of CaV1.2, CaV1.2-K410416423A-ER, CaV1.2-K427435460A-ER channels with highlight of key residue differences (Blue, ER export signal; Red, mutations of ER export signals into alanines; Green, mutations of lysines into alanines). (B, C) ICa,L was recorded by Tail protocol in HEK 293 cells transfected with CaV1.2-K410416423A (n=14) or CaV1.2-K410416423A-ER channels with (n=10) or without (n=12) Gal-1 in an external solution containing 1.8 mM Ca2+. (D, E) ICa,L was recorded by Tail protocol in HEK 293 cells transfected with CaV1.2-K427435460A (n=16) or CaV1.2-K427435460A-ER channels with (n=11) or without (n=15) Gal-1. (F, G) Western blots and quantifications of the ratio of β2a subunit to CaV1.2-K427435460A-ER, CaV1.2-K410416423A-ER or CaV1.2 channels with or without Gal-1 co-expression with MG132 treatment (1 μM, n=4). (H, I) Western blots and quantifications of the total expression of the CaV1.2-K427435460A, CaV1.2-K427435460A-ER, CaV1.2-K410416423A or CaV1.2-K410416423A-ER channels with or without Gal-1 co-expression (n=4). Data were shown as mean ± SEM. ns: non-significant. *p<0.05, #p<0.01 versus control group.
Figure 4
Figure 4. Gal-1 is down-regulated in arteries of spontaneously hypertensive rats and hypertensive patients
(A–C) Western blots and quantifications of total CaV1.2 channels and Gal-1 in aorta from 15~16-week-old WKY or SHR (n=7). α-smooth muscle actin was used as the loading control. (D) Scatter-plots showing the negative correlation between CaV1.2 and Gal-1 protein levels in arteries of SHR. r, Pearson correlation coefficient. (E–G) Western blots and quantifications of total CaV1.2 channels and Gal-1 in mammary arteries from human patients with (HTN) or without (Non-HTN) hypertension (n=11). All patients underwent coronary artery bypass graft surgery. Data were shown as mean ± SEM. *p<0.05, #p<0.01 versus WKY or NON-HTN group. (H) Scatter-plots showing the negative correlation between CaV1.2 and Gal-1 protein levels in arteries of hypertensive patients. r, Pearson correlation coefficient. Two outliers were excluded.
Figure 5
Figure 5. Gal-1 down-regulation by reduced HIF-1α in hypertensive human pulmonary arteries
(A, B) Western blots and quantifications of surface and total CaV1.2 channels, HIF-1α and Gal-1 in A7r5 cells under normoxia or hypoxia with transfection of NT siRNA or Gal-1 siRNA (n=4). (C, D) Western blots and quantifications of total CaV1.2 channels, β2 and β3 subunits, HIF-1α and Gal-1 in non-hypertensive or hypertensive human pulmonary arteries (n=3, each sample has two replicates). Data were shown as mean ± SEM. *p<0.05, #p<0.01 versus control group. ns, non-significant. HTN, hypertensive.
Figure 6
Figure 6. Gal-1 deficiency induces higher blood pressure in mice by up-regulating vascular CaV1.2 channels
(A, B) Gal-1 deficiency increases both systolic and diastolic blood pressure in 10-week-old mice (WT, n=8, Lgals1−/−, n=6). (C) Representative traces of arterial constriction in freshly isolated mesenteric arteries from WT or Lgals1−/− mice recorded by stepwise increases of [K+]o, from 4 mmol/L to 120 mmol/L. Ionomycin (Iono, 10 μmol/L) was given to induce maximal constriction. (D) Concentration–response curves of [K+]o for the effects of Gal-1 deficiency on the contractility of mesenteric arteries (n=6 for each group). (E) Quantitative analysis of CaV1.2 intensity in aorta isolated from WT or Lgals1−/− mice followed by normalization to DAPI intensity. n=3 mice, and 6 sections for each group were used for analysis. (F) Representative confocal images of total CaV1.2 channels and Gal-1 in aorta from WT or Lgals1−/− mice. Elastin autofluorescence was also detected to show the entire structure of aorta. For last merged image in row 1 and 3, the channels for DAPI, CaV1.2 (AF594) and Gal-1 (AF647) were merged together. For the magnified images in row 2 and 4, only the channels for CaV1.2 (AF594) and Gal-1 (AF647) were merged together to show the co-localization of CaV1.2 channel and Gal-1 in smooth muscle. L stands for lumen of aorta. Scale bar: 20 μm. Data were shown as mean ± SEM. * p<0.05, # p<0.01 versus control group.
Figure 7
Figure 7. Tat-e9c infusion increases blood pressure through up-regulating CaV1.2 channels in rats
(A) Sequence alignment of Tat peptides used for in vitro and in vivo studies. (B) L-type CaV1.2 current density in A7r5 cells treated with Tat-e9c peptide (4 μM, n=16) for 24 h. I–V curves were obtained in an external solution containing 5 mM Ba2+. Nimodipine (5 μM) was used to block L-type calcium currents in A7r5 cells (also see Figure S10K, L). (C) Quantifications of myogenic tone of rat mesenteric arteries treated with Tat-e12c (10 μM, n=10) or Tat-e9c (10 μM, n=10) for 24 h. (D) Representative traces of arterial constriction after 24 h treatment with Tat-e12c (10 μM, n=10) or Tat-e9c (10 μM, n=10) recorded by stepwise increases of [K+]o, from 4 mmol/L to 120 mmol/L. Ionomycin (Iono, 10 μmol/L) was given to induce maximal constriction. (E) Concentration-response curves of [K+]o for the effects of Tat-e12c or Tat-e9c on the contractility of mesenteric arteries. Data were shown as mean ± SEM. *P<0.05, #P<0.01 versus control group. (F) Daily systolic blood pressures in rats before, during or after 9-day Tat-e9c infusion (n=6 for each group). Osmotic mini-pumps were implanted via jugular vein at day 0. Tat-e9c-treated rats exhibited an increase in systolic BP at day 1 after Tat-e9c infusion and reaching to a peak at day 3 (148.6±3.7 mmHg; versus 115.9±2.0 mmHg for Tat-e12c group. Data were analyzed by two-way repeated measures ANOVA (F(1, 10)=492.350, p<0.0001 for treatment; F(11, 110)=37.410, p<0.0001 for time; F(11, 110)=23.310, p<0.0001 for interaction). (G–I) Western blots and quantifications of biotinylated surface and total CaV1.2 channels in mesenteric arteries in Tat-e12c- or Tat-e9c-treated rats (n=6). α-smooth muscle actin was used as the loading control. Data were shown as mean ± SEM. *p<0.05, #p<0.01 versus Tat-e12c group.
Figure 8
Figure 8. AAV5-Gal-1 by single injection significantly decreases blood pressure of SHR
(A) Schematic diagrams of AAV5-Gal-1 and control AAV5-GFP. (B) Tissue-selective expression of exogenous Flag-Gal-1 delivered by AAV5 in SHR. MA: mesenteric artery. (C, D) Western blots and quantification of Exogenous Flag-Gal-1, Gal-1 or CaV1.2 in thoracic aorta in AAV5-Gal-1 or AAV5-GFP-treated SHR (n=3). (E–J) Compared to control AAV5-GFP (1×10¹³ vg/kg, n=4), from day 7 onwards, SHR subject to single injection of AAV5-Gal-1 (1×10¹³ vg/kg, n=3) reached a maximal reduction of the systolic BP (SBP) at about 27 mmHg (E, F), the diastolic BP (DBP) at about 20 mmHg (G, H) and the mean arterial pressure (MAP) at about 23 mmHg (I, J), respectively, and remain reduced until day 30. Mean SBP (F), DBP (H) and MAP (J) stands for the average blood pressure from day 7 to day 30. Data were shown as mean ± SEM. *p<0.05, ***p<0.001 versus AAV5-GFP group.

Similar articles

Cited by

References

    1. Mozaffarian D, Benjamin EJ, Go AS, Arnett DK, Blaha MJ, Cushman M, Das SR, de Ferranti S, Despres JP, Fullerton HJ, Howard VJ, Huffman MD, Isasi CR, Jimenez MC, Judd SE, Kissela BM, Lichtman JH, Lisabeth LD, Liu S, Mackey RH, Magid DJ, McGuire DK, Mohler ER, 3rd, Moy CS, Muntner P, Mussolino ME, Nasir K, Neumar RW, Nichol G, Palaniappan L, Pandey DK, Reeves MJ, Rodriguez CJ, Rosamond W, Sorlie PD, Stein J, Towfighi A, Turan TN, Virani SS, Woo D, Yeh RW, Turner MB. Executive summary: Heart disease and stroke statistics--2016 update: A report from the american heart association. Circulation. 2016;133:447–454. - PubMed
    1. Chen S, Cao P, Dong N, Peng J, Zhang C, Wang H, Zhou T, Yang J, Zhang Y, Martelli EE, Naga Prasad SV, Miller RE, Malfait AM, Zhou Y, Wu Q. PCSK6-mediated corin activation is essential for normal blood pressure. Nat Med. 2015;21:1048–1053. - PMC - PubMed
    1. Rensen SS, Niessen PM, van Deursen JM, Janssen BJ, Heijman E, Hermeling E, Meens M, Lie N, Gijbels MJ, Strijkers GJ, Doevendans PA, Hofker MH, De Mey JG, van Eys GJ. Smoothelin-B deficiency results in reduced arterial contractility, hypertension, and cardiac hypertrophy in mice. Circulation. 2008;118:828–836. - PubMed
    1. Berridge MJ. Smooth muscle cell calcium activation mechanisms. J Physiol. 2008;586:5047–5061. - PMC - PubMed
    1. Moosmang S, Schulla V, Welling A, Feil R, Feil S, Wegener JW, Hofmann F, Klugbauer N. Dominant role of smooth muscle L-type calcium channel Cav1.2 for blood pressure regulation. Embo J. 2003;22:6027–6034. - PMC - PubMed

Publication types

MeSH terms

Supplementary concepts