. 2018 May;28(5):625-638.
doi: 10.1101/gr.229070.117. Epub 2018 Apr 12.

Enduring epigenetic landmarks define the cancer microenvironment

Affiliations

Enduring epigenetic landmarks define the cancer microenvironment

Ruth Pidsley et al. Genome Res. 2018 May.

Abstract

The growth and progression of solid tumors involves dynamic cross-talk between cancer epithelium and the surrounding microenvironment. To date, molecular profiling has largely been restricted to the epithelial component of tumors; therefore, features underpinning the persistent protumorigenic phenotype of the tumor microenvironment are unknown. Using whole-genome bisulfite sequencing, we show for the first time that cancer-associated fibroblasts (CAFs) from localized prostate cancer display remarkably distinct and enduring genome-wide changes in DNA methylation, significantly at enhancers and promoters, compared to nonmalignant prostate fibroblasts (NPFs). Differentially methylated regions associated with changes in gene expression have cancer-related functions and accurately distinguish CAFs from NPFs. Remarkably, a subset of changes is shared with prostate cancer epithelial cells, revealing the new concept of tumor-specific epigenome modifications in the tumor and its microenvironment. The distinct methylome of CAFs provides a novel epigenetic hallmark of the cancer microenvironment and promises new biomarkers to improve interpretation of diagnostic samples.


Figures

Figure 1.
Figure 1.
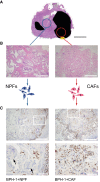
Isolation and validation of matched CAFs and NPFs from patient tissue. Representative data from patient 1. (A) Matched nonmalignant (blue) and cancer (red) tissue were dissected from the same radical prostatectomy specimen and used to establish primary cultures of CAFs and NPFs. (Scale) 2 cm. (B) Hematoxylin and eosin staining confirmed that NPFs were from a nonmalignant region and that CAFs were from a region of Gleason 3+4 cancer. (Scales) 500 µm. (C) Grafts from tissue recombination assays with BPH-1 epithelial cells stained for SV40 T antigen (brown) and nuclei counterstained with hematoxylin (blue). BPH-1 cells combined with NPFs formed well-differentiated structures, evident from organized layers of epithelial cells with abundant keratinization (arrows). In contrast, BPH-1 cells combined with CAFs formed poorly differentiated structures, consistent with tumorigenesis, apparent from the disorganized clusters of epithelial cells and limited keratinization. White boxes indicate the areas shown in higher magnification. (Scales) 500 µm for low magnification images and 100 µm for high magnification images.
Figure 2.
Figure 2.
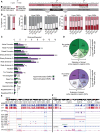
CAFs and NPFs have similar global methylation profiles but discrete methylomic differences. (A) Representative SNP array data (patient 1) showing no large-scale genomic aberrations. (B) High correlation (r = 0.90, P < 2.2 × 10⁻¹⁶) of WGBS DNA methylation levels between CAFs and NPFs (n = 4 pairs) indicates no global perturbations between cell types. (C) MDS plot of the 10% most variably methylated regions shows clear separation of CAFs and NPFs. (D) The number of hypermethylated (green) and hypomethylated (purple) DMRs in CAFs according to the percentage change in DNA methylation. (E) WBGS and 450K data for PITX2 for each NPF (blue) and CAF (red). The average difference in DNA methylation in CAFs compared to NPFs is shown in purple. The height of each vertical line represents the percentage of DNA methylation at each CpG site. The locations of 450K probes are shown in gray. The purple box highlights a large region of hypomethylation measured on both platforms.
Figure 3.
Figure 3.
DMRs occur at regulatory regions. (A) Schematic showing the genomic regions investigated in B. (B) The distribution of all CAF–NPF DMRs, and CAF–NPF DMRs grouped by percentage change in methylation, relative to each type of genomic region in A. (C) Comparison of CAF DMRs with ChromHMM data from normal fibroblasts. Numbers denote the number of DMRs associated with each type of region. Note that ENCODE defines two types of strong enhancers, weak enhancers, and repetitive/CNV regions. (D) The proportions of DMRs associated with LMRs and UMRs that are unique to NPFs (for hypermethylated DMRs) or CAFs (for hypomethylated DMRs) or that extend from LMRs and UMRs that are shared by NPFs and CAFs. (E) Pooled WGBS data (n = 4 patients) showing a hypomethylated DMR in the CD9 gene (blue box) occurring at a regulatory region defined by ChromHMM H3K27ac peaks (pink track) and a unique CAF LMR. Shared UMRs and LMRs between CAFs and NPFs are also shown (orange boxes). (F) A hypomethylated DMR in IGFBP2 (blue box) arising from a shared UMR that extends in CAFs. The DMR lies in a regulatory region defined by ChromHMM H3K27ac peaks.
Figure 4.
Figure 4.
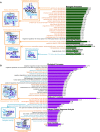
DMRs are associated with genes in cancer-related pathways. Genomic regions enrichment (GREAT) analysis of hypermethylated (A) and hypomethylated (B) DMRs in CAFs compared to NPFs. Bar charts display −log10 P-values from the binomial test for selected categories. Analysis shows enrichment for developmental processes and transcription factor binding (orange) and ligand-activated cell signaling (blue). Word clouds show the genes comprising each of the categories, with word size proportional to the number of proximal DMRs.
Figure 5.
Figure 5.
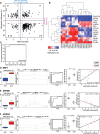
Consistent changes in DMRs associated with differentially expressed genes (DE-DMRs) between patients. (A) Scatter plot of DE-DMRs showing the average percentage difference in DNA methylation versus average log fold change (logFC) in expression (n = 4 CAF-NPF pairs). Dotted lines indicate the thresholds for DE-DMRs. (B) Nonhierarchical clustering of CAFs and NPFs from 10 independent patients based on the methylation status of 14 candidate DE-DMRs. The heatmap shows the percentage of DNA methylation of each DE-DMR in each sample. (C) Receiver operating characteristic (ROC) curve analysis based on the DNA methylation status of the 14 candidate DE-DMRs (AUC = 0.98, n = 10 CAF-NPF pairs). Representative examples of DE-DMRs in the EBF1 (D), EPHB6 (E), and HOXD8 (F) genes ([blue] NPF; [red] CAF), showing the average methylation across the amplicon in CAFs versus NPFs (one-sided paired t-test), the percentage of DNA methylation at each CpG site in each sample (trendlines denote the mean), ROC curves, the relative gene expression in each sample (with mean ± SEM, one-sided t-test), and the significant correlation between methylation and expression (Spearman's test). The # symbol denotes that HOXD8 expression was below the detection limit for NPF10, NPF13, NPF15, and NPF17; therefore, n = 6 for NPFs and n = 10 for CAFs.
Figure 6.
Figure 6.
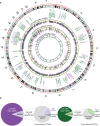
Tumor-specific DMRs common to CAFs and cancer cells. (A) Circos plot showing common DMRs identified by WGBS of CAF versus NPF, WGBS of LNCaP versus PrEC cells (middle), and 450K arrays of cancer versus normal tissue from TCGA (inner). (Green) Hypermethylated; (purple) hypomethylated. The height of each track represents a 50% methylation difference. Note that only tsDMRs are shown for LNCaP:PrEC and TCGA samples. (B) Pie charts showing the proportion of DMRs that are tsDMRs and that are consistent with 450K data from TCGA.
Figure 7.
Figure 7.
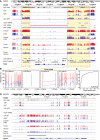
Diagnostic value of tumor-specific DMRs. (A) WGBS data for TBX3 in fibroblasts (CAFs vs. NPFs, n = 4 pairs), epithelial cells (LNCaP vs. PrEC), and patient tissue (matched tumor vs. normal) showing consistent hypermethylated tsDMRs in each data set. (B) 450K data from TCGA is also shown with dots indicating the DNA methylation status of tumor (red, n = 392) and normal (blue, n = 45) samples at each probe (trendlines denote mean methylation). (C) An ROC curve showing that the average methylation status of the four TBX3 tsDMRs discriminates between normal and cancer tissues in TCGA. (D) WGBS data showing lack of hypermethylation of the GSTP1 promoter CpG island in CAFs versus NPFs, unlike LNCaP versus PrEC and matched tumor versus normal patient tissues.
Figure 8.
Figure 8.
CCDC68 has prognostic value in localized prostate cancer. (A) WGBS data showing consistent hypermethylation of CCDC68 in CAFs versus NPFs (n = 4 pairs), LNCaP versus PrEC, and matched tumor versus normal tissues (n = 4 pairs). The locations of 450K probes are shown in gray. (B) Scatter plot of differentially expressed genes associated with hypermethylated tsDMRs. CCDC68 (purple) is down-regulated in CAFs versus NPFs (n = 4 pairs) and also in LNCaP versus PrEC cells. (C) Box plot showing decreased CCDC68 expression in tumor (n = 392) versus normal (n = 45) tissue samples from TCGA. (D) The relationship between 450K methylation averaged across all probes at the TSS of CCDC68 and gene expression for TCGA tumor specimens. (E,F) Kaplan–Meier curves showing low (blue) CCDC68 expression is associated with poor recurrence-free survival compared to high CCDC68 expression (orange) in Taylor (E) and Glinsky (F) data sets (n = 127 and n = 79 respectively, log-rank test).

References

    1. Albino D, Longoni N, Curti L, Mello-Grand M, Pinton S, Civenni G, Thalmann G, D'Ambrosio G, Sarti M, Sessa F, et al. 2012. ESE3/EHF controls epithelial cell differentiation and its loss leads to prostate tumors with mesenchymal and stem-like features. Cancer Res 72: 2889–2900. - PubMed
    1. Ao M, Franco OE, Park D, Raman D, Williams K, Hayward SW. 2007. Cross-talk between paracrine-acting cytokine and chemokine pathways promotes malignancy in benign human prostatic epithelium. Cancer Res 67: 4244–4253. - PubMed
    1. Aryee MJ, Jaffe AE, Corrada-Bravo H, Ladd-Acosta C, Feinberg AP, Hansen KD, Irizarry RA. 2014. Minfi: a flexible and comprehensive Bioconductor package for the analysis of Infinium DNA methylation microarrays. Bioinformatics 30: 1363–1369. - PMC - PubMed
    1. Ashida S, Orloff MS, Bebek G, Zhang L, Zheng P, Peehl DM, Eng C. 2012. Integrated analysis reveals critical genomic regions in prostate tumor microenvironment associated with clinicopathologic phenotypes. Clin Cancer Res 18: 1578–1587. - PubMed
    1. Ayala G, Tuxhorn JA, Wheeler TM, Frolov A, Scardino PT, Ohori M, Wheeler M, Spitler J, Rowley DR. 2003. Reactive stroma as a predictor of biochemical-free recurrence in prostate cancer. Clin Cancer Res 9: 4792–4801. - PubMed

Publication types