. 2018 Jul;103(7):1110-1123.
doi: 10.3324/haematol.2018.187708. Epub 2018 Apr 12.

Setd2 regulates quiescence and differentiation of adult hematopoietic stem cells by restricting RNA polymerase II elongation

Affiliations

Setd2 regulates quiescence and differentiation of adult hematopoietic stem cells by restricting RNA polymerase II elongation

Yile Zhou et al. Haematologica. 2018 Jul.

Abstract

SET domain containing 2 (Setd2), encoding a histone methyltransferase, is associated with many hematopoietic diseases when mutated. By generating a novel exon 6 conditional knockout mouse model, we describe an essential role of Setd2 in maintaining the adult hematopoietic stem cells. Loss of Setd2 results in leukopenia, anemia, and increased platelets accompanied by hypocellularity, erythroid dysplasia, and mild fibrosis in bone marrow. Setd2 knockout mice show significantly decreased hematopoietic stem and progenitor cells except for erythroid progenitors. Setd2 knockout hematopoietic stem cells fail to establish long-term bone marrow reconstitution after transplantation because of the loss of quiescence, increased apoptosis, and reduced multiple-lineage terminal differentiation potential. Bioinformatic analysis revealed that the hematopoietic stem cells exit from quiescence and commit to differentiation, which lead to hematopoietic stem cell exhaustion. Mechanistically, we attribute an important Setd2 function in murine adult hematopoietic stem cells to the inhibition of the Nsd1/2/3 transcriptional complex, which recruits super elongation complex and controls RNA polymerase II elongation on a subset of target genes, including Myc Our results reveal a critical role of Setd2 in regulating quiescence and differentiation of hematopoietic stem cells through restricting the NSDs/SEC mediated RNA polymerase II elongation.


Figures

Figure 1.
Figure 1.
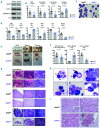
Setd2Δ/Δ mice showed leukopenia, anemia, erythroid dysplasia, increased thrombopoesis and mild bone marrow (BM) fibrosis. (A) Setd2 and H3K36me3 protein levels were determined by immunoblotting using c-Kit+ BM cells. Representative data were from 3 independent experiments. [N=3; mean±Standard Deviation (SD)]. (B) Complete blood count of Setd2f/f/Vav1-Cre mice, showing reduced white blood cells, lymphocytes, neutrophils, and platelets. [N=8 mice per genotype; mean±Standard Error of Mean (SEM)]. (C) Representative photos of Wright’s stained peripheral blood smear of Setd2f/f and Setd2f/f/Vav1-Cre mice. (D) Complete blood count of Setd2f/f/Vav1-Cre mice, showing reduced red blood cells, hemoglobin content, red blood cell specific volume (HCT), mean corpuscular hemoglobin concentration (MCHC), but increased mean corpuscular volume of red cells (MCV) and mean corpuscular hemoglobin (MCH). (N=8 mice per genotype; mean±SEM). (E) Representative photos of bones (tibia and fibula), spleens, and thymuses in Setd2f/f and Setd2f/f/Vav1-Cre mice. (F) BM cellularity, spleen weight, and thymus weight of Setd2f/f and Setd2f/f/Vav1-Cre mice. (N≥4 mice per genotype; mean±SEM). (G) Representative photos of hematoxylin & eosin-stained sections from the sternum, spleens, thymuses of Setd2f/f and Setd2f/f/Vav1-Cre mice. (H) Dysplastic erythroid cells can be found in BM cytospin: megaloblastic erythroid precursors, dysplatic erythroid precursors with multi-nucleation, nuclear fragments, or nuclear budding. In addition, erythroid cells can be caught in mitosis. (I). Representative photos of reticulin-stained sections from sternum of Setd2f/f and Setd2f/f/Vav1-Cre mice.
Figure 2.
Figure 2.
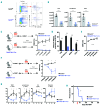
Setd2Δ/Δ mice showed profound reduction of myeloid, lymphoid and megakaryocyte progenitors but significantly increased erythroid progenitors. (A) Flow cytometry analysis of Setd2f/f and Setd2f/f/Vav1-Cre mice bone marrow (BM) cells. (B) Absolute number of hematopoietic progenitor cell (HPC) populations. [Setd2f/f =4, Setd2f/f/Vav1-Cre=5; mean±Standard Error of Mean (SEM)]. (C) Colony-forming cell (CFU) using BM cells from Setd2f/f or Setd2f/f/Vav1-Cre. 2×10⁴ cells were plated in M3434 in triplicate and colonies were scored every seven days. GEMM: granulocyte, erythroid, macrophage, megakaryocyte colony; GM: granulocyte/macrophage; G/M: granulocyte or macrophage; BFU-E: burst formation unit-erythroid. Representative data were from 3 independent experiments. (N=3; mean±Standard Deviation (SD)]. (D) CFU-erythroid (CFU-E) assay using BM cells from Setd2f/f or Setd2f/f/Vav1-Cre. 5×10⁵ cells were plated in M3334 in triplicate and colonies were scored 48 hours later. Representative data were from 3 independent experiments. (N=3; mean±SD).
Figure 3.
Figure 3.
Setd2Δ/Δ mice had depletion of phenotypic and functional hematopoietic stem cells (HSCs). (A) Flow cytometry analysis of Setd2f/f and Setd2f/f/Vav1-Cre mice bone marrow (BM) cells. (B) Absolute number of HSC populations. (Setd2f/f =4, Setd2f/f/Vav1-Cre=5; mean±Standard Error of Mean (SEM)] (C). Experimental strategy: Setd2f/f or Setd2f/f/Mx1-Cre (pIpC injected) CD45.2 BM cells (1.5×10⁶ cells each) was injected into irradiated (7.5+4.25Gy) B6-CD45.1 recipients, with B6-CD45.1 competitor BM (1.5×10⁶ cells each). Peripheral blood (PB) was analyzed 2-16 weeks after competitive transplantation. Representative data were from 2 independent experiments. (N=8 each genotype; mean±SEM). (D) CD45.1/CD45.2 chimerism in BM LSKs, Gr1+CD11b+ myeloid cells, B220+ B cells, CD3+ T cells 16 weeks after transplantation. Representative data were from 2 independent experiments. (N=8 each genotype; mean±SEM). (E) Experimental strategy: Setd2f/f or Setd2f/f/Vav1-Cre CD45.2 BM cells (1.5×10⁶ cells each) was injected into irradiated (7.5+4.25Gy) B6-CD45.1 recipients, with B6-CD45.1 competitor BM (1.5×10⁶ cells each). PB was analyzed 4-16 weeks after competitive transplantation. Representative data were from 2 independent experiments. (N=8 each genotype; mean±SEM). (F and G) Experimental strategy: Setd2f/f or Setd2f/f/Mx1-Cre CD45.2 BM was injected into irradiated (7.5+4.25Gy) B6-CD45.1 recipients (2×10⁶ cells per genotype), with B6-CD45.1 helper BM (1×10⁵ cells). pIpC was injected two weeks after BMT. Peripheral blood were analyzed 0-10 weeks after pIpC injection. Representative data were from 2 independent experiments. (N=8 each genotype; mean±SEM). (H) Experimental strategy: Setd2f/f or Setd2f/f/Vav1-Cre CD45.2 BM was injected into irradiated (7.5+4.25Gy) B6-CD45.1 recipients (2×10⁶ cells per genotype), with B6-CD45.1 helper BM (1×10⁵ cells), survival conditions were monitored. (N=6 each genotype; mean±SEM).
Figure 4.
Figure 4.
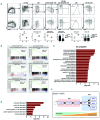
Setd2Δ/Δ hematopoietic stem cells (HSCs) show reduced quiescence, but increased apoptosis and differentiation. (A) Experimental strategy: Setd2f/f and Setd2f/f/Vav1-Cre mice were injected with 150 mg/kg 5-fluorouracil (FU) and sacrificed eight days later (left). Statistical analyses of the bone marrow (BM) cellularity and absolute number of long-term (LT)-HSCs analyzed by flow cytometry (right). Representative data were from 3 independent experiments. (N=6 each genotype; mean±Standard Error of Mean (SEM)]. (B) Experimental strategy: Setd2f/f and Setd2f/f/Vav1-Cre mice were injected with 150 mg/kg 5-FU weekly and monitored for survival (left). Survical curve (right) (n=6 each genotype). (C) Flow cytometry analysis of Setd2f/f and Setd2f/f/Vav1-Cre BM cells with Ki-67 and 7-AAD. Gating strategy is shown in one representative FACS blots per genotype (left). Summary of statistical analyses showed decreased G0 distribution in Setd2f/f/Vav1-Cre LT-HSCs (right). Representative data were from 3 independent experiments. (N=6 each genotype; mean±SEM). (D) Flow cytometry analysis of Setd2f/f and Setd2f/f/Vav1-Cre BM cells with Annexin V and 7-AAD. Gating strategy is shown in one representative FACS blots per genotype (left). Summary of statistical analyses showed increased distribution into AnnexinV positive fraction in Setd2f/f/Vav1-Cre SLAM-HSCs. Representative data were from 3 independent experiments. (N=6 each genotype; mean ± SEM). (E) The bar figure shows the number of clones generated by Setd2f/f and Setd2f/f/Vav1-Cre single LT-HSCs per 60-well plate (top left). Pie chart shows the relative frequencies of 4-lineage, 3-lineage, 2-lineage, and 1-lineage clones generated from Setd2f/f and Setd2f/f/Vav1-Cre single LT-HSCs (bottom left). Wright’s stained cytospin showed representative pictures of 4-lineage, 3-lineage, 2-lineage, and 1-lineage clones generated from Setd2f/f and Setd2f/f/Vav1-Cre single LT-HSCs (right). Representative data were from 2 independent experiments. (N=4 each genotype; mean±SEM).
Figure 5.
Figure 5.
Setd2Δ/Δ hematopoietic stem cells (HSCs) show loss of stem cell identity and increased differentiation toward progenitors. (A) Flow cytometry analysis of Setd2f/f and Setd2f/f/Vav1-Cre mice bone marrow (BM) cells. [N=3 each genotype; mean±Standard Error of Mean (SEM)]. (B) Gene Set Enrichment Analysis (GSEA) for genes affected in the LSKs of Setd2f/f and Setd2f/f/Vav1-Cre mice, after RNA-seq analyses. (A–E) Enrichment of HSC, long-term (LT)-HSC, short-term (ST)-HSC, early progenitors, intermediate progenitors, and late progenitors gene sets in LSKs of Setd2f/f and Setd2f/f/Vav1-Cre mice, respectively. All gene sets are from GSEA molecular signature database. (C and D) Up-regulated gene ontology analysis of differentially expressed genes. (E) Diagram of Setd2Δ/Δ HSPC differentiation.
Figure 6.
Figure 6.
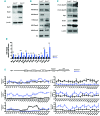
Setd2Δ/Δ hematopoietic stem cells (HSCs) show increased Nsds and RNA Pol II elongation associated phosphorylation changes. (A) Nsd1/2/3 and β-actin levels were determined by immunoblotting using bone marrow (BM) LSK cells. (B and C) H3K36me1/2, H3K4me3, H3K79me2, H3K27me3, H3, RNA pol II (Ser2P), pol II (Ser5P), Gata1, Gata3, Klf1, Myc, and β-actin levels were determined by immunoblotting using BM LSK cells from Setd2f/fand Setd2f/f/Vav1-Cre mice. (D) Relative gene expression levels were determined by qrt-PCR using flow sorted SLAM-HSCs from Setd2f/f and Setd2f/f/Vav1-Cre mice. Representative data were from 3 independent experiments. [N=6 each genotype; mean±Standard Error of Mean (SEM)]. (E) ChIP-qPCR assays of Setd2, Setd2 related histone modifications, and pol II phosphorylated forms [Pol II (Ser5P) and pol II (Ser2P)] on Myc locus was determined with c-kit+ BM cells from Setd2f/fand Setd2f/f/Vav1-Cre mice. (Setd2f/f=5 and Setd2f/f/Vav1-Cre=8; mean±SEM from 2 independent experiments).
Figure 7.
Figure 7.
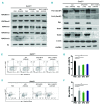
Setd2Δ/Δ deficiencies could be partially rescued by super elongation complex-related inhibitors. (A and B) Treatment of c-Kit+ bone marrow (BM) cells from Setd2f/f/Vav1-Cre mice with JQ1 500nM, EPZ-5676 1uM, BAY 1143572 400 nM for 24 h (h). Then cells were collected to determine the proteins levels of H3K36me1/2, H3K4me3, H3K79me2, H3K27me3, H3, RNA pol II (Ser2P), pol II (Ser5P), Gata1, Gata3, Myc, and β-actin by immunoblotting. (C and D) Flow cytometry analysis of drug-treated c-kit+ cells from Setd2f/f and Setd2f/f/Vav1-Cre mice with Annexin V and 7-AAD. Gating strategy is shown in one representative FACS blot per genotype. Summary of statistical analyses showed decreased distribution into AnnexinV positive fraction in drug-treated groups. Representative data were from 3 independent experiments. (Setd2f/f=6 and Setd2f/f/Vav1-Cre=12). (E and F) Flow cytometry analysis of drug treated c-kit+ cells from Setd2f/f and Setd2f/f/Vav1-Cre mice with Ki67 and Hoechst blue. Gating strategy is shown in one representative FACS blot per genotype. Summary of statistical analyses showed increased distribution into G0 fraction in drug-treated groups. Representative data are from 3 independent experiments; (Setd2f/f=6 and Setd2f/f/Vav1-Cre=12).
Figure 8.
Figure 8.
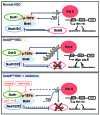
The diagram of our working model. In normal adult hematopoietic stem cells (HSCs), Setd2, responsible for H3K36me3, could repress Nsds, which are responsible for H3K36me1/2. Nsds interact with Brd4, p-TEFb, and Dot1l to stimulate transcriptional elongation. On the other hand, Setd2 binds to pol II (Ser2P) and pol II (Ser5P) doubly modified CTD repeats. Thus, a subset of genes, such as Myc, is maintained at a proper level to keep the balance between quiescence and differentiation of adult stem cells (top). In Setd2Δ/Δ HSCs, Setd2 loss leads to the upregulation of NSDs, which would further enhance the Pol II phosphorylation and elongation, resulting in the upregulation of Myc. When treated with Brd4/Dot1l/p-TEFb inhibitors, the pol II (Ser2), pol II (Ser5), and the expressions of the Myc could be down-regulated (bottom).

Comment in

References

    1. Kiel MJ, Yilmaz OH, Iwashita T, et al. SLAM family receptors distinguish hematopoietic stem and progenitor cells and reveal endothelial niches for stem cells. Cell. 2005;121(7):1109–1121. - PubMed
    1. Orkin SH, Zon LI. Hematopoiesis: an evolving paradigm for stem cell biology. Cell. 2008;132(4):631–644. - PMC - PubMed
    1. Dawson MA, Kouzarides T. Cancer epigenetics: from mechanism to therapy. Cell. 2012;150(1):12–27. - PubMed
    1. Oike T, Ogiwara H, Amornwichet N, Nakano T, Kohno T. Chromatin-regulating proteins as targets for cancer therapy. J Radiat Res. 2014;55(4):613–628. - PMC - PubMed
    1. Strahl BD, Grant PA, Briggs SD, et al. Set2 is a nucleosomal histone H3-selective methyltransferase that mediates transcriptional repression. Mol Cell Biol. 2002;22(5):1298–1306. - PMC - PubMed

Publication types

MeSH terms