

Co-targeting BET and MEK as salvage therapy for MAPK and checkpoint inhibitor-resistant melanoma
- PMID: 29650805
- PMCID: PMC5938620
- DOI: 10.15252/emmm.201708446
Co-targeting BET and MEK as salvage therapy for MAPK and checkpoint inhibitor-resistant melanoma
Abstract
Despite novel therapies for melanoma, drug resistance remains a significant hurdle to achieving optimal responses. NRAS-mutant melanoma is an archetype of therapeutic challenges in the field, which we used to test drug combinations to avert drug resistance. We show that BET proteins are overexpressed in NRAS-mutant melanoma and that high levels of the BET family member BRD4 are associated with poor patient survival. Combining BET and MEK inhibitors synergistically curbed the growth of NRAS-mutant melanoma and prolonged the survival of mice bearing tumors refractory to MAPK inhibitors and immunotherapy. Transcriptomic and proteomic analysis revealed that combining BET and MEK inhibitors mitigates a MAPK and checkpoint inhibitor resistance transcriptional signature, downregulates the transcription factor TCF19, and induces apoptosis. Our studies demonstrate that co-targeting MEK and BET can offset therapy resistance, offering a salvage strategy for melanomas with no other therapeutic options, and possibly other treatment-resistant tumor types.
Keywords: BET; combination therapy; drug resistance; melanoma; mutant NRAS.
© 2018 The Authors. Published under the terms of the CC BY 4.0 license.
Figures
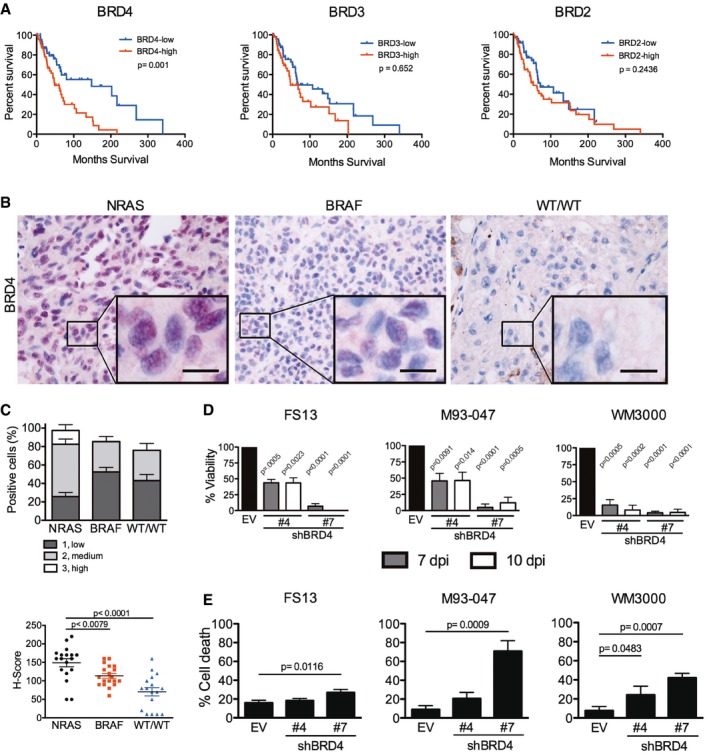
- A
NRAS‐mutant melanoma samples (n = 98) were analyzed from the skin cutaneous melanoma TCGA database. Samples were classified into high or low BRD4, BRD3, and BRD2 expressing groups according to the median tissue mRNA expression levels. Overall survival Kaplan–Meier curves for BRD4, BRD3, BRD2 in the NRAS‐mutant group are shown; P‐values were calculated by long‐rank tests comparing the two Kaplan–Meier curves.
- B, C
Fifty‐four patient samples were categorized in subgroups based on mutation status: NRAS (n = 18), BRAF (n = 19), or BRAF‐WT/NRAS‐WT (WT/WT; n = 17). (B) BRD4 expression was assessed by immunohistochemistry (IHC) in biopsies from patients with metastatic melanoma. BRD4 staining is localized in the nucleus. High magnification (40×) representative images are shown; the scale bar represents 20 μm. (C) BRD4 expression by IHC was scored blindly as low (1), medium (2), or high (3) for each sample. Scatter plot showing BRD4 expression in each subgroup ranging from total absence of BRD4 in the tumor (H‐score = 0) to high BRD4 expression (H‐score = 300). Each point represents the H‐score from a single tumor sample. The horizontal line represents the mean H‐score ± SEM.
- D
BRD4 was silenced using two different hairpins (#4 and #7) in NRAS‐mutant melanoma cells (FS13, M93‐047, and WM3000). Cell viability was determined by MTT assays 7 or 10 days post‐transduction (dpi) and calculated relative to empty vector (EV) control.
- E
Cell death (Annexin V+/PI+) was analyzed by flow cytometry 7 dpi.
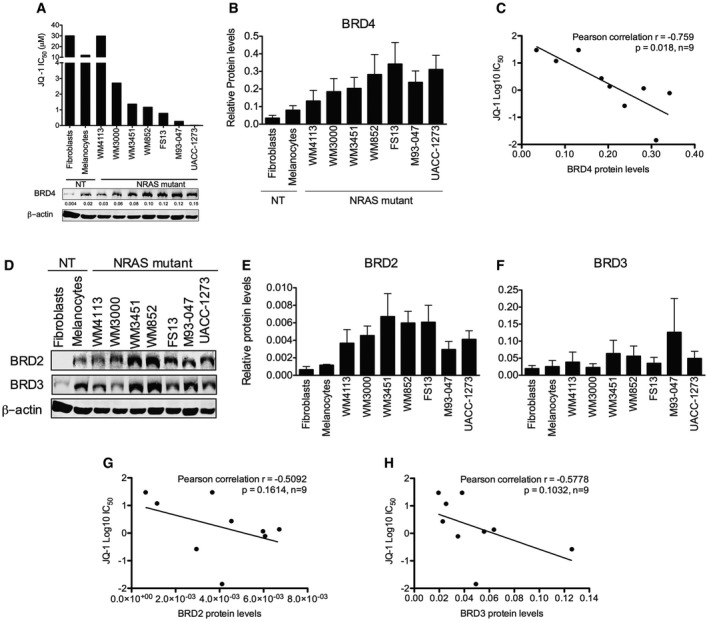
- A
Cells were treated with increasing doses of JQ‐1 for 3 days, and the number of viable cells was determined by MTT assays. Concentrations inhibiting 50% of cell growth (IC50) were calculated at day 3 using GraphPad Prism V5.0a. Bottom panel: Expression of BRD4 was assessed by immunoblotting; β‐actin was used as loading control. Representative Western blot is shown.
- B
Quantification of BRD4 protein levels from immunoblots is shown. Membranes were scanned and quantified using the LI‐COR Odyssey system; average protein levels from three independent experiments ± SEM are depicted in the bar graphs.
- C
Linear correlation between BRD4 protein levels and JQ‐1 IC50 was assessed using Pearson's correlation coefficient. Data analysis was performed using Stata version 13.
- D
Expression of BRD2 and BRD3 was evaluated by Western blot in a panel of NRAS‐mutant melanoma and non‐transformed cell lines.
- E, F
Quantification of BRD2 (E) and BRD3 (F) protein levels from immunoblots is shown. Membranes were scanned and quantified using the LI‐COR Odyssey system; average protein levels from three independent experiments ± SEM are depicted in the bar graphs.
- G, H
Linear correlation between BRD2 (G) and BRD3 (H) protein levels and JQ‐1 IC50 was assessed using Pearson's correlation coefficient. Data analysis was performed using Stata version 13.
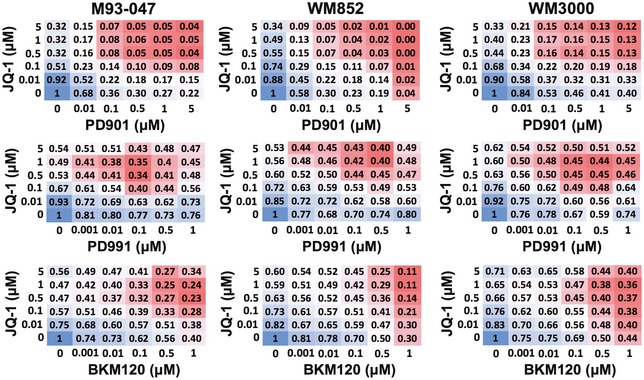
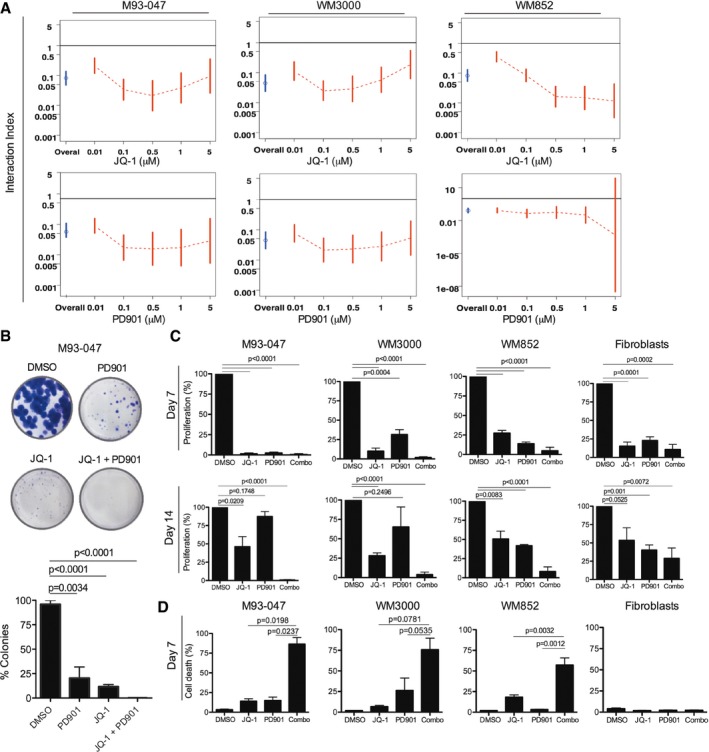
NRAS‐mutant melanoma cells were treated with JQ‐1 alone or in combination with PD901. Cell viability was determined by Alamar Blue assay after 5 days of treatment and calculated relative to DMSO‐treated controls. Interaction index and 95% confidence interval (CI) were assessed for each cell line. The upper limit of its 95% CI < 1 was considered significant synergy.
Cells were cultured in the presence of DMSO, 0.5 μM JQ‐1, 0.1 μM PD901, or combo for 14 days followed by crystal violet staining. Colonies were imaged using a digital camera and quantitated by ImageJ. Representative photographs of crystal violet stained colonies are shown.
Cells were treated with DMSO or a single dose of 0.5 μM JQ‐1, 0.1 μM PD901, or combo. At day 6, cells were washed to remove the drugs and refed fresh (drug‐free) medium. Cells were fixed after 7 or 14 days, stained with crystal violet, and relative number of cells quantified.
NRAS‐mutant melanoma and non‐transformed cells were treated as in (C) for 7 days. Cells were stained with propidium iodide and Annexin V‐FITC and analyzed by FACS; % Annexin V+/PI+ cells are shown.
- A
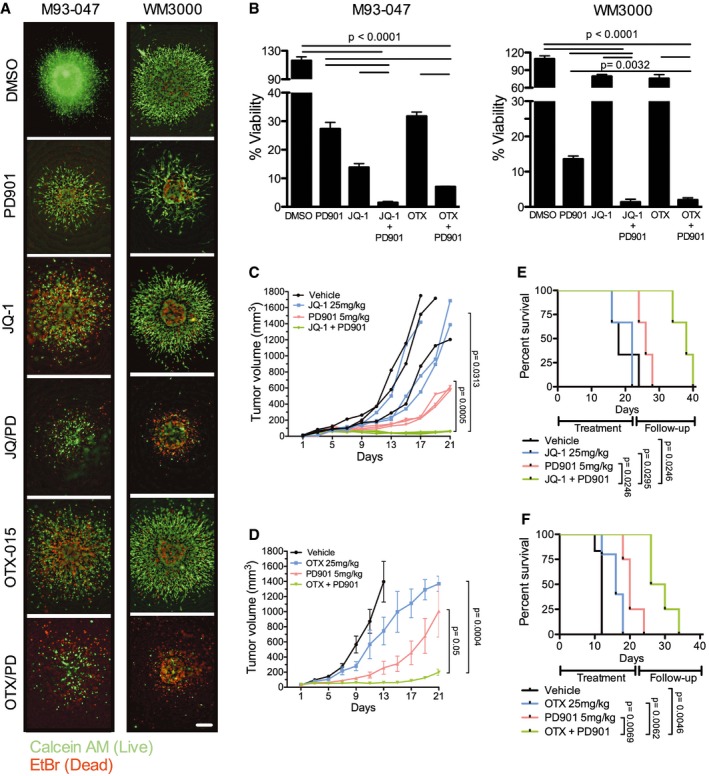
NRAS‐mutant melanoma cells grown as collagen‐embedded 3D spheroids were treated with DMSO, 0.1 μM MEKi PD901, 0.5 μM BETi (JQ‐1 or OTX‐015), or BETi + MEKi combination for 5 days. Spheroids were stained with Calcein (AM) (green; live cells) and EtBr (red; dead cells) and imaged using a fluorescence microscope. Representative images (4×) of three replicates are shown; the scale bar represents 250 μm.
- B
Spheroid viability was determined by Alamar Blue assay after 5 days of treatment. Percent cell viability (%) was calculated relative to DMSO‐treated spheroids. Data represent the average of three independent experiments ± SEM. P‐values were calculated using Student's t‐test.
- C–F
Five‐week‐old NSG mice were injected subcutaneously with 1 × 10⁶ M93‐047 cells. Mice were randomized into four treatment groups: vehicle control, BETi [JQ‐1 (25 mg/kg ip.qd × 21 days) or OTX‐015 (25 mg/kg po.qd × 21 days)], PD901 (5 mg/kg po.qd × 21 days), or combination (C: JQ‐1 + PD901; n = 3 mice/group) (D: OTX‐015 + PD901; n = 8 mice/group). (C, D) Tumor volume was measured by digital caliper and plotted vs. time for each treatment cohort. (E, F) Kaplan–Meir survival curves of mice enrolled in the different treatment groups. Mice were treated for 21 days and followed for up to 40 days or until tumors reached a pre‐defined volume (1,500 mm3). Error bars represent SEM.
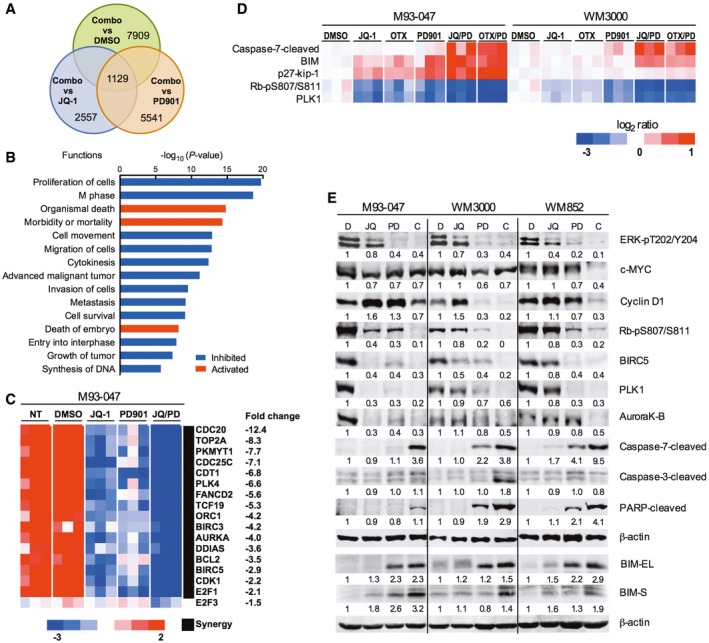
Venn diagram of genes that were up‐ or downregulated after treatment of NRAS‐mutant M93‐047 cells with 0.5 μM JQ‐1, 0.1 μM PD901, or combination (JQ‐1/PD901) for 48 h (P < 0.05, FDR < 5%).
Ingenuity pathway analysis of functions significantly deregulated (P < 0.05) by combination treatment with JQ‐1/PD901 for 48 h.
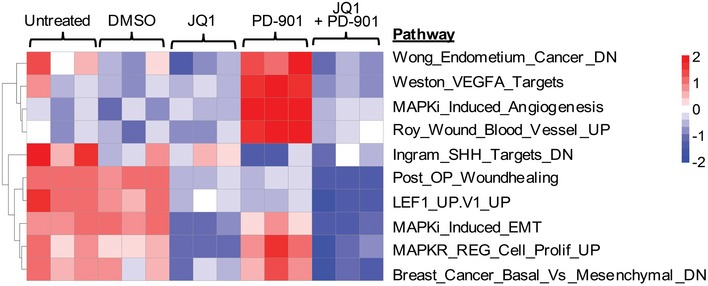
Heat map representation of the common cluster of differentially expressed genes (n = 1,129 genes) from 12 samples treated with DMSO, JQ‐1, PD901, or combination for 48 h.
RPPA was performed in M93‐047 and WM3000 cells treated with BETi (JQ‐1 or OTX) or MEKi PD901 for 48 h as single agents or in combination. Analysis was performed in three biological replicates.
Immunoblotting in a panel of NRAS‐mutant melanoma cells (M93‐047, WM3000, and WM852) treated with vehicle, JQ‐1, PD901, or combination for 48 h.
- A
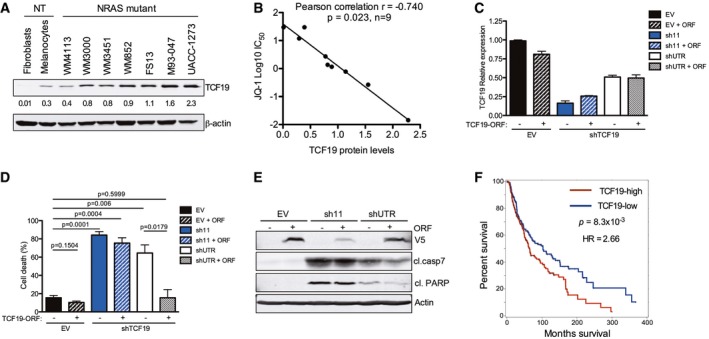
Expression of TCF19 was evaluated by Western blot in a panel of NRAS‐mutant melanoma and non‐transformed cells. Membranes were scanned and quantified using the LI‐COR Odyssey system; β‐actin was used as loading control. Quantification of TCF19 protein levels from immunoblots is shown below each band.
- B
The linear correlation between TCF19 protein levels and JQ‐1 IC50 was assessed using Pearson's correlation coefficient. Data analysis was performed using Stata version 13.
- C–E
TCF19 in NRAS‐mutant WM852 melanoma cells was silenced using two different hairpins (sh11 targets the TCF19 coding region, and shUTR targets the 3′ UTR). EV: empty vector control. ORF: TCF19 open reading frame. (C) RNA was extracted, and mRNA levels were quantified by qRT–PCR. Data shown are the average of three replicates ± SEM. (D) Cell death was analyzed by flow cytometry using Annexin V and propidium Iodide 9 dpi. Percent (%) cell death (Annexin V+/PI+ cells) is shown. Data represent the mean of three independent experiments ± SEM; P‐values were calculated by Student's t‐test. (E) Cell lysates (4 dpi) were analyzed by immunoblotting with the indicated antibodies. Actin was used as loading control; antibodies against V5 were used to detect ectopic TCF19 (V5‐tagged TCF19 ORF).
- F
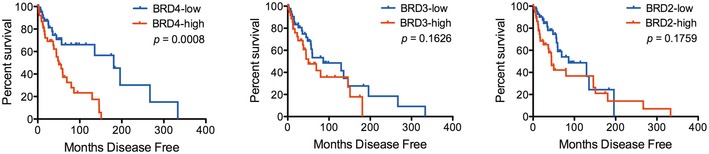
Skin cutaneous melanoma samples (n = 463) from the TCGA database (TCGA, SKMCC Provisional 2017) were stratified into two groups according to the median tissue TCF19 mRNA expression level (TCF19‐low, n = 232 and TCF19‐high, n = 231). Overall survival curves for TCF19 are shown; P‐value and hazard ration (HR) were calculated by Cox regression comparing the two groups.
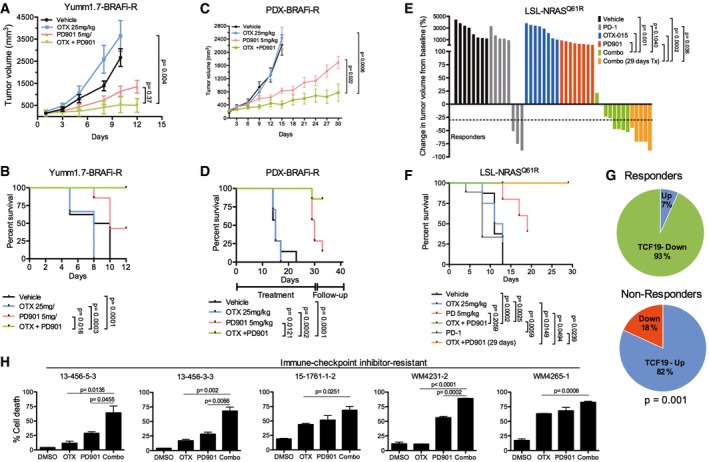
- A, B
BRAFi‐resistant Yumm1.7‐BR syngeneic tumors (n = 8 mice/group). Mice were treated for up to 12 days, treatment withdrawn and mice followed up until tumors reached a pre‐set volume (1,200 mm3). (A) Tumor volume. (B) Kaplan–Meier survival curves.
- C, D
WM3936‐1 BRAFi‐resistant PDX. Mice (n = 8 mice/group) were treated for up to 30 days or until tumors reached a pre‐set volume (1,500 mm3). (C) Tumor volume. (D) Kaplan–Meier survival curves.
- E, F
C57Bl/6 mice (n = 8 mice/group) bearing LSL‐NrasQ61R/Q61R (TpN61R/61R) syngeneic tumors were treated as indicated. Mice were treated for up to 29 days or until tumors reached a pre‐set volume (900 mm3). Mice were given three doses of anti‐PD‐1 (300 μg) every 5 days. (E) Waterfall plot depicting change in tumor volume from baseline for each mouse. Horizontal dashed line indicates 30% decrease in tumor volume. (F) Kaplan–Meier survival curves of mice enrolled in the different treatment groups. Data representative of two independent experiments.
- G
Change in expression levels of TCF19 between pre‐treatment and post‐treatment biopsies was determined in a cohort of 23 patients that were treated with targeted therapy or immunotherapy. Non‐responder patients include patients with progressive disease (n = 11 post‐treatment biopsies from nine patients), and responders include patients with stable disease, partial response, or complete response (n = 15 post‐treatment biopsies from 14 patients).
- H
Short‐term cultures derived from immunotherapy‐resistant patients were treated as indicated for 7 days. Cells were stained with propidium iodide and Annexin V‐FITC and analyzed by FACS; % dead cells (Annexin V+/PI+ cells) are shown.
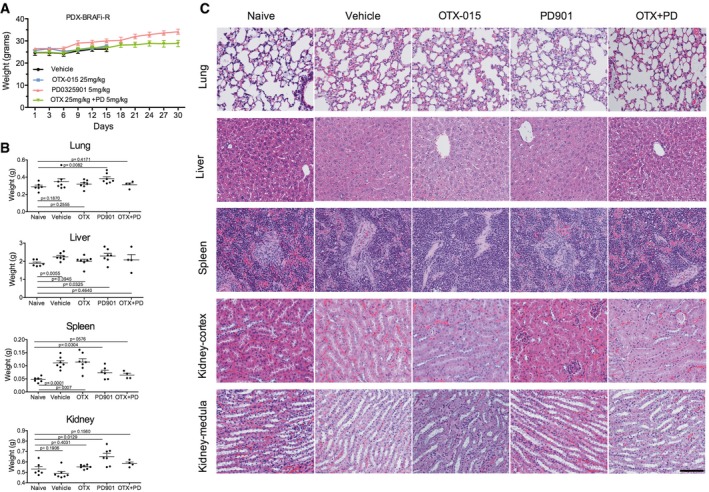
Weight of mice included in the study. Mice were treated with vehicle, OTX‐015 (25 mg/kg po.qd), PD901 (5 mg/kg po.qd), or combination for 30 days.
Weight of organs from mice included in the study.
H&E of the major visceral organs of PDX mice. Magnified (20×) images are shown. Scale bar = 100 μm.
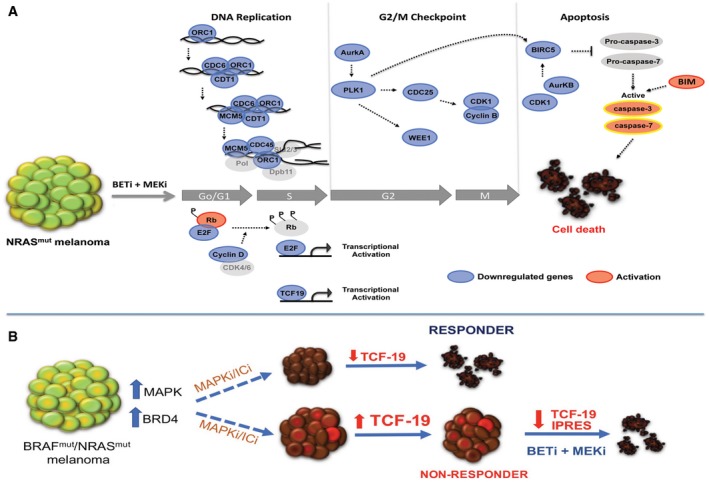
Targeting BET and MEK leads to downregulation of cyclin D, hypo‐phosphorylation of Rb, and inhibition of E2F‐dependent genes required for G1‐S transition. The combination treatment downregulates the pre‐initiation complex (ORC1, Cdc6, Cdt1, MCM5) impairing DNA replication in S phase. Inhibition of the G2/M checkpoint control via synergistic downregulation of Aurora kinase A, Plk1, Cdc25, CDk1, cyclin B, and Wee1 induces cell cycle arrest of NRAS‐mutant melanomas. Repression of PLK1, CDK1, and Aurora kinase B blocks BIRC5, prompting activation of caspase‐3 and caspase‐7. Suppression of TCF19 and increased levels of BIM also contribute to activation of effector caspases and induction of cell death in NRAS‐mutant melanoma cells (Blue: downregulation; Red: activation).
BRAF and/or NRAS‐mutant melanoma are generally treated with MAPK (MAPKi) or immune checkpoint inhibitors (ICi). In responder tumors, TCF19 is downregulated. In non‐responder tumors, TCF19 levels are not affected. Treatment of MAPKi/ICi‐resistant tumors with BETi/MEKi downregulates an anti‐PD1 resistance innate immune signature and TCF19 leading to tumor cell death.
Comment in
-
A novel combination treatment against melanoma with NRAS mutation and therapy resistance.EMBO Mol Med. 2018 May;10(5):e8573. doi: 10.15252/emmm.201708573. EMBO Mol Med. 2018. PMID: 29661909 Free PMC article.
References
-
- Alla V, Engelmann D, Niemetz A, Pahnke J, Schmidt A, Kunz M, Emmrich S, Steder M, Koczan D, Pützer BM (2010) E2F1 in melanoma progression and metastasis. J Natl Cancer Inst 102: 127–133 - PubMed
-
- Amorim S, Stathis A, Gleeson M, Iyengar S, Magarotto V, Leleu X, Morschhauser F, Karlin L, Broussais F, Rezai K et al (2016) Bromodomain inhibitor OTX015 in patients with lymphoma or multiple myeloma: a dose‐escalation, open‐label, pharmacokinetic, phase 1 study. Lancet Haematol 3: e196–e204 - PubMed
-
- Berthon C, Raffoux E, Thomas X, Vey N, Gomez‐Roca C, Yee K, Taussig DC, Rezai K, Roumier C, Herait P et al (2016) Bromodomain inhibitor OTX015 in patients with acute leukaemia: a dose‐escalation, phase 1 study. Lancet Haematol 3: e186–e195 - PubMed
-
- Besaratinia A, Tommasi S (2014) Epigenetics of human melanoma: promises and challenges. J Mol Cell Biol 6: 356–367 - PubMed
Publication types
MeSH terms
Substances
Grants and funding
LinkOut - more resources
Full Text Sources
Other Literature Sources
Medical
Molecular Biology Databases
Miscellaneous
