. 2018 Apr 12;8(1):5865.
doi: 10.1038/s41598-018-24219-z.

A mega-analysis of expression quantitative trait loci (eQTL) provides insight into the regulatory architecture of gene expression variation in liver

Affiliations

A mega-analysis of expression quantitative trait loci (eQTL) provides insight into the regulatory architecture of gene expression variation in liver

Tobias Strunz et al. Sci Rep. .

Abstract

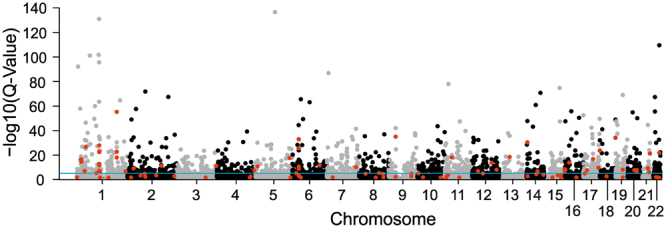
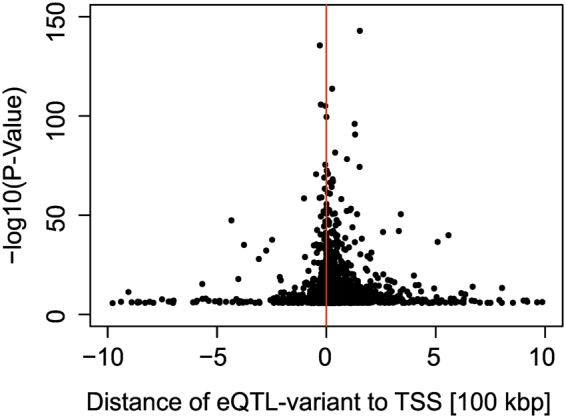
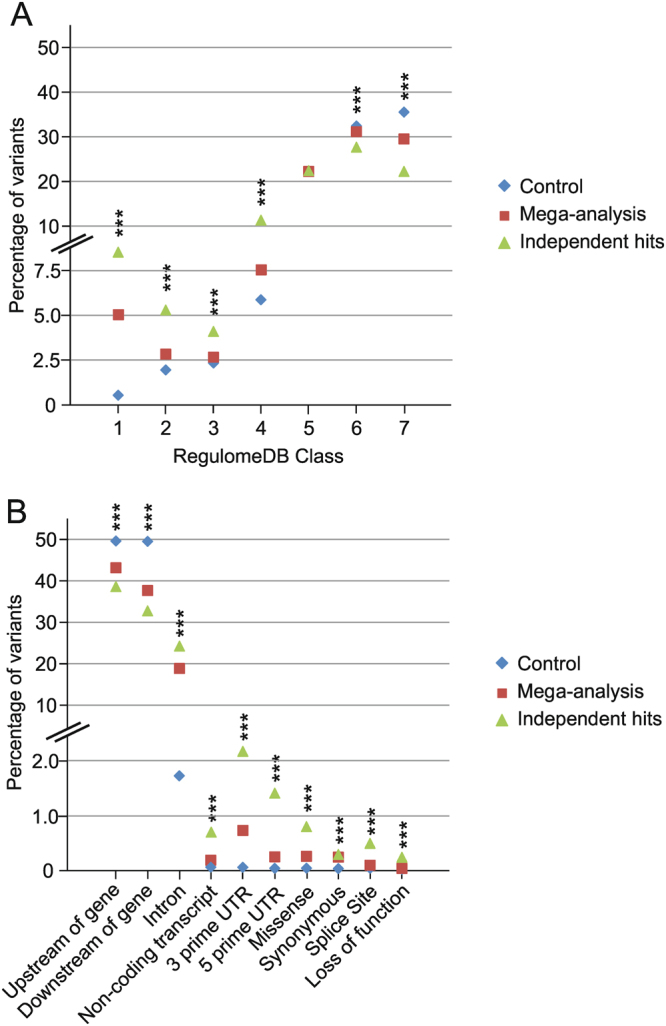
Genome-wide association studies (GWAS) have identified numerous genetic variants in the human genome associated with diseases and traits. Nevertheless, for most loci the causative variant is still unknown. Expression quantitative trait loci (eQTL) in disease relevant tissues is an excellent approach to correlate genetic association with gene expression. While liver is the primary site of gene transcription for two pathways relevant to age-related macular degeneration (AMD), namely the complement system and cholesterol metabolism, we explored the contribution of AMD associated variants to modulate liver gene expression. We extracted publicly available data and computed the largest eQTL data set for liver tissue to date. Genotypes and expression data from all studies underwent rigorous quality control. Subsequently, Matrix eQTL was used to identify significant local eQTL. In total, liver samples from 588 individuals revealed 202,489 significant eQTL variants affecting 1,959 genes (Q-Value < 0.001). In addition, a further 101 independent eQTL signals were identified in 93 of the 1,959 eQTL genes. Importantly, our results independently reinforce the notion that high density lipoprotein metabolism plays a role in AMD pathogenesis. Taken together, our study generated a first comprehensive map reflecting the genetic regulatory landscape of gene expression in liver.


Conflict of interest statement

F.G. and B.H.F.W. declare no competing interest. T.S., J.G., S.N., D.S.-C., C.M., S.F., and E.N., are current or former employees of F. Hoffmann-La Roche Ltd. (Basel, Switzerland). Funding bodies had no influence on data analysis, interpretation or presentation of the results.

Figures

Figure 1
Figure 1
Manhattan plot of the eQTL mega-analysis in liver. A mega-analysis was conducted including 588 samples from four independent studies measuring eQTL variants in liver tissue. The Manhattan plot shows the −log10 Q-Values of the most significant variant for each of the 24,123 analysed autosomal genes. Additionally, 101 independent secondary signals were identified and are highlighted in red. The blue line depicts the threshold for significance at 1 × 10−3.
Figure 2
Figure 2
Characterisation of independent signal eQTL variants based on their genomic localisation. The distance to the nearest transcription start site (TSS) is plotted against the −log10 P-Values of the most significant variant at each eQTL gene, including secondary signals (independent hits). Negative/positive distances denote that the variant is located upstream/downstream of the TSS with regard to the direction of transcription.
Figure 3
Figure 3
Functional annotations and predicted consequences of local eQTL-variants. Three sets of variants were evaluated by employing two different databases. Set one (control) includes random variants of the imputed genotype file, which are located next to at least one gene within a distance of a maximum of 1 Mb. Set two (mega-analysis) consists of all significant mega-analysis (Q-Value < 1 × 10−3) eQTL variants while the third group comprises the most significant variant of each independent hit (including the independent secondary signal variants). (A) The chart depicts the percentage of variants per variant set categorised into seven groups by RegulomeDB. The seven-level functional score is based on a synthesis of data derived from various sources: category 1 variants are very likely to affect binding and are linked to gene expression of a target gene (i.e. are known eQTL variants); categories 2 and 3 are likely to affect at least transcription factor binding and several other regulatory effects; categories 4–6 show minimal functional indication while category 7 variants lack evidence for any functional relevance. (B) The chart shows the percentage of variants classified into ten classes of consequences according to the Ensembl Variant Effect Predictor (VEP). For variant set two (mega-analysis) and three (independent hits) we only included the predicted consequence affecting the identified eQTL gene. For the control group, one random gene within a variant–gene distance of a maximum of 1 Mb was chosen. We selected the most severe effect, if the variant had different effects on transcripts of the same gene. ***P-Value for difference between groups <0.001.

References

    1. Welter D, et al. The NHGRI GWAS Catalog, a curated resource of SNP-trait associations. Nucleic Acids Res. 2014;42:D1001–6. doi: 10.1093/nar/gkt1229. - DOI - PMC - PubMed
    1. Klein RJ, et al. Complement factor H polymorphism in age-related macular degeneration. Science. 2005;308:385–9. doi: 10.1126/science.1109557. - DOI - PMC - PubMed
    1. Fritsche LG, et al. A large genome-wide association study of age-related macular degeneration highlights contributions of rare and common variants. Nat. Genet. 2016;48:134–43. doi: 10.1038/ng.3448. - DOI - PMC - PubMed
    1. Grassmann F, Fauser S, Weber BHF. The genetics of age-related macular degeneration (AMD) – Novel targets for designing treatment options? Eur. J. Pharm. Biopharm. 2015;95:194–202. doi: 10.1016/j.ejpb.2015.04.039. - DOI - PubMed
    1. Weber BHF, et al. The role of the complement system in age-related macular degeneration. Dtsch. Arztebl. Int. 2014;111:133–8. - PMC - PubMed

Publication types