. 2018 Apr 12;8(1):5890.
doi: 10.1038/s41598-018-24280-8.

Impact of sequencing depth on the characterization of the microbiome and resistome

Affiliations

Impact of sequencing depth on the characterization of the microbiome and resistome

Rahat Zaheer et al. Sci Rep. .

Abstract

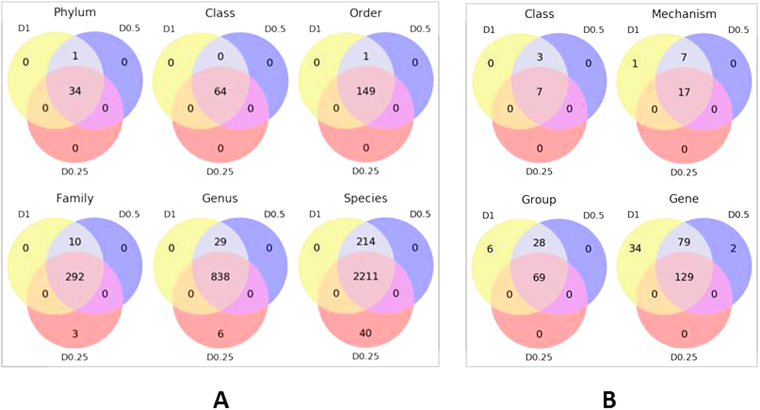
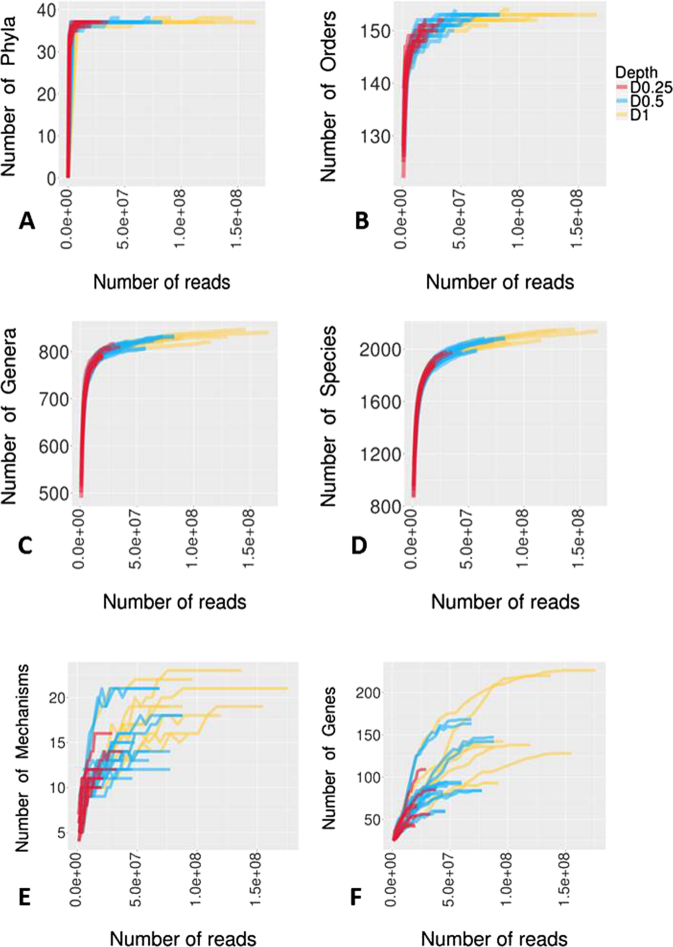
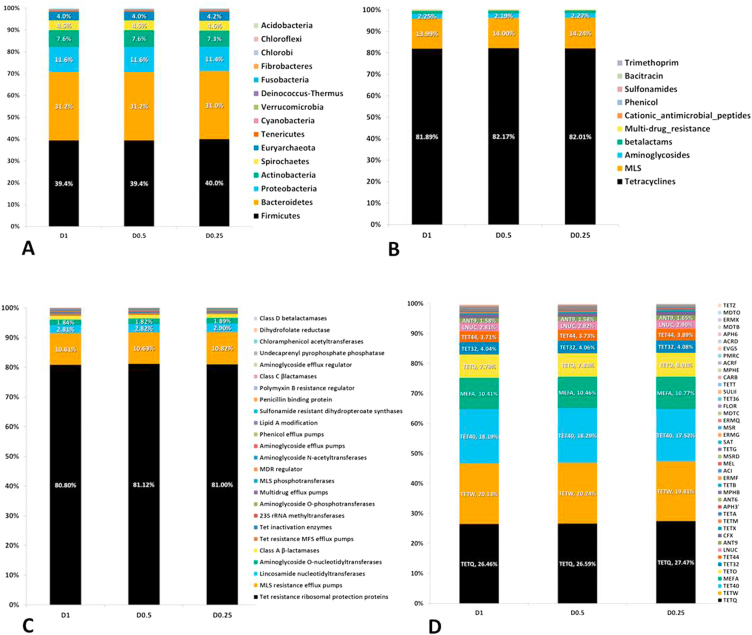
Developments in high-throughput next generation sequencing (NGS) technology have rapidly advanced the understanding of overall microbial ecology as well as occurrence and diversity of specific genes within diverse environments. In the present study, we compared the ability of varying sequencing depths to generate meaningful information about the taxonomic structure and prevalence of antimicrobial resistance genes (ARGs) in the bovine fecal microbial community. Metagenomic sequencing was conducted on eight composite fecal samples originating from four beef cattle feedlots. Metagenomic DNA was sequenced to various depths, D1, D0.5 and D0.25, with average sample read counts of 117, 59 and 26 million, respectively. A comparative analysis of the relative abundance of reads aligning to different phyla and antimicrobial classes indicated that the relative proportions of read assignments remained fairly constant regardless of depth. However, the number of reads being assigned to ARGs as well as to microbial taxa increased significantly with increasing depth. We found a depth of D0.5 was suitable to describe the microbiome and resistome of cattle fecal samples. This study helps define a balance between cost and required sequencing depth to acquire meaningful results.


Conflict of interest statement

The authors declare no competing interests.

Figures

Figure 1
Figure 1
Study design and workflow for sequencing trial to estimate sequencing coverage requirements. Two individual bovine fecal samples were collected from each of the four feedlots (n = 8 total). Two sample pools were created with each pool containing 4 samples (n = 4 × 2 pools). Each pool was run in duplicate in its own sequencing lane to assess technical variation and to provide a doubling dilution (D0.5) of the original material (D1; combined 0.5 duplicates). An additional pool was created containing genomic libraries from all eight samples to create an additional doubling dilution (D0.25) relative to the D0.5 sample pools.
Figure 2
Figure 2
Venn diagrams representing, (A) the intersection of various microbiome taxonomic levels between datasets obtained at D1, D0.5 and D0.25 sequencing depths, and (B) the intersection of various classification levels of the resistome between datasets obtained at D1, D0.5 and D0.25 sequencing depths.
Figure 3
Figure 3
Comparison of microbiome (AD) and resistome (E,F) richness and coverage at different taxon levels in three metagenomic data sets at sequencing depths of D1, D0.5 and D0.25 for all 8 samples using rarefaction curves.
Figure 4
Figure 4
Richness of microbiome and resistome at various sequencing depths. Box-and-whisker plots showing (A) microbial taxon richness, and (B) AMR category richness. Boxes represent the interquartile ranges (upper line is the 75% quantile, and the lower line is the 25% quantile), the lines inside the boxes are the medians, the whiskers span the range of the 25% quantile or the 75% quantile plus 1.5 times the interquartile range, and dots are outliers.
Figure 5
Figure 5
Relative abundance of microbial taxa and AMR annotation levels. Microbial phyla (A), AMR classes (B), AMR mechanisms (C) and AMR gene groups (D) across various sequencing depths of D1, D0.5 and D0.25.

References

    1. Rappé MS, Giovannoni SJ. The uncultured microbial majority. Annu Rev Microbiol. 2003;257:369–94. doi: 10.1146/annurev.micro.57.030502.090759. - DOI - PubMed
    1. Anantharaman K, et al. Thousands of microbial genomes shed light on interconnected biogeochemical processes in an aquifer system. Nat Commun. 2016;7:13219. doi: 10.1038/ncomms13219. - DOI - PMC - PubMed
    1. Adu-Oppong B, Gasparrini AJ, Dantas G. Genomic and functional techniques to mine the microbiome for novel antimicrobials and antimicrobial resistance genes. Ann. NY Acad. Sci. 2017;1388:42–58. doi: 10.1111/nyas.13257. - DOI - PMC - PubMed
    1. Wetterstrand, K. A. DNA sequencing costs: data from the NHGRI Genome Sequencing Program (GSP). genome.gov www.genome.gov/sequencingcostsdata (2016).
    1. Van Schaik W. The human gut resistome. Philosophical Transactions of the Royal Society B: Biological Sciences. 2015;370:20140087. doi: 10.1098/rstb.2014.0087. - DOI - PMC - PubMed

Publication types

MeSH terms