. 2018 Apr 12;9(1):1428.
doi: 10.1038/s41467-018-03811-x.

Gene expression links functional networks across cortex and striatum

Affiliations

Gene expression links functional networks across cortex and striatum

Kevin M Anderson et al. Nat Commun. .

Abstract

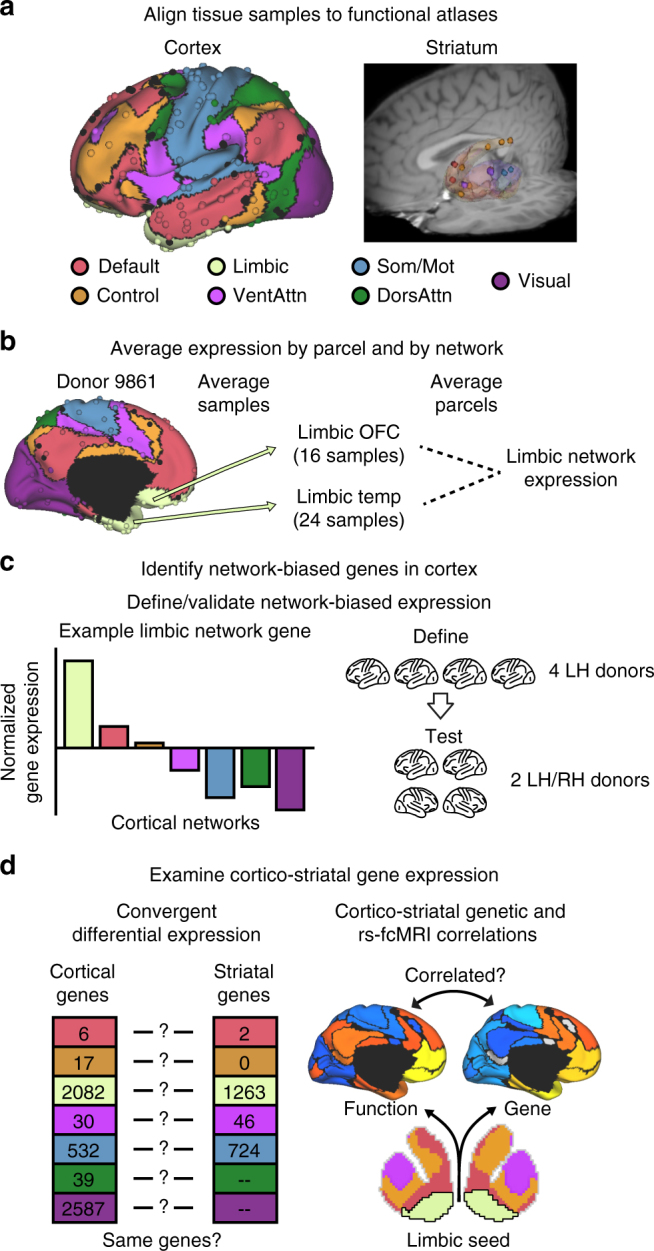
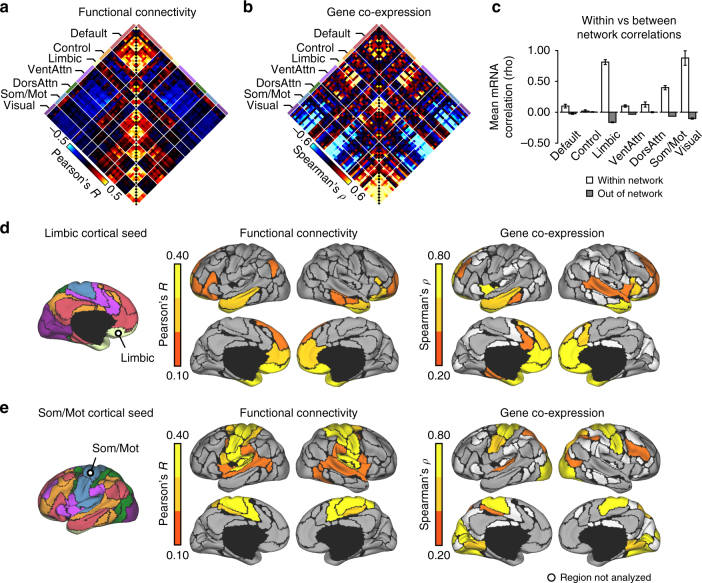
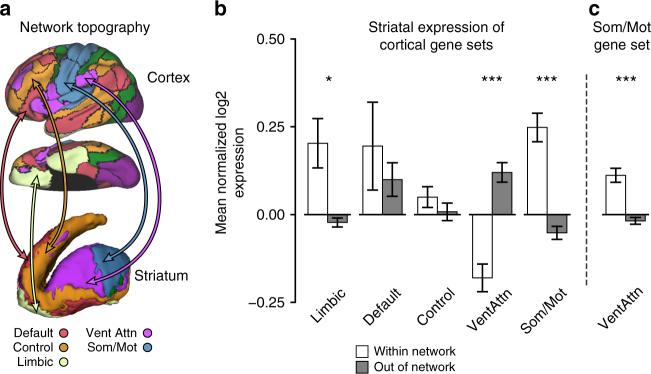
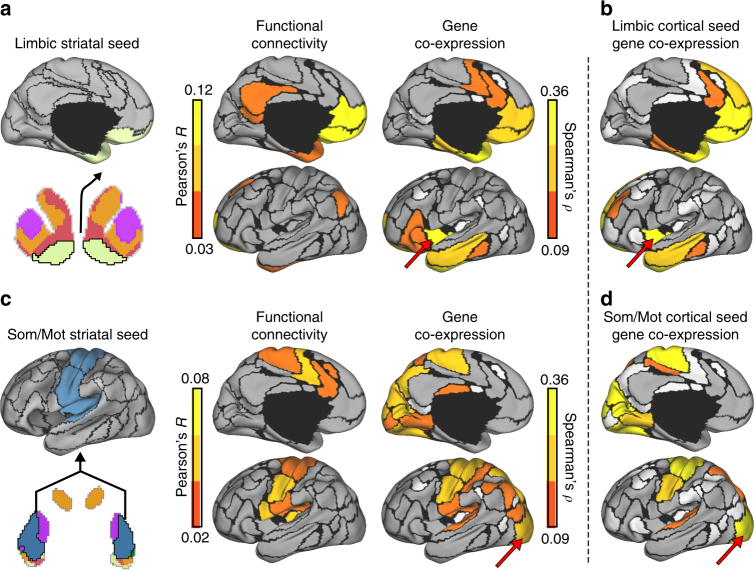
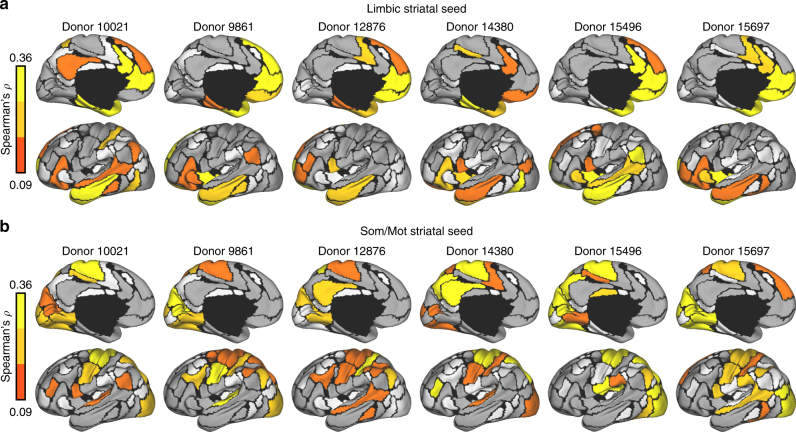
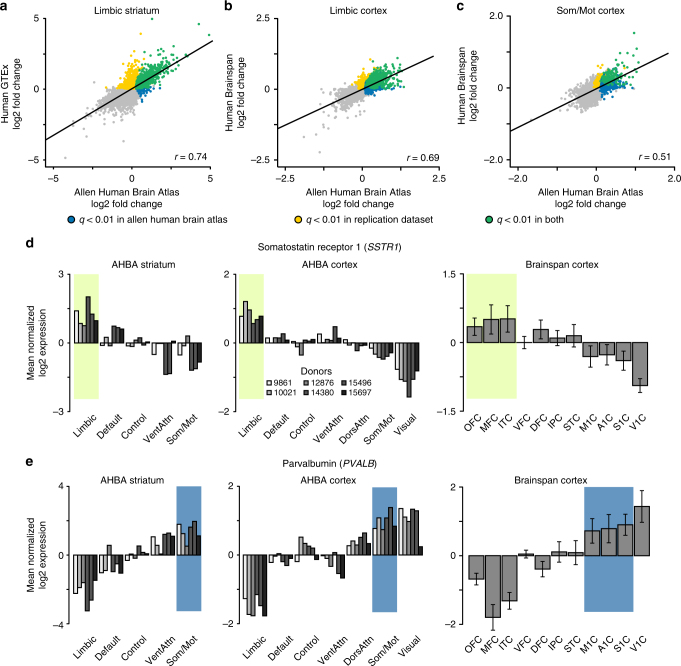
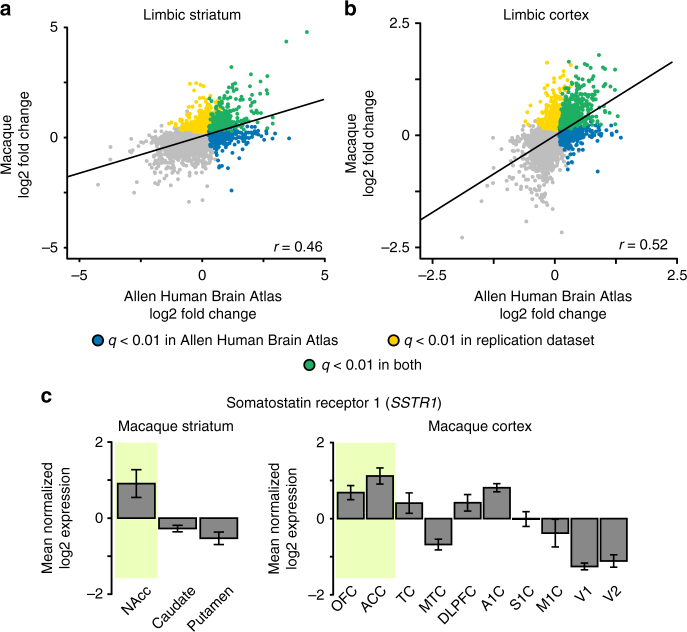
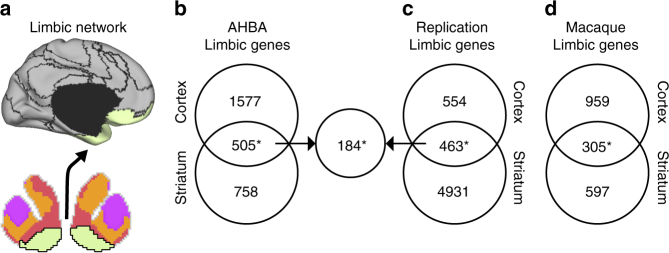
The human brain is comprised of a complex web of functional networks that link anatomically distinct regions. However, the biological mechanisms supporting network organization remain elusive, particularly across cortical and subcortical territories with vastly divergent cellular and molecular properties. Here, using human and primate brain transcriptional atlases, we demonstrate that spatial patterns of gene expression show strong correspondence with limbic and somato/motor cortico-striatal functional networks. Network-associated expression is consistent across independent human datasets and evolutionarily conserved in non-human primates. Genes preferentially expressed within the limbic network (encompassing nucleus accumbens, orbital/ventromedial prefrontal cortex, and temporal pole) relate to risk for psychiatric illness, chloride channel complexes, and markers of somatostatin neurons. Somato/motor associated genes are enriched for oligodendrocytes and markers of parvalbumin neurons. These analyses indicate that parallel cortico-striatal processing channels possess dissociable genetic signatures that recapitulate distributed functional networks, and nominate molecular mechanisms supporting cortico-striatal circuitry in health and disease.


Conflict of interest statement

The authors declare no competing interests.

Figures

Fig. 1
Fig. 1
Characterizing the correspondence between cortico-striatal functional architecture and gene expression. a Individual tissue samples from the Allen Human Brain Atlas were aligned to the cortical functional connectivity atlas of Yeo et al. and the striatal atlas of Choi et al.. Samples were grouped into default, frontoparietal control, limbic, ventral attention, somato/motor, dorsal attention, and visual networks. b For each individual donor, gene expression was averaged according to functional parcel, then by overall network, resulting in a single expression vector for each network in each donor. c Differential expression analyses revealed genes with biased expression across cortical networks. For instance, genes expressed most in tissue samples falling within limbic (cream) network regions relative to all others. Network-biased genes were initially identified in cortex of the four left hemisphere donors and cortico-cortical correlations were examined in the two bi-hemispheric donors. d Network-biased genes were re-defined in the cortex of all six available AHBA donors and were cross-referenced to network-biased genes in the corresponding region of the striatum. The genetic and resting-state functional correlation between each striatal sub-region and each cortical parcel is then calculated and compared
Fig. 2
Fig. 2
Anterior and posterior genetic gradients in the cortex. a Correlation matrix shows fcMRI based coupling for 59 cortical regions (N = 1000) from the 17-network parcellation of Yeo et al., corresponding to cortical areas containing tissue samples from both bi-hemispheric AHBA donors. Regions are arranged such that those belonging to the same functional network are grouped together. Functional network correlations reveal both positive (red) and negative (blue) associations. b Correlation matrix shows the coupling of gene expression across the cerebral cortex, averaged across the two bi-hemispheric AHBA donors. A total of 2664 genes were examined, defined based on differential expression across cortical networks in independent data from 4 left-hemisphere AHBA donors (q ≤ 0.01). c Bar graphs display the gene expression similarity (region-to-region correlation) for parcels within, and out of, the corresponding network territories. Data points reflect the average within and between network correlation values for each bihemispheric donor. Error bars reflect ± 1 SEM. d The average functional and genetic correlation profiles of bilateral limbic OFC seed regions and e bilateral dorsal somato/motor seed regions, displayed across medial and lateral surface representations of the 17-network cortical parcels from Yeo et al.. DorsAttn, dorsal attention; Som/Mot, somato/motor; VentAttn, ventral attention and salience
Fig. 3
Fig. 3
Network-associated genes defined in the cerebral cortex show network-biased expression in the limbic and somato/motor striatum. a Schematic illustrating the network architecture of cortex (above/middle) and striatum (below), displayed on the lateral and ventral surfaces of the left hemisphere and striatum. b Bar graph displays the gene expression (mean-normalized log2) of network-biased genes defined from cortex within, and out of, the corresponding striatal network territories using all six AHBA donors. Striatal tissue samples were not available for the dorsal attention and visual networks. Expression was greater for out of network, than within network, genes for ventral attention striatum. Error bars reflect ± 1 SEM. c Ventral attention aspects of striatum, relative to the rest of the striatum, displayed significantly greater expression of the somato/motor cortical gene set. *p ≤ 0.05, **p ≤ 0.01, ***p ≤ 0.005
Fig. 4
Fig. 4
Functional and genetic cortical correlations of limbic and somato/motor striatal seeds. a The correspondence of fcMRI correlation patterns between the limbic region of striatum with cortex was calculated for the 73 bi-hemispheric cortical parcels using Pearson’s r. Corresponding gene expression correlations were calculated using Spearman’s ρ. Only left-hemisphere maps are displayed (see Supplementary Fig. 4 for unthresholded, bi-hemispheric maps). White denotes regions without samples from at least two donors. Limbic functional and genetic maps were correlated, r = 0.32, p ≤ 0.01. b The cortical gene expression correlations of bilateral limbic OFC (as in Fig. 1d) were associated with the genetic correlation profile of limbic striatum, r = 0.88, p ≤ 0.001. Red arrows highlight an example region where cortico-striatal genetic correlations differ from functional connectivity, but aligns to cortico-cortical genetic correlations of the limbic OFC. c The functional and genetic correlations of the somato/motor striatal seed region. d The cortical gene expression correlations of bilateral dorsal somato/motor cortex (from Fig. 1e) followed the genetic correlation profile of somato/motor striatum, r = 0.92, p ≤ 0.001. Red arrows highlight an example region where cortico-striatal genetic correlations differ from functional connectivity, but aligns to cortico-cortical genetic correlations of the dorsal somato/motor cortex
Fig. 5
Fig. 5
Cortico-striatal genetic correlations are consistent within individual donors. Genes exhibiting differential expression across cortical networks in all six AHBA donors were examined (count = 4912). For each donor, gene expression in the a limbic and b somato/motor striatal regions were correlated to each cortical region for which data was available. White denotes regions for which no data were available. Grey denotes Spearman’s correlations < 0.09
Fig. 6
Fig. 6
Differential expression across cortical and striatal networks is consistent within independent human datasets. a RNAseq data from 111 putamen, 130 NAcc, and 144 caudate tissue samples were obtained from the Genotype-Tissue Expression (GTEx) project. GTEx samples from the NAcc correspond to the limbic aspect of striatum in the AHBA dataset. Across all genes, differential expression (i.e., log2 fold change) in GTEx NAcc, relative to caudate and putamen, co-varied with differential expression in AHBA limbic striatum (r = 0.74, p ≤ 0.001). b RNAseq data for 8 adult donors sampling 11 cortical brain regions were obtained from the Brainspan atlas. Across all genes, fold change in Brainspan limbic cortex (i.e., OFC, ACC, ITC) correlated with fold change in the AHBA limbic cortex (r = 0.69, p ≤ 0.001). c Gene-wise fold change in Brainspan somato/motor cortex (i.e., M1C, S1C, A1C) correlated with fold change in the AHBA somato/motor cortex, r = 0.51, p ≤ 0.001. Gray denotes genes that are not positively differentially expressed. d Somatostatin receptor 1 (SSTR1) was expressed most within limbic cortex and striatum of both AHBA and replication data. e Parvalbumin (PVALB) was expressed most within somato/motor cortex and striatum of both AHBA and replication data. Error bars reflect ± 1 SEM
Fig. 7
Fig. 7
Differential expression in limbic cortical and striatal networks is conserved in non-human primates. a Microarray data from the NAcc, putamen, and caudate of six adolescent and young adult macaque primates were obtained from the NIH Blueprint Non-Human Primate atlas. Gene-wise differential expression (i.e., log2 fold change) in Blueprint non-human primate NAcc, relative to caudate and putamen, was positively correlated to differential expression in human AHBA limbic striatum, r = 0.46, p ≤ 0.001). b Cortical microarray data for six adult macaque primates sampling ten cortical brain regions were obtained from the study by Bernard et al.. Gene-wise log2 fold change in primate limbic cortex (i.e., OFC, ACC) was positively correlated to fold change in the AHBA limbic cortical region, r = 0.52, p ≤ 0.001). c Somatostatin receptor 1 (SSTR1) was expressed most within limbic cortex and striatum of the macaque. Error bars reflect ± 1 SEM
Fig. 8
Fig. 8
Limbic network-biased genes are consistent in independent human and non-human primate datasets. a Schematic illustrating the limbic cortico-striatal network displayed on a bi-hemispheric cross-section of the striatum and the lateral surface of the left hemisphere. b Among the AHBA data, 505 genes displayed overlapping positive differential expression for both limbic striatum and limbic cortex (hypergeometric p ≤ 0.001). c Among the GTEx and Brainspan replication data, 463 genes displayed overlapping positive differential expression for limbic striatum and limbic cortex, 184 of which overlapped with the AHBA limbic network gene set (ps ≤ 0.001). d In macaques, 305 genes displayed overlapping positive differential expression for limbic striatum and limbic cortex, 93 of which overlapped with the AHBA limbic network gene set (ps ≤ 0.001). *p ≤ 0.001

References

    1. Glahn DC, et al. Genetic control over the resting brain. Proc. Natl Acad. Sci. USA. 2010;107:1223–1228. doi: 10.1073/pnas.0909969107. - DOI - PMC - PubMed
    1. Ge T, Holmes AJ, Buckner RL, Smoller JW, Sabuncu MR. Heritability analysis with repeat measurements: application to resting-state functional connectivity. Proc. Natl Acad. Sci. USA. 2017;114:5521–5526. doi: 10.1073/pnas.1700765114. - DOI - PMC - PubMed
    1. Rosenberg MD, et al. A neuromarker of sustained attention from whole-brain functional connectivity. Nat. Neurosci. 2015;19:165–171. doi: 10.1038/nn.4179. - DOI - PMC - PubMed
    1. Buckholtz JW, Meyer-Lindenberg A. Psychopathology and the human connectome: toward a transdiagnostic model of risk for mental illness. Neuron. 2012;74:990–1004. doi: 10.1016/j.neuron.2012.06.002. - DOI - PubMed
    1. Richiardi J, et al. Correlated gene expression supports synchronous activity in brain networks. Science. 2015;348:1241–1244. doi: 10.1126/science.1255905. - DOI - PMC - PubMed

Publication types

MeSH terms