. 2018 Mar 29:12:170.
doi: 10.3389/fnins.2018.00170. eCollection 2018.

Tal1, Gata2a, and Gata3 Have Distinct Functions in the Development of V2b and Cerebrospinal Fluid-Contacting KA Spinal Neurons

Affiliations

Tal1, Gata2a, and Gata3 Have Distinct Functions in the Development of V2b and Cerebrospinal Fluid-Contacting KA Spinal Neurons

Livia A Andrzejczuk et al. Front Neurosci. .

Abstract

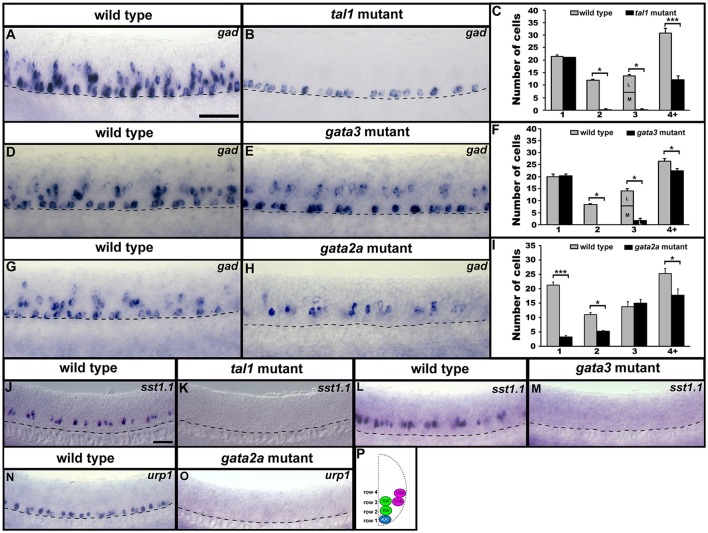
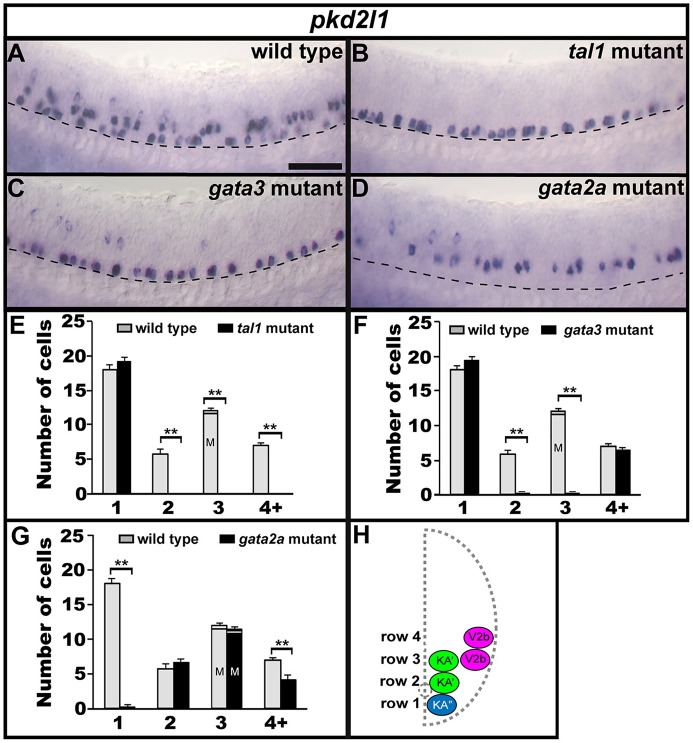
Vertebrate locomotor circuitry contains distinct classes of ventral spinal cord neurons which each have particular functional properties. While we know some of the genes expressed by each of these cell types, we do not yet know how several of these neurons are specified. Here, we investigate the functions of Tal1, Gata2a, and Gata3 transcription factors in the development of two of these populations of neurons with important roles in locomotor circuitry: V2b neurons and cerebrospinal fluid-contacting Kolmer-Agduhr (KA) neurons (also called CSF-cNs). Our data provide the first demonstration, in any vertebrate, that Tal1 and Gata3 are required for correct development of KA and V2b neurons, respectively. We also uncover differences in the genetic regulation of V2b cell development in zebrafish compared to mouse. In addition, we demonstrate that Sox1a and Sox1b are expressed by KA and V2b neurons in zebrafish, which differs from mouse, where Sox1 is expressed by V2c neurons. KA neurons can be divided into ventral KA″ neurons and more dorsal KA' neurons. Consistent with previous morpholino experiments, our mutant data suggest that Tal1 and Gata3 are required in KA' but not KA″ cells, whereas Gata2a is required in KA″ but not KA' cells, even though both of these cell types co-express all three of these transcription factors. In gata2a mutants, cells in the KA″ region of the spinal cord lose expression of most KA″ genes and there is an increase in the number of cells expressing V3 genes, suggesting that Gata2a is required to specify KA″ and repress V3 fates in cells that normally develop into KA″ neurons. On the other hand, our data suggest that Gata3 and Tal1 are both required for KA' neurons to differentiate from progenitor cells. In the KA' region of these mutants, cells no longer express KA' markers and there is an increase in the number of mitotically-active cells. Finally, our data demonstrate that all three of these transcription factors are required for later stages of V2b neuron differentiation and that Gata2a and Tal1 have different functions in V2b development in zebrafish than in mouse.

Keywords: CSF-cN; GABA; V2c; V3; pkd2l1; sox1; tal2; vsx1.


Figures

Figure 1
Figure 1
Spinal expression of tal1 and requirement in KA and V2b neurons. Cross-sectional (A–C) and lateral (D,F,G,I,J,L,M) views of 24 h zebrafish embryos. Dorsal, top; in lateral views, anterior, left. (A) Schematic indicating positions of KA″, KA′, and V2b neurons. (B,C) tal1 expression in KA″ (blue asterisks), KA′ (green asterisks), and V2b (magenta asterisks) cells. (D) Example of counting cells in different dorsal/ventral (D/V) “rows” (see section Materials and Methods). Row 3 contains both medial KA′ cells and lateral V2b cells. V2b cells are also located in row 4 and above. (E,H,K,N) Mean number of cells expressing specific genes in each D/V row of precisely-defined spinal cord region adjacent to somites 6–10. The approximate proportions of medial and lateral row 3 cells are indicated by horizontal lines separating the number of medially-located cells (bottom and indicated with an “M”) from the number of laterally-located cells (top and indicated with a “L”). All of the remaining gata3- and gata2a-expressing cells in row 3 of tal1 mutants were located laterally and were pear shaped, consistent with them being V2b cells, suggesting that no KA′ cells express these genes in tal1 mutants. tal1 and gata3 expression in 24 h WT embryos (E). gata3 (F–H), gata2a (I–K), and tal2 (L–N) expression in WT siblings and tal1 mutants. Dashed lines indicate spinal cord boundary (A–C) or ventral limit of spinal cord (F,G,I,J,L,M). gata2a expression ventral to spinal cord and in dorsal trunk is excluded from cell counts (I). Scale bars (B) = 10 microns (B–D); (F) = 50 microns (F,G,I,J,L,M). All counts were conducted blind to genotype and are an average of at least 4 embryos. Error bars indicate SEM. Statistically significant (p < 0.05) comparisons are indicated with brackets and stars. ***P < 0.001, **P < 0.01, *P < 0.05. P-values are provided in Supplementary Table 3.
Figure 2
Figure 2
Gene expression phenotypes in gata2a, gata3, and tal1 mutants. Summary schematic representation of gene expression phenotypes in gata2a, gata3, and tal1 mutants. Phenotypes are reported for cells in the spinal cord regions where KA″, KA′, and V2b cells normally form. The KA″ region (blue) corresponds to row 1 cells, the KA′ region (green) corresponds to all row 2 plus medial row 3 cells and the V2b region corresponds to lateral row 3 cells plus all row 4 and above cells. White boxes indicate that no cells in that spinal cord region express the gene indicated at top of column, in the mutant indicated in the most left hand column. A box filled with color indicates that there is no change in the number of cells expressing that particular gene in that region. A box partially filled with color indicates a partial reduction in the number of cells expressing the gene. The amount of the box that is white is approximately proportional to the degree of reduction. Information on additional genes that are not expressed in all cell types is provided in the final column.
Figure 3
Figure 3
gata2a, gata3, tal1, and tal2 expression in KA″, KA′, and V2b neurons is differentially regulated by gata3 and gata2a. (A) Cross-sectional schematic indicating positions of KA″, KA′, and V2b neurons. Lateral views of gata2a (B,C), tal1 (E,F,N,O), tal2 (H,I,Q,R), and gata3 (K,L) expression in 24 h WT siblings (B,E,H,J,N,Q) and gata3 (C,F,I) and gata2a (L,O,R) mutants. Dorsal, top; in lateral views, anterior, left. White asterisk in (E) indicates blood expression of tal1. Dashed lines indicate ventral limit of spinal cord. Scale bar = 50 microns. Mean number of cells expressing each gene in each D/V row of spinal cord region adjacent to somites 6–10 (D,G,J,M,P,S). For gata3 mutant results (D,G,J) the approximate proportions of medial and lateral row 3 cells are indicated by horizontal lines separating the number of medially-located cells (bottom and indicated with an “M”) from the number of laterally-located cells (top and indicated with a “L”). All of the remaining gata2a- and tal1-expressing cells in row 3 of gata3 mutants were located laterally, suggesting that they are V2b cells and that no KA′ cells express these genes in gata3 mutants. More dorsal (row 4 and above) cells expressing tal2 in gata3 mutants (I) are more weakly stained than the strongly stained KA″ cells and are in a different focal plane. All counts are an average of at least 4 embryos. Error bars indicate SEM. Statistically significant comparisons are indicated with brackets and stars. ***P < 0.001, **P < 0.01, *P < 0.05. For P-values see Supplementary Table 3.
Figure 4
Figure 4
sox1a and sox1b are co-expressed in KA″, KA′, and V2b cells. Cross-sectional (A–C) and lateral (F–H) views of 24 h WT zebrafish embryos. Dorsal, top; in lateral views, anterior is left. Dashed lines indicate spinal cord boundary (A–C) or ventral limit of the spinal cord (F–H). (A) Schematic indicating positions of KA″, KA′, and V2b neurons. (B) sox1a and (C) sox1b expression in KA″ (blue asterisks), KA′ (green asterisks), and V2b (magenta asterisk) cells. (D) Mean number of cells expressing gata3, sox1a, or sox1b in each D/V row of spinal cord region adjacent to somites 6–10. All counts are an average of at least 5 embryos. Error bars indicate SEM. Statistically significant (P < 0.05) comparisons are indicated with square brackets and stars. ***P < 0.001, **P < 0.01, *P < 0.05. There are no statistically significant differences between the numbers of cells expressing each of these genes in rows 1 and 2. While there are differences in rows 3 and 4, these are small and may reflect slight differences in timing or levels of expression and/or “noise” between different experiments as each gene was analyzed in different embryos. For P-values of all comparisons see Supplementary Table 3. (E) Quantification of single and double-labeled cells from double fluorescent in situ hybridization experiments (F–H). Each column indicates the mean number of cells ±SEM expressing each gene and co-expressing the two genes. Double fluorescent in situ hybridization co-expression experiments showing expression of sox1a (green) and sox1b (red) (F), sox1a (green), and gata3 (red) (G), sox1b (green) and gata3 (red) (H). Bottom row panels are single confocal plane magnified views of the dashed box regions in panels above. White asterisks in (F6,G6,H6) indicate cells co-expressing both genes whereas white crosses indicate single-labeled cells. Dorsal labeling in (F1–H3) is background accumulated from several confocal planes. As labeling is often weaker in double in situ hybridization experiments, cells that are apparently single-labeled may co-express the other gene at levels undetected in these experiments. Consistent with this, slightly fewer cells are labeled with each in situ hybridization probe in the double-labeling experiments than in the single in situ hybridization experiments. In addition, occasional single-labeled cells may result from one of the genes being expressed slightly earlier than the other. Scale bars (B) = 10 microns (B,C); (F1) = 50 microns (F1–H3).
Figure 5
Figure 5
Expression of sox1a and sox1b in tal1, gata3, and gata2a mutants. (A) Cross-sectional schematic indicating positions of KA″, KA′, and V2b neurons. Lateral views of sox1a and sox1b expression in 24 h WT sibling (B,E,H,K,N,Q) and tal1 (C,F), gata3 (I,L), and gata2a (O,R) mutants. Dorsal, top; anterior, left. Dashed lines indicate ventral limit of spinal cord. Scale bar = 50 microns. Mean number of cells expressing sox1a (D,J,P) or sox1b (G,M,S) in each D/V row of spinal cord region adjacent to somites 6–10 in WT and mutant embryos. For tal1 and gata3 mutant results (D,G,J,M) the approximate proportions of medial and lateral row 3 cells are indicated by horizontal lines separating the number of medially-located cells (bottom and indicated with an “M”) from the number of laterally-located cells (top and indicated with a “L”). All of the remaining row 3 cells in these mutants are lateral, consistent with them being V2b cells. All counts are an average of at least 4 embryos. Error bars indicate SEM. Statistically significant comparisons are indicated with brackets and stars. ***P < 0.001, **P < 0.01, *P < 0.05. For P-values see Supplementary Table 3.
Figure 6
Figure 6
Activated caspase3 and Islet1/2 immunohistochemistry and expression of vsx1 in wild type and mutant embryos. Lateral views of 24 h WT sibling and mutant embryos as indicated. Dashed lines mark ventral limit of spinal cord. Dorsal, top; anterior, left. Scale bar = 50 microns. (A–F) Immunohistochemistry for activated Caspase-3. Very few labeled cells are seen in WT or mutant embryos (0–3 cells in a 5 somite-length of spinal cord). (G,H,J,K,M,N) Immunohistochemistry for Islet-1 and Islet-2. The smaller labeled nuclei in the ventral spinal cord correspond to motoneurons. The larger more dorsal nuclei belong to Rohon-Beard cells. Mean numbers of Islet1/2 expressing motoneurons in WT and mutant embryos (I,L,O; see Supplementary Table 6 for P-values). Only ventral cells that correspond to motoneurons were counted. These also have smaller nuclei than more dorsally-located Rohon Beard cells. (P,Q,S,T,V,W) vsx1 expression in V2a neurons. Mean numbers of vsx1-expressing V2a neurons in WT and mutant embryos (R,U,X, see Supplementary Table 6 for P-values). None of the comparisons contained in this figure revealed statistically significant differences.
Figure 7
Figure 7
Neurotransmitter and neuropeptide phenotypes in tal1, gata3, and gata2a mutants. Lateral views of gad, sst1.1, and urp1 expression in 24 h WT sibling (A,D,G,J,L,N) and tal1 (B,K), gata3 (E,M), and gata2a (H,O) mutants. Dorsal, top; anterior, left. Cross-sectional schematic indicating positions of KA″, KA′, and V2b neurons (P). Scale bars (A) = 50 microns (A,B,D,E,G,H); (J) = 50 microns (J–O). Dashed lines indicate ventral limit of spinal cord. Mean number of cells expressing gad in each D/V row of spinal cord region adjacent to somites 6–10 in WT and mutant embryos (C,F,I). For tal1 and gata3 mutant results (C,F) the approximate proportions of medial and lateral row 3 cells are indicated by horizontal lines separating the number of medially-located cells (bottom and indicated with an “M”) from the number of laterally-located cells (top and indicated with a “L”). All of the remaining row 3 cells in these mutants are lateral, consistent with them being V2b cells. More dorsal (row 4 and above) cells expressing gad in tal1 mutants (B) are only weakly stained and are in a different focal plane to the strongly stained KA″ cells, so they are harder to see. All counts are an average of at least 4 embryos. Error bars indicate SEM. Statistically significant comparisons are indicated with brackets and stars. ***P < 0.001, *P < 0.05. For P-values see Supplementary Table 3.
Figure 8
Figure 8
Expression of pkd2l1 in tal1, gata3, and gata2a mutants. Lateral views of pkd2l1 expression in 24 h WT sibling (A) and tal1 (B), gata3 (C), and gata2a (D) mutants. Dorsal, top; anterior, left. Scale bar = 50 microns. Dashed lines indicate ventral limit of spinal cord. The approximate proportions of medial and lateral row 3 cells are indicated by horizontal lines separating the number of medially-located cells (bottom and indicated with an “M”) from the number of laterally-located cells (top and indicated with a “L”). Mean number of cells expressing pkd2l1 in each D/V row of spinal cord region adjacent to somites 6–10 in WT and mutant embryos (E–G). All counts are an average of at least 4 embryos. Error bars indicate SEM. Statistically significant comparisons are indicated with brackets and stars. **P < 0.01. For P-values see Supplementary Table 3. Cross-sectional schematic indicating positions of KA″, KA′, and V2b neurons (H).
Figure 9
Figure 9
Expression of Tg(-8.1gata1:gata1-EGFP) in single and double mutants. Lateral views of 30 h Tg(-8.1gata1:gata1-EGFP) WT sibling (A) and single and double mutants as indicated (B–F). Dorsal, top; anterior, left. Dashed rectangle regions in main panels (A–F) are shown in magnified view in adjacent (A–F) panels. Dashed lines indicate ventral limit of spinal cord. White arrows indicate KA″ axons, magenta arrows indicate KA′ axons and white arrowheads mark V2b axons. KA″ and KA′ axons are ipsilateral and ascending whereas V2b axons are ipsilateral descending. KA″ neurons appear to form normally and extend WT-like axonal projections in tal1;gata3 double mutants (E,E). In contrast, even though GFP-expressing V2b cells are present in both gata3 (C,C) and gata2a (D,D) single mutants there are no GFP-expressing V2b cells in gata2a;gata3 double mutants (F,F). Scale bar = 50 microns.
Figure 10
Figure 10
gad and pkd2l1 expression in double mutant embryos. Lateral views of gad (A–C) or pkd2l1 (F,G) expression in 24 h WT sibling and double mutant embryos as indicated. Dorsal, top; anterior, left. Scale bar = 50 microns. Dashed lines indicate ventral limit of spinal cord. The approximate proportions of medial and lateral row 3 cells are indicated by horizontal lines separating the number of medially-located cells (bottom and indicated where there is space with an “M”) from the number of laterally-located cells (top and indicated where there is space with a “L”). Mean number of cells expressing gad or pkd2l1 in each D/V row of precisely-defined spinal cord region adjacent to somites 6–10 in WT and single and double mutant embryos (D,E,H). All counts are an average of at least 4 embryos. Error bars indicate SEM. Statistically significant comparisons are indicated with brackets and stars. ***P < 0.001, **P < 0.01, *P < 0.05. In (E), there is no statistically significant difference between any row 1 values or between tal1 single mutants and tal1;gata3 double mutants in row 4+. In (H), there is no statistically significant difference between any row 1 values. For P-values see Supplementary Table 3. Cross-sectional schematic indicating positions of KA″, KA′, and V2b neurons (I).
Figure 11
Figure 11
Expression of slc17a6a/b and sim1a in mutant embryos. Lateral views of slc17a6a/b (vglut) (A,B,D,E,G,H,J,K), slc17a6a/b (green) and sox1b (red) (M), and sim1a (N,O,Q,R) expression in WT sibling and mutant embryos as indicated. Dorsal, top; anterior, left. All embryos are 24 h except (M,Q,R), which are 32 h. Arrowheads indicate glutamatergic cells (H,J,K) or sim1a-expressing cells (N,O) in the KA″ region. Scale bar = 50 microns. Dashed lines indicate ventral limit of spinal cord. White boxes in (M) are single confocal magnified views of dotted white box. White stars indicate double-labeled cells. Mean number of cells expressing these genes in spinal cord region adjacent to somites 6–10 in WT and mutant embryos (C,F,I,L,P,S). Panels (C,F,I,P,S) show counts for all dorsal-ventral rows. Panel (L) shows counts for just row 1 and hence, the value for WT embryos is zero. All counts are an average of at least 4 embryos. Error bars indicate SEM. Statistically significant comparisons are indicated with brackets and stars. ***P < 0.001, *P < 0.05. For P-values see Supplementary Table 6.
Figure 12
Figure 12
Phospho-histone H3 (pH3) immunohistochemistry in tal1, gata3, and gata2a mutants. Lateral views of pH3 (red) and GFP (green) immunohistochemistry in 24 h Tg(-8.1gata1:gata1-EGFP) WT sibling and mutant embryos as indicated (A,B,D,E,G,H). Top panel (1) in each case shows just the red channel and bottom panel (2) shows the merged image of both green and red channels. Tg(-8.1gata1:gata1-EGFP) embryos were used to help orientate to particular rows/cell type regions in the ventral spinal cord. Dorsal, top; anterior, left. Scale bar = 50 microns. Dashed lines indicate ventral limit of spinal cord. Mean number of pH3-positive cells in each D/V row of spinal cord region adjacent to somites 6–10 in WT and mutant embryos (C,F,I). All counts are an average of at least 3 embryos. Cell rows were assigned based on average cell diameters. Error bars indicate SEM. Statistically significant comparisons are indicated with brackets and stars. *P < 0.05, **P < 0.01. For P-values see Supplementary Table 6.
Figure 13
Figure 13
Expression of pH3 and either olig2 or Nkx6.1 in tal1 and gata3 mutants. Lateral (A,B,F,G,K,L) and cross-sectional (C,D,H,I,M,N) views of pH3 (red) and either olig2 or Nkx6.1 (green) expression in WT embryos (A,C,F,H,K,M), gata3 mutants (B,D,L,N), or tal1 mutants (G,I) at 24 h. Dorsal, top; in lateral views, anterior, left. White boxes in top right hand corners of lateral views are single confocal plane magnified views of the area indicated with a white dotted box. White stars indicate double-labeled cells. White dashed lines indicate the ventral limit of the spinal cord (lateral views) or the boundary of the spinal cord (cross-sections). For lateral views, single channel and merged images are shown. Scale bar = 50 microns. Mean number of pH3-positive; olig2-negative cells (E1,J1) and pH3-positive; olig2-positive cells (E2,J2) adjacent to somites 6–10 in WT and mutant embryos. Mean number of pH3-positive; Nkx6.1-negative cells (O1) and pH3-positive; Nkx6.1-positive cells (O2) adjacent to somites 6–10 in WT and mutant embryos. All counts are an average of at least 3 embryos. Cell rows were assigned based on average cell diameters. Error bars indicate SEM. Statistically significant comparisons are indicated with brackets and stars. *P < 0.05. For P-values see Supplementary Table 6.

References

    1. Abràmoff M. D., Magalhães P. J., Ram S. J. (2004). Image processing with imageJ. Biophoton. Int. 11, 36–41.
    1. Agduhr E. (1922). Über ein Zentrales Sinnesorgan bei den Vertebraten. Z. Anat. Entwicklungs 66, 223–360. 10.1007/BF02593586 - DOI
    1. Al-Mosawie A., Wilson J. M., Brownstone R. M. (2007). Heterogeneity of V2-derived interneurons in the adult mouse spinal cord. Eur. J. Neurosci. 26, 3003–3015. 10.1111/j.1460-9568.2007.05907.x - DOI - PubMed
    1. Armant O., Marz M., Schmidt R., Ferg M., Diotel N., Ertzer R., et al. (2013). Genome-wide, whole mount in situ analysis of transcriptional regulators in zebrafish embryos. Dev. Biol. 380, 351–362. 10.1016/j.ydbio.2013.05.006 - DOI - PMC - PubMed
    1. Barber R. P., Vaughn J. E., Roberts E. (1982). The cytoarchitecture of GABAergic neurons in rat spinal cord. Brain Res. 238, 305–328. 10.1016/0006-8993(82)90107-X - DOI - PubMed

LinkOut - more resources