Case Reports
. 2018 Mar 29:9:588.
doi: 10.3389/fimmu.2018.00588. eCollection 2018.

CEBPE-Mutant Specific Granule Deficiency Correlates With Aberrant Granule Organization and Substantial Proteome Alterations in Neutrophils

Affiliations
Case Reports

CEBPE-Mutant Specific Granule Deficiency Correlates With Aberrant Granule Organization and Substantial Proteome Alterations in Neutrophils

Nina K Serwas et al. Front Immunol. .

Abstract

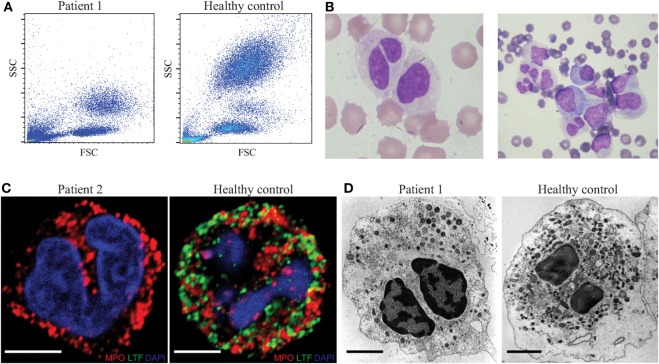
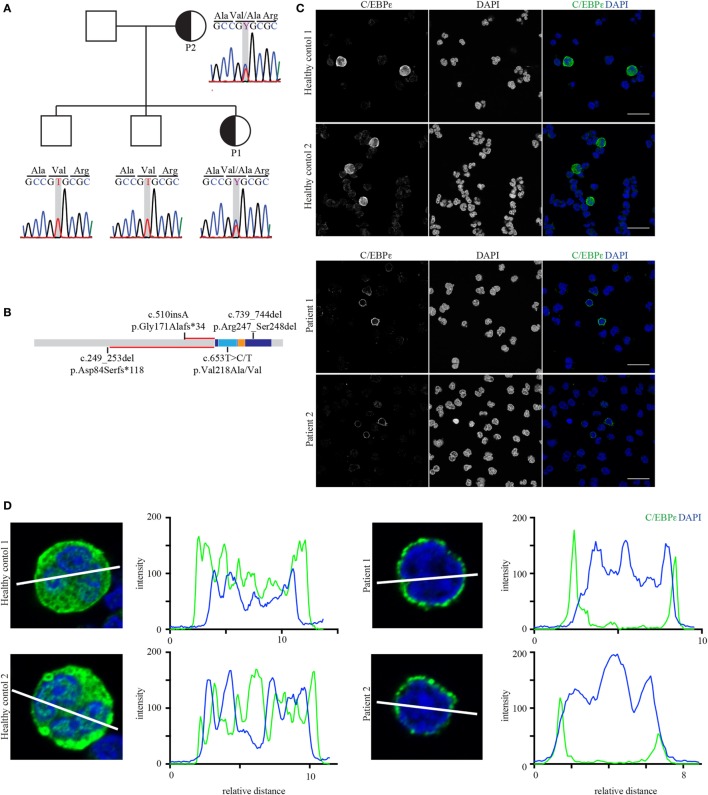
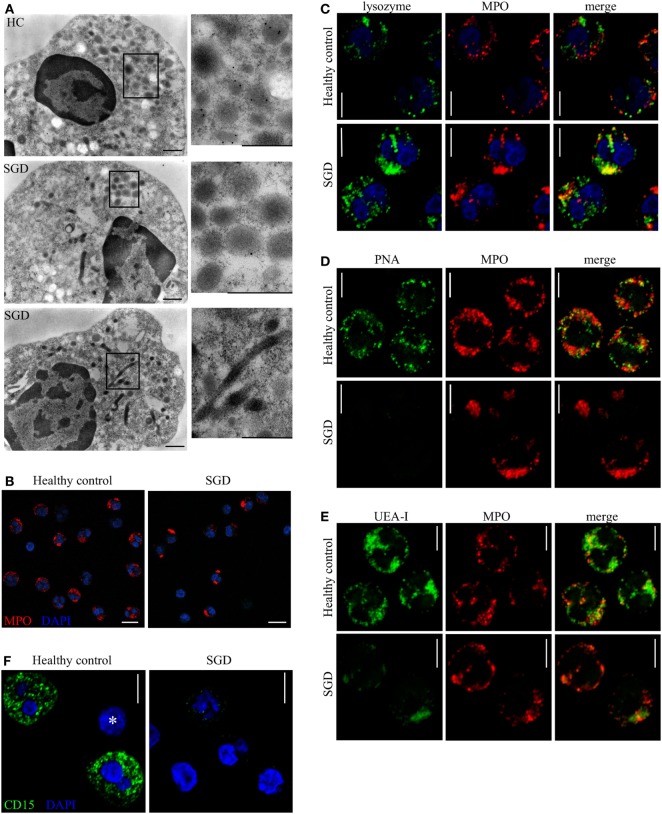
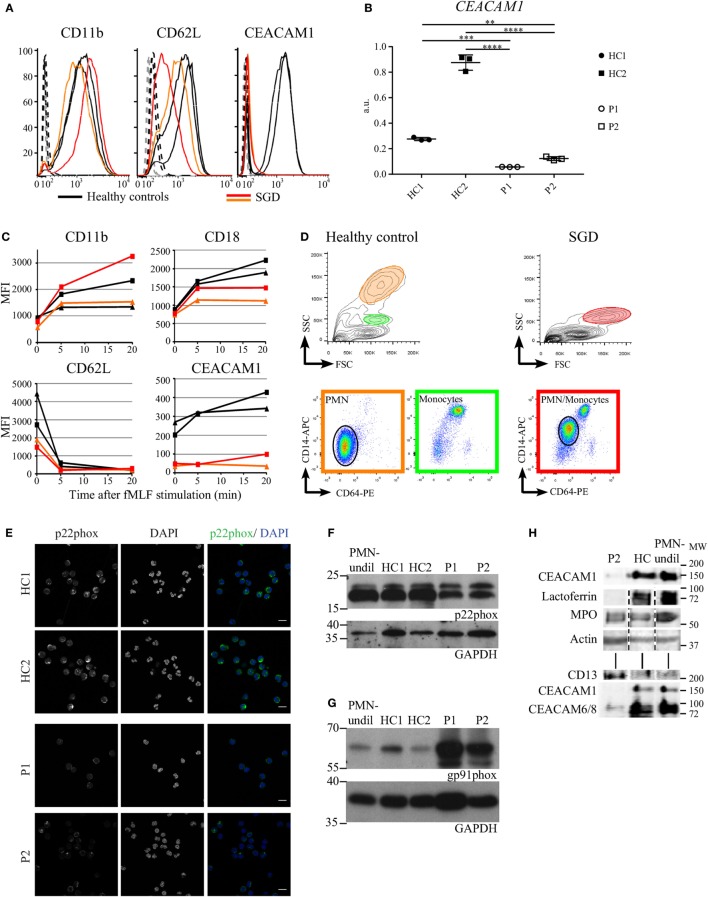
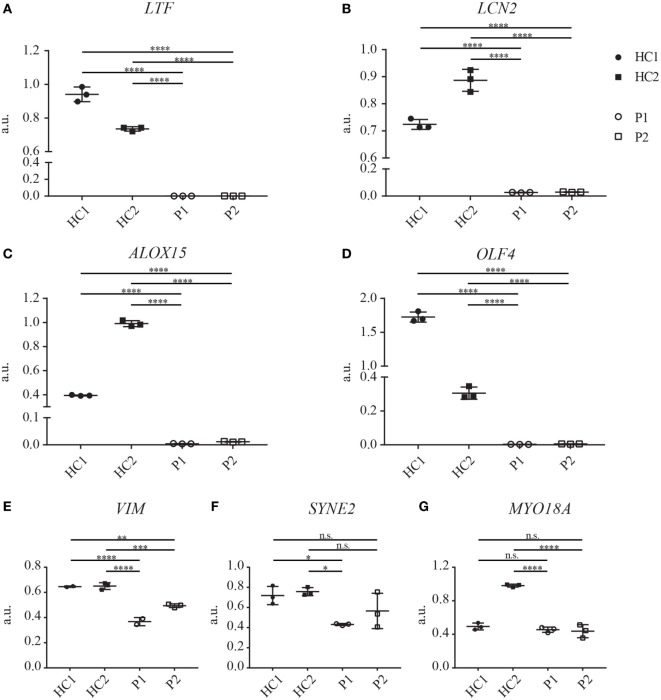
Specific granule deficiency (SGD) is a rare disorder characterized by abnormal neutrophils evidenced by reduced granules, absence of granule proteins, and atypical bilobed nuclei. Mutations in CCAAT/enhancer-binding protein-ε (CEBPE) are one molecular etiology of the disease. Although C/EBPε has been studied extensively, the impact of CEBPE mutations on neutrophil biology remains elusive. Here, we identified two SGD patients bearing a previously described heterozygous mutation (p.Val218Ala) in CEBPE. We took this rare opportunity to characterize SGD neutrophils in terms of granule distribution and protein content. Granules of patient neutrophils were clustered and polarized, suggesting that not only absence of specific granules but also defects affecting other granules contribute to the phenotype. Our analysis showed that remaining granules displayed mixed protein content and lacked several glycoepitopes. To further elucidate the impact of mutant CEBPE, we performed detailed proteomic analysis of SGD neutrophils. Beside an absence of several granule proteins in patient cells, we observed increased expression of members of the linker of nucleoskeleton and cytoskeleton complex (nesprin-2, vimentin, and lamin-B2), which control nuclear shape. This suggests that absence of these proteins in healthy individuals might be responsible for segmented shapes of neutrophilic nuclei. We further show that the heterozygous mutation p.Val218Ala in CEBPE causes SGD through prevention of nuclear localization of the protein product. In conclusion, we uncover that absence of nuclear C/EBPε impacts on spatiotemporal expression and subsequent distribution of several granule proteins and further on expression of proteins controlling nuclear shape.

Keywords: C/EBPε; granule organization; neutrophil granulocytes; primary immunodeficiency; specific granule deficiency.


Figures

Figure 1
Figure 1
Characteristic aberrations in neutrophil granulocytes from patients with specific granule deficiency. (A) Forward/sideward scatter of whole blood after erythrocyte lysis. (B) Hematoxylin/eosin staining of peripheral blood smear (left) and bone marrow aspirate (right) of the patient. (C) Immunofluorescence analysis of myeloperoxidase (MPO, red) and lactoferrin (LTF, green) in the neutrophils of patient (left) and healthy donor (right), scale bar: 5 µm. (D) Analysis of patient (left) and healthy control (right) neutrophils in transmission electron microscopy; scale bar: 2 μm.
Figure 2
Figure 2
The affected mother and child both carry the heterozygous mutation p.Val218Ala in CEBPE. (A) Sanger chromatograms of the core pedigree covering the mutated nucleotide (framed gray) in CEBPE. (B) Protein model including domain structure of C/EBPε (basic leucine zipper: dark blue; basic subunit: light blue; and leucine zipper: orange) showing the relative location of the identified mutation in relation to the homozygous frameshift mutations. The length of the altered reading frames is indicated in red. (C) Confocal images of healthy control and patient granulocytes stained for C/EBPε (green, scale bar: 20 µm). Stains were performed in triplicates. (D) Line graphs of C/EBPε and DAPI show that in patients’ cells the center of the nucleus lacks C/EBPε which rather localizes to the perinuclear region (blots were done with ImageJ).
Figure 3
Figure 3
Granule distribution, protein content, and glycosylation pattern of neutrophil granules are modified in specific granule deficiency (SGD). (A) Immunoelectron microscopy shows presence of lactoferrin (15 nm gold particles) in secondary granules in healthy controls (HCs, upper panel) and its absence in two SGD patients (two lower panels). Elongated sacs as well as aggregates of granules are observed in SGD but not in HCs (see zoomed in panels). Scale bars: 500 nm. (B) MPO-containing granules (red) are aggregated and polarized in SGD compared with HCs as shown by confocal immunofluorescence. Scale bar: 10 µm. (C) Lysozyme (green) co-localizes with MPO (red) in neutrophils of SGD patients (lower panel) but not of HCs (upper panel). (D,E) Different populations of granules are recognized specifically by the lectins (green) peanut agglutinin (PNA) (D) and UEA-I (E) in HCs (upper panel), displaying, respectively, no or partial co-localization with MPO (red). The granules in SGD neutrophils (lower panel) are not recognized by PNA (D) and react weakly with Ulex europaeus agglutinin I (UEA-I) (E) compared with HCs. (F) The anti-CD15 (green) staining is reduced in neutrophils of SGD patients (right) compared with healthy donor (left). No staining is visible in a lymphocyte in the healthy donor (asterisk). Scale bars (C–F): 5 µm.
Figure 4
Figure 4
Targeted analysis of the expression of surface and granule proteins in neutrophils of specific granule deficiency (SGD) patients (A). Total protein levels of CD62L, CD11b, and CEACAM1 measured by flow cytometry in fixed and permeabilized myeloid cells in P1 (red) and P2 (orange) affected by SGD compared with two healthy controls (HCs) (black). The isotype controls for the SGD and normal cells are displayed as dashed black and gray curves, respectively. (B) CEACAM1 transcript levels in neutrophils were assessed in both patients (P1 and P2) and two HCs (HC1, shipment control; HC2, local control) and revealed a significant reduction of transcript levels as tested with one-way ANOVA (Bonferroni corrected for multiple testing, normalization to HPRT1 expression, three biological replicates shown). (C) Changes in mean fluorescence intensity (MFI) induced by fMLF stimulation (5 nM for 5 or 20 min) on the surface of live myeloid cells in P1 (red) and P2 (orange) affected by SGD compared with two HCs (black). As the monocytes and polymorphonuclear cell populations cannot be separated on the FSC/SSC channels in the SGD sample, the MFI is calculated as an average of both cell populations. (D) Elevated surface expression of CD14 and CD64 in live polymorphonuclear cells (PMNs) in SGD (right) compared with HCs (left). In the upper FSC/SSC panels, PMN (orange circle) and monocyte (green circle) populations are visible in the HCs, but these populations cannot be unmixed in the SGD sample (red circle). In the lower panel, the CD64-PE/CD14-APC stain distinguishes the monocytic CD64high/CD14high population (green panel) from the PMN CD64low/CD14low (orange panel, black circle). These populations are found back in SGD (red panel), and a PMN population is identifiable (black circle). The expression of both CD64 and CD14 is clearly higher in the PMN population in SGD versus healthy donors. (E) Immunofluorescence analysis of p22phox (green) in neutrophils of patients (P1, P2) and healthy controls (HCs) (HC1, local control; HC2, shipment control). Scale bar: 10 µm. (F,G) Analysis of p22phox (F) and gp91phox (G) by Western blot. (H) The amount of specific granule markers in a total cell lysate was compared by immunoblotting. The signal for actin serves as a loading control. The SGD and HC fractions were enriched for PMNs on a modified Ficoll gradient, and erythrocytes were removed by lysis as described. The PMN fraction contains >98% PMNs, separated on a Polymorphprep gradient.
Figure 5
Figure 5
mRNA expression of several granule proteins in neutrophils of specific granule deficiency patients is reduced. (A–G) Transcript analysis of LTF (A), LCN2 (B), ALOX15 (C), OLF4 (D), VIM (E), SYNE2 (F), and MYO18A (G) on neutrophils of both patients (P1 and P2) and two healthy controls (HC1, shipment control; HC2, local control, three biological replicates shown). Gene expression was normalized to HPRT1 expression. Significance levels were determined with one-way ANOVA (Bonferroni corrected for multiple testing).

References

    1. Borregaard N. Neutrophils, from marrow to microbes. Immunity (2010) 33:657–70. 10.1016/j.immuni.2010.11.011 - DOI - PubMed
    1. Borregaard N, Theilgaard-Monch K, Sorensen OE, Cowland JB. Regulation of human neutrophil granule protein expression. Curr Opin Hematol (2001) 8:23–7. 10.1097/00062752-200101000-00005 - DOI - PubMed
    1. Lominadze G, Powell DW, Luerman GC, Link AJ, Ward RA, Mcleish KR. Proteomic analysis of human neutrophil granules. Mol Cell Proteomics (2005) 4:1503–21. 10.1074/mcp.M500143-MCP200 - DOI - PubMed
    1. Rorvig S, Ostergaard O, Heegaard NH, Borregaard N. Proteome profiling of human neutrophil granule subsets, secretory vesicles, and cell membrane: correlation with transcriptome profiling of neutrophil precursors. J Leukoc Biol (2013) 94:711–21. 10.1189/jlb.1212619 - DOI - PubMed
    1. Boxer LA. How to approach neutropenia. Hematology Am Soc Hematol Educ Program (2012) 2012:174–82. 10.1182/asheducation-2012.1.174 - DOI - PubMed

Publication types

MeSH terms

Supplementary concepts

LinkOut - more resources