

Association Mapping for Important Agronomic Traits in Safflower (Carthamus tinctorius L.) Core Collection Using Microsatellite Markers
- PMID: 29651296
- PMCID: PMC5885069
- DOI: 10.3389/fpls.2018.00402
Association Mapping for Important Agronomic Traits in Safflower (Carthamus tinctorius L.) Core Collection Using Microsatellite Markers
Abstract
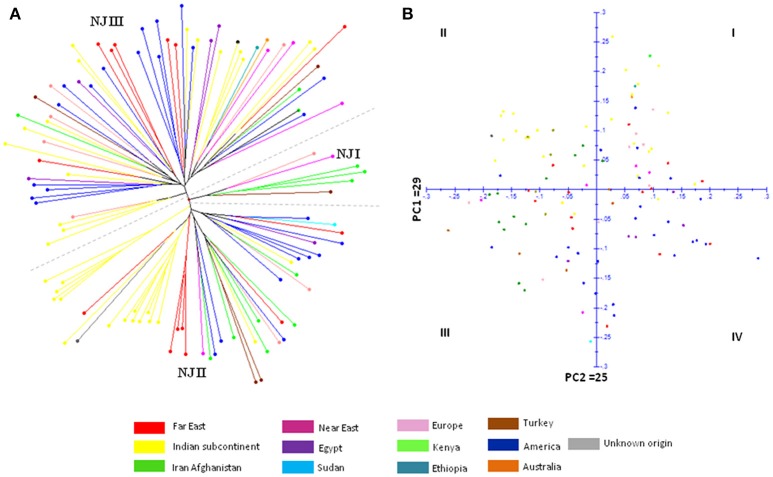
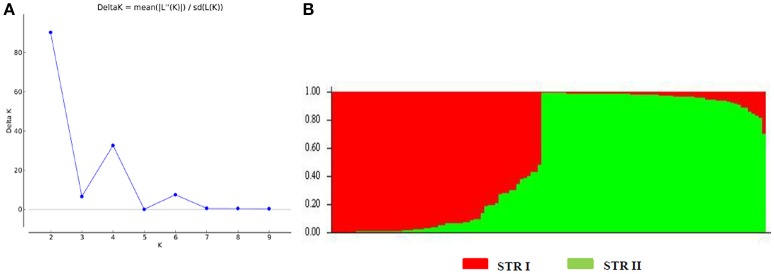
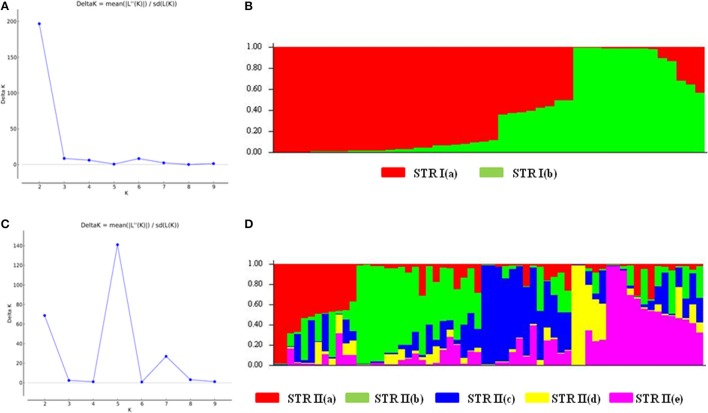
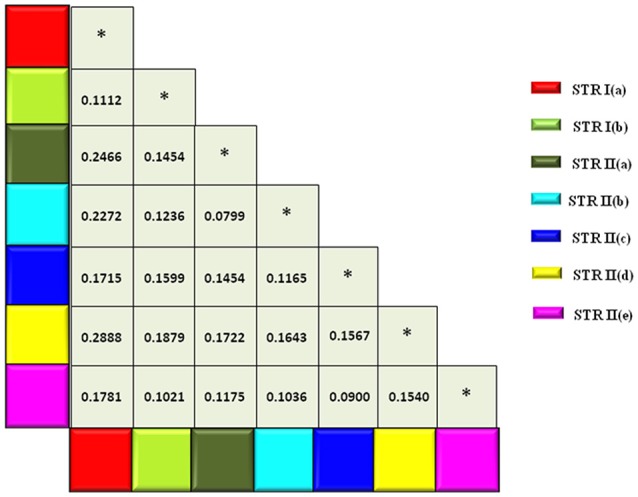
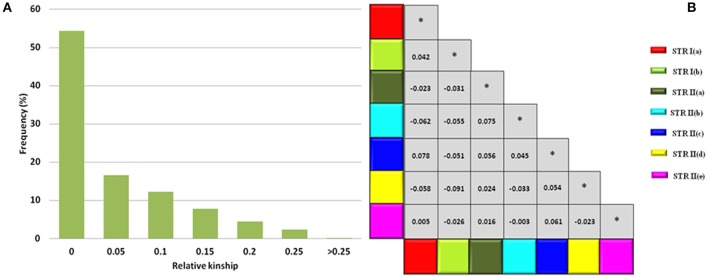
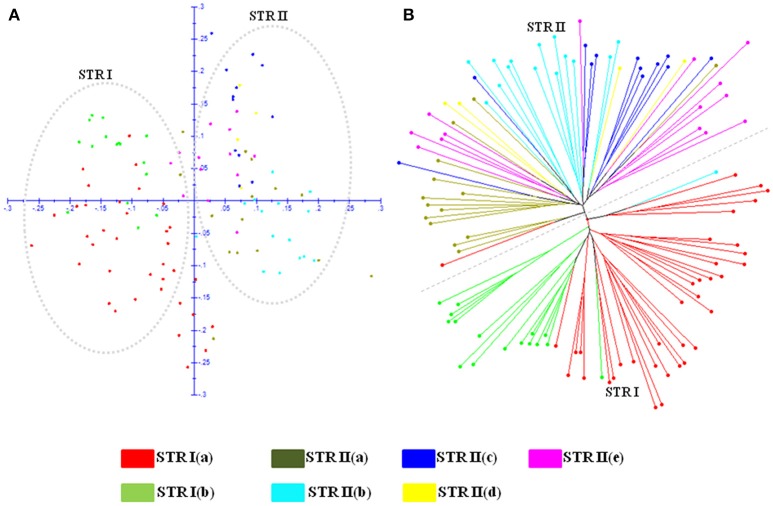
Carthamus tinctorius L. (safflower) is an important oilseed crop producing seed oil rich in unsaturated fatty acids. Scarcity of identified marker-trait associations is a major limitation toward development of successful marker-assisted breeding programs in safflower. In the present study, a safflower panel (CartAP) comprising 124 accessions derived from two core collections was assayed for its suitability for association mapping. Genotyping of CartAP using microsatellite markers revealed significant genetic diversity indicated by Shannon information index (H = 0.7537) and Nei's expected heterozygosity (I = 0.4432). In Principal Coordinate Analysis, the CartAP accessions were distributed homogeneously in all quadrants indicating their diverse nature. Distance-based Neighbor Joining analysis did not delineate the CartAP accessions in consonance with their geographical origin. Bayesian analysis of population structure of CartAP demonstrated the unstructured nature of the association panel. Kinship analysis at population (Gij ) and individual level (Fij ) revealed absence of or weak relatedness between the CartAP accessions. The above parameters established the suitability of CartAP for association mapping. We performed association mapping using phenotypic data for eight traits of agronomic value (viz., seed oil content, oleic acid, linoleic acid, plant height, number of primary branches, number of capitula per plant, 100-seed weight and days to 50% flowering) available for two growing seasons (2011-2012 and 2012-2013) through General Linear Model and Mixed Linear Model. Our study identified ninety-six significant marker-trait associations (MTAs; P < 0.05) of which, several MTAs with correlation coefficient (R2) > 10% were consistently represented in both models and in both seasons for traits viz., oil content, oleic acid content, linoleic acid content and number of primary branches. Several MTAs with high R2-values were detected either in a majority or in some environments (models and/or seasons). Many MTAs were also common between traits (viz., oleic/linoleic acid content; plant height/days to 50% flowering; number of primary branches/number of capitula per plant) that showed positive or negative correlation in their phenotypic values. The marker-trait associations identified in this study will facilitate marker-assisted breeding and identification of genetic determinants of trait variability.
Keywords: SSR markers; association mapping; core collections; kinship analysis; population structure; safflower.
Figures
References
-
- Agrama H. A., Eizenga G. C., Yan W. (2007). Association mapping of yield and its components in rice cultivars. Mol. Breed. 19, 341–356. 10.1007/s11032-006-9066-6 - DOI
-
- Ambreen H., Kumar S., Variath M. T., Joshi G., Bali S., Agarwal M., et al. (2015). Development of genomic microsatellite markers in Carthamus tinctorius L.(Safflower) using next generation sequencing and assessment of their cross-species transferability and utility for diversity analysis. PLoS ONE 10:e0135443. 10.1371/journal.pone.0135443 - DOI - PMC - PubMed
-
- Amini F., Saeidi G., Arzani A. (2008). Study of genetic diversity in safflower genotypes using agro-morphological traits and RAPD markers. Euphytica 163, 21–30. 10.1007/s10681-007-9556-6 - DOI
-
- Ashri A. (1975). Evaluation of the germplasm collection of safflower, Carthamus tinctorius L. V. Distribution and regional divergence for morphological characters. Euphytica 24, 651–659.
LinkOut - more resources
Full Text Sources
Other Literature Sources