

Analysis of neuroanatomical differences in mice with genetically modified serotonin transporters assessed by structural magnetic resonance imaging
- PMID: 29651330
- PMCID: PMC5894125
- DOI: 10.1186/s13229-018-0210-z
Analysis of neuroanatomical differences in mice with genetically modified serotonin transporters assessed by structural magnetic resonance imaging
Abstract
Background: The serotonin (5-HT) system has long been implicated in autism spectrum disorder (ASD) as indicated by elevated whole blood and platelet 5-HT, altered platelet and brain receptor and transporter binding, and genetic linkage and association findings. Based upon work in genetically modified mice, 5-HT is known to influence several aspects of brain development, but systematic neuroimaging studies have not previously been reported. In particular, the 5-HT transporter (serotonin transporter, SERT; 5-HTT) gene, Slc6a4, has been extensively studied.
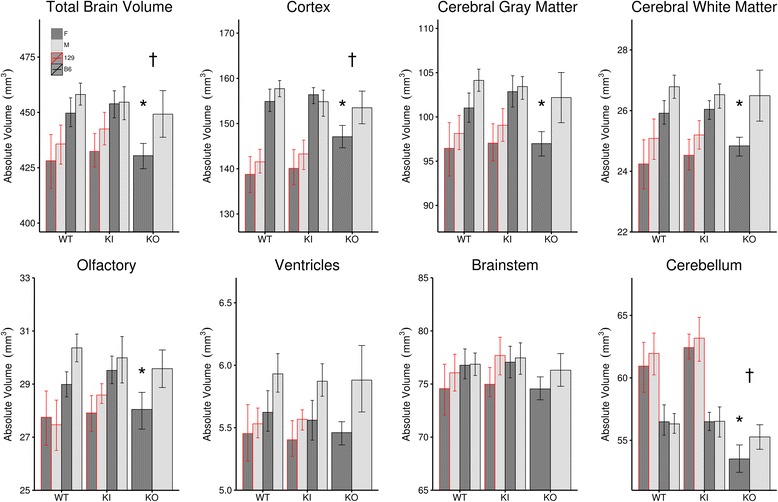
Methods: Using a 7-T MRI and deformation-based morphometry, we assessed neuroanatomical differences in an Slc6a4 knockout mouse on a C57BL/6 genetic background, along with an Slc6a4 Ala56 knockin mouse on two different genetic backgrounds (129S and C57BL/6).
Results: Individually (same sex, same background, same genotype), the only differences found were in the female Slc6a4 knockout mouse; all the others had no significant differences. However, an analysis of variance across the whole study sample revealed a significant effect of Slc6a4 on the amygdala, thalamus, dorsal raphe nucleus, and lateral and frontal cortices.
Conclusions: This work shows that an increase or decrease in SERT function has a significant effect on the neuroanatomy in 5-HT relevant regions, particularly the raphe nuclei. Notably, the Slc6a4 Ala56 knockin alone appears to have an insignificant, but suggestive, effect compared to the KO, which is consistent with Slc6a4 function. Despite the small number of 5-HT neurons and their localization to the brainstem, it is clear that 5-HT plays an important role in neuroanatomical organization.
Keywords: 5-HT; 5HTT; Brain; Dorsal raphe; Magnetic resonance imaging; Neurodevelopment; Serotonin; Slc6a4.
Conflict of interest statement
The animal care committees at Vanderbilt University and the Toronto Centre for Phenogenomics approved all these experiments.Not applicableJV has received research funding from Seaside Therapeutics, Novartis, Roche Pharmaceuticals, Forest, Sunovion, and SynapDx and has consulted for or served on advisory boards for Novartis, Roche, and SynapDx. The remaining authors declare no conflicts of interest.Springer Nature remains neutral with regard to jurisdictional claims in published maps and institutional affiliations.
Figures


Similar articles
-
Serotonin transporter variant drives preventable gastrointestinal abnormalities in development and function.J Clin Invest. 2016 Jun 1;126(6):2221-35. doi: 10.1172/JCI84877. Epub 2016 Apr 25. J Clin Invest. 2016. PMID: 27111230 Free PMC article.
-
Impact of Maternal Serotonin Transporter Genotype on Placental Serotonin, Fetal Forebrain Serotonin, and Neurodevelopment.Neuropsychopharmacology. 2017 Jan;42(2):427-436. doi: 10.1038/npp.2016.166. Epub 2016 Aug 23. Neuropsychopharmacology. 2017. PMID: 27550733 Free PMC article.
-
SLC6A4 markers modulate platelet 5-HT level and specific behaviors of autism: a study from an Indian population.Prog Neuropsychopharmacol Biol Psychiatry. 2015 Jan 2;56:196-206. doi: 10.1016/j.pnpbp.2014.09.004. Epub 2014 Sep 28. Prog Neuropsychopharmacol Biol Psychiatry. 2015. PMID: 25261775
-
Serotonin (5-HT) in the regulation of depression-related emotionality: insight from 5-HT transporter and tryptophan hydroxylase-2 knockout mouse models.Curr Drug Targets. 2013 May 1;14(5):549-70. doi: 10.2174/1389450111314050005. Curr Drug Targets. 2013. PMID: 23547810 Review.
-
The serotonin system in autism spectrum disorder: From biomarker to animal models.Neuroscience. 2016 May 3;321:24-41. doi: 10.1016/j.neuroscience.2015.11.010. Epub 2015 Nov 11. Neuroscience. 2016. PMID: 26577932 Free PMC article. Review.
Cited by
-
Brain serotonin, oxytocin, and their interaction: Relevance for eating disorders.J Psychopharmacol. 2025 Mar;39(3):187-200. doi: 10.1177/02698811241309617. Epub 2025 Jan 2. J Psychopharmacol. 2025. PMID: 39745000 Free PMC article. Review.
-
Pervasive cortical and white matter anomalies in a mouse model for CHARGE syndrome.J Anat. 2023 Jul;243(1):51-65. doi: 10.1111/joa.13856. Epub 2023 Mar 13. J Anat. 2023. PMID: 36914558 Free PMC article.
-
Deformation-based Morphometry MRI Reveals Brain Structural Modifications in Living Mu Opioid Receptor Knockout Mice.Front Psychiatry. 2018 Dec 3;9:643. doi: 10.3389/fpsyt.2018.00643. eCollection 2018. Front Psychiatry. 2018. PMID: 30559685 Free PMC article.
-
Turning strains into strengths for understanding psychiatric disorders.Mol Psychiatry. 2020 Dec;25(12):3164-3177. doi: 10.1038/s41380-020-0772-y. Epub 2020 May 13. Mol Psychiatry. 2020. PMID: 32404949 Free PMC article. Review.
-
Ultrahigh-resolution MRI reveals structural brain differences in serotonin transporter knockout rats after sucrose and cocaine self-administration.Addict Biol. 2020 Jan;25(1):e12722. doi: 10.1111/adb.12722. Epub 2019 Feb 12. Addict Biol. 2020. PMID: 30748070 Free PMC article.
References
-
- Steinbusch HW, van der Kooy D, Verhofstad AA, Pellegrino A. Serotonergic and non-serotonergic projections from the nucleus raphe dorsalis to the caudate-putamen complex in the rat, studied by a combined immunofluorescence and fluorescent retrograde axonal labeling technique. Neurosci Lett. 1980;19:137–142. doi: 10.1016/0304-3940(80)90184-6. - DOI - PubMed
Publication types
MeSH terms
Substances
Grants and funding
LinkOut - more resources
Full Text Sources
Other Literature Sources
Molecular Biology Databases
Research Materials
