. 2017 Jul 10;843(No 2):L21.
doi: 10.3847/2041-8213/aa7516. Epub 2017 Jul 6.

STAR FORMATION AT Z = 2.481 IN THE LENSED GALAXY SDSS J1110+6459: STAR FORMATION DOWN TO 30 PARSEC SCALES

Affiliations

STAR FORMATION AT Z = 2.481 IN THE LENSED GALAXY SDSS J1110+6459: STAR FORMATION DOWN TO 30 PARSEC SCALES

Traci L Johnson et al. Astrophys J Lett. .

Abstract

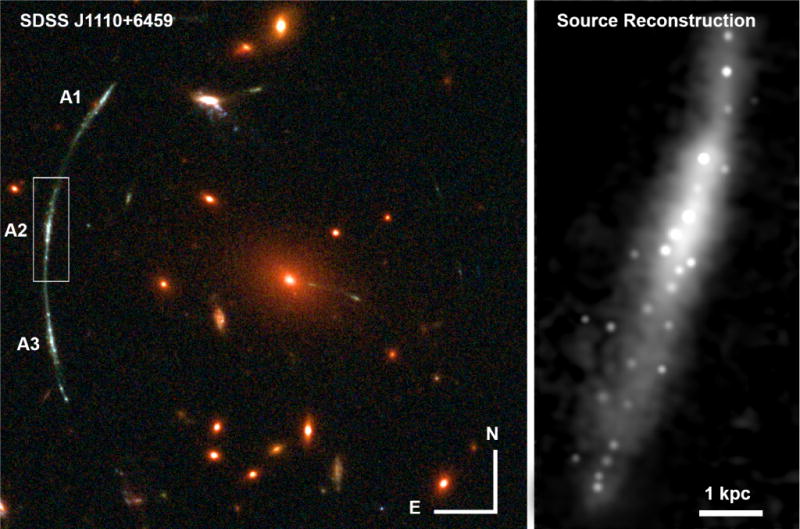
We present measurements of the surface density of star formation, the star-forming clump luminosity function, and the clump size distribution function, for the lensed galaxy SGAS J111020.0+645950.8 at a redshift of z =2.481. The physical size scales that we probe, radii r = 30-50 pc, are considerably smaller scales than have yet been studied at these redshifts. The star formation surface density we find within these small clumps is consistent with surface densities measured previously for other lensed galaxies at similar redshift. Twenty-two percent of the rest-frame ultraviolet light in this lensed galaxy arises from small clumps, with r <100 pc. Within the range of overlap, the clump luminosity function measured for this lensed galaxy is remarkably similar to those of z ∼ 0 galaxies. In this galaxy, star-forming regions smaller than 100 pc-physical scales not usually resolved at these redshifts by current telescopes-are important locations of star formation in the distant universe. If this galaxy is representative, this may contradict the theoretical picture in which the critical size scale for star formation in the distant universe is of order 1 kiloparsec. Instead, our results suggest that current telescopes have not yet resolved the critical size scales of star-forming activity in galaxies over most of cosmic time.

Keywords: galaxies: star formation; gravitational lensing: strong; ultraviolet: galaxies.


Figures

Figure 1
Figure 1
The lensed galaxy SGAS J111020.0+645950.8. The left panel shows the HST imaging in filters F105W, F606W, and F390W, with the three images of SGAS 1110 labeled. Image A2, the most highly magnified, is highlighted with a box. The right panel shows our reconstruction of this lensed galaxy in the source plane. Two dozen clumps of star formation are obvious in the reconstructed image; all have sizes much smaller than the kiloparsec scales typically probed by unlensed surveys of distant galaxies, and several times smaller than previously probed by gravitational lensing.
Figure 2
Figure 2
The star formation – radius relation. In green, we plot the results from this work: clumps from lensed galaxy SGAS J111020.0+645950.8 at z=2.481, with star formation rates and sizes estimated from the rest-frame ultraviolet (F606W filter). A reddening vector shows how the star formation rates inferred from the rest-frame ultraviolet would increase due to 1 magnitude of extinction (Av = 1). The vertical green stripe is the lensing PSF, with the interquartile range as the inner region, and the full range measured as the outer region. In the five cases where the lensing PSF was larger than the measured size, we plot the size as an upper limit, set at the lensing PSF. The horizontal dashed line is the 80% completeness limit determined in Paper I, corresponding to a source plane flux of mAB = 33.2 in F606W. Comparison samples from the literature are over-plotted (Swinbank et al. 2007, 2009; Jones et al. 2010; Wisnioski et al. 2012; Livermore et al. 2012; Swinbank et al. 2012; Wuyts et al. 2014; Livermore et al. 2015; Fisher et al. 2016); for most, the star formation rate was measured using Hα; for the z ∼ 5 galaxies [O II] 3727 was used instead. Diagonal dashed lines show the best fit relations in four redshift bins from Livermore et al. (2015). This figure is adapted from Livermore et al. (2012) and Livermore et al. (2015), though unlike that work, we do not filter the SINGS Hα images (Kennicutt Jr et al. 2003) to match the literature measurements at z ∼ 1–1.5, but instead use those images at their native resolution and depth. Of the twoz ~ 0 samples, Kennicutt Jr et al. (2003) was chosen to represent “normal” galaxies, while Fisher et al. (2016) have higher star formation rates.
Figure 3
Figure 3
The differential luminosity function of star-forming clumps. The median of the incompleteness-corrected aggregate posterior distribution function of clump luminosity, for clumps above our 80% completeness limit, for the F606W filter for SGAS 1110 are plotted as the blue line; this is the kernel density estimate for the posterior probability density function, corrected for incompleteness based on the Markov Chain Monte Carlo forward modeling described in Paper I, and normalized to the number of clumps per galaxy. The shaded region shows the 16th and 84th percentiles. The black steps show the corresponding normalized distribution for H II regions in the nearby universe (Liu et al. 2013), measured using Paschen α, and normalized by the number of galaxies.
Figure 4
Figure 4
The differential distribution function of star-forming clump size (radius). The median of the incompleteness–corrected posterior probability density function for SGAS 1110, filter F606W, is plotted as the blue line. The shaded region shows the 16th and 84th percentiles. Radii for SGAS 1110 are half width at half maximum (HWHM). Radii from the z ~ 0 comparison sample (Liu et al. 2013) are isophotal from HIIphot (Thilker et al. 2000). Given these different techniques for measuring size, we expect a normalization offset; for lensed galaxies the isophotal sizes can be ∼ 25% larger than Gaussian sizes (Livermore et al. 2012). The vertical stripes are the lensing PSF limits. Stochastic effects are likely to blame for the mismatch at large sizes.

References

    1. Brooks AM, Governato F, Quinn T, Brook CB, Wadsley J. ApJ. 2009;694:396.
    1. Calvi V, Stiavelli M, Bradley L, Pizzella A, Kim S. ApJ. 2014;102
    1. Dekel A, Birnboim Y. Monthly Notices of the Royal Astronomical Society. 2006;368:2.
    1. Einstein A. Science. 1936;84:506. - PubMed
    1. Elmegreen BG, Elmegreen DM. ApJ. 2005;627:632.

LinkOut - more resources