. 2018 Apr 13:7:e34353.
doi: 10.7554/eLife.34353.

Microtubule assembly governed by tubulin allosteric gain in flexibility and lattice induced fit

Affiliations

Microtubule assembly governed by tubulin allosteric gain in flexibility and lattice induced fit

Maxim Igaev et al. Elife. .

Abstract

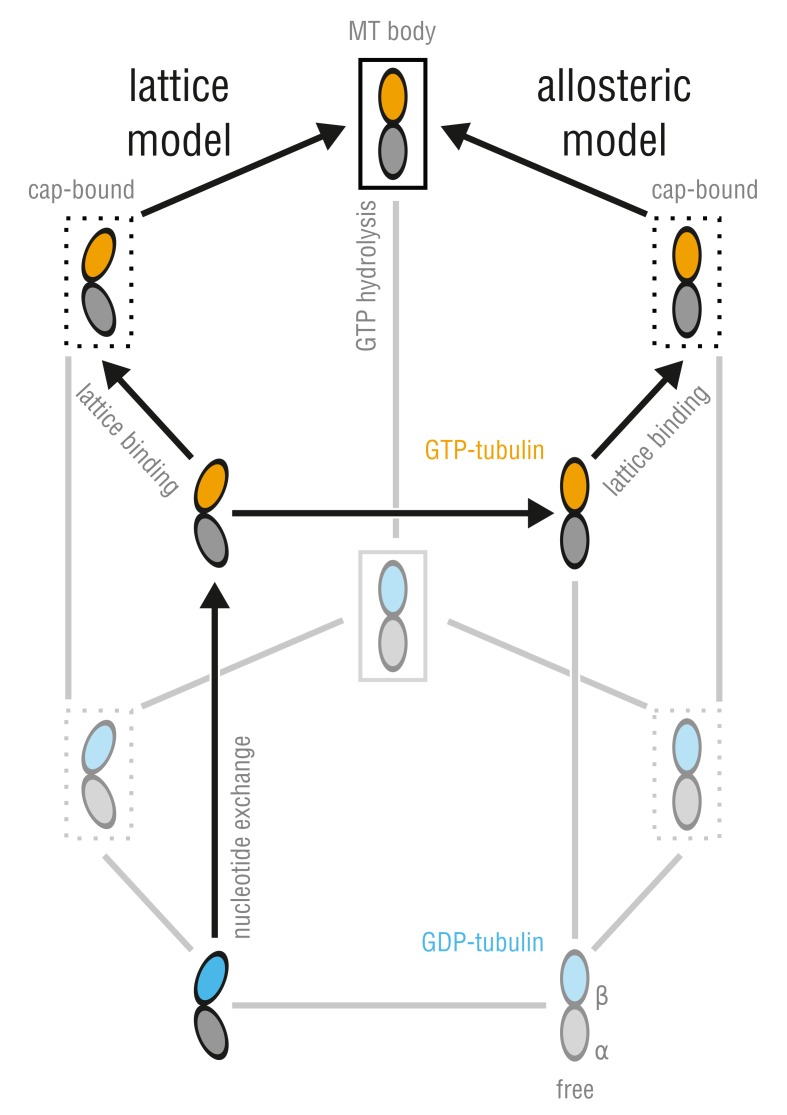
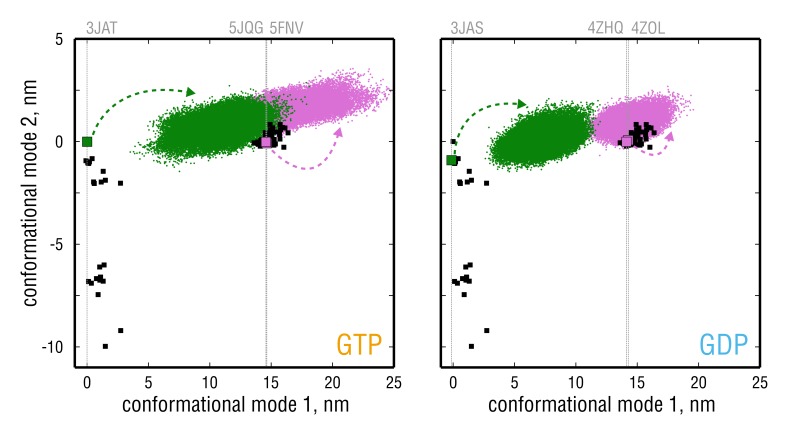
Microtubules (MTs) are key components of the cytoskeleton and play a central role in cell division and development. MT assembly is known to be associated with a structural change in [Formula: see text]-tubulin dimers from kinked to straight conformations. How GTP binding renders individual dimers polymerization-competent, however, is still unclear. Here, we have characterized the conformational dynamics and energetics of unassembled tubulin using atomistic molecular dynamics and free energy calculations. Contrary to existing allosteric and lattice models, we find that GTP-tubulin favors a broad range of almost isoenergetic curvatures, whereas GDP-tubulin has a much lower bending flexibility. Moreover, irrespective of the bound nucleotide and curvature, two conformational states exist differing in location of the anchor point connecting the monomers that affects tubulin bending, with one state being strongly favored in solution. Our findings suggest a new combined model in which MTs incorporate and stabilize flexible GTP-dimers with a specific anchor point state.

Keywords: dynamic instability; microtubule; molecular biophysics; molecular dynamics; none; structural biology; tubulin.


Conflict of interest statement

MI, HG No competing interests declared

Figures

Figure 1.
Figure 1.. Allosteric and lattice models of MT assembly represented by a three-dimensional thermodynamic cycle.
GTP- (orange) and GDP-dimers (blue) can be free (no box), MT-cap-bound (dotted box), or integrated into the MT body (solid box). The dimmed states denote energetically unfavored states.
Figure 2.
Figure 2.. PCA on the set of experimental structures.
(A) Projection of the set onto the plane constituted by the first and second largest-amplitude conformational modes. Each structure is represented by a point on this plane. Known experimental structures involved in this study (PDB ID: 3JAT, 3JAS, 5JQG, 5FNV, 4ZOL, 4ZHQ) as well as other structures widely referenced in literature (PDB ID: 1TUB, 1JFF, 1SA0) are highlighted. (B) Same data as in (A) but with straight (TUBS) and kinked (TUBK) subpopulations highlighted in green and pink, respectively. (C) Curvature differences between the subpopulations in (B) displayed in terms of structure. Shown are the extreme conformations along conformational mode 1 (x-axis). α-tubulin is shown in gray and β-tubulin in green or pink, depending on the subpopulation. The anchor point that does not move during the straight-to-kinked transition is marked with a back dashed circle/line.
Figure 2—figure supplement 1.
Figure 2—figure supplement 1.. A simplified 2D example of the principal component analysis (PCA).
Given a set of observations, each being a point on a plane described by only two coordinates (left panel), the method calculates ‘collective’ coordinates on this plane that account for as much of the variation of the data as possible. These coincide with the directions of the largest variance in the data set and are always orthogonal to each other. The new coordinates are termed principal components or conformational modes (right panel). In a general case, individual observations in the data set may be described by an arbitrary number of coordinates (e.g., N atoms each described by three coordinates in case of atomic structures), and only a few conformational modes are usually enough to describe the variation in the entire data set.
Figure 3.
Figure 3.. Simulated tubulin ensembles in two nucleotide states (left vs.right panel) plotted as in Figure 2A,B.
Experimental structures are shown as black squares, whereas the simulated ensembles are shown as green (started from straight conformation) or pink (started from kinked conformation) point clouds. Experimental structures that were used for simulations are indicated with larger colored squares and vertical gray lines.
Figure 3—figure supplement 1.
Figure 3—figure supplement 1.. Convergence of the simulated ensembles assessed by overlaying point clouds originating from different independent simulations (two independent simulations per bound nucleotide per curvature state).
The data are plotted as in Figure 2A,B and Figure 3. Dynamics of the simulated dimers stared from the straight MT conformations (PDB ID: 3JAT and 3JAS) during the 6-ns equilibration phase are shown as zoomed-in regions (top; red points).
Figure 4.
Figure 4.. Free energy profiles derived from the projections of the simulated ensembles onto a plane, where the x-axis denotes the position along the ensemble separation RC and the y-axis denotes an orthogonal coordinate describing the largest-amplitude bending motion in the combined TUBS + TUBK ensemble.
Experimental structures used for the free simulations are highlighted with gray dashed lines and green (straight structures) and pink squares (kinked structures).
Figure 4—figure supplement 1.
Figure 4—figure supplement 1.. A 2D example of the ensemble separation search.
Given a system with two energy minima in the 2D conformational space (state 1 and 2), the method aims at rotating the coordinate system such that the x-axis coincides with the axis along which the system would encounter the highest barrier while transitioning from state 1 to state 2 (black arrow). A poorly chosen coordinate (left column) may result in a misleading free energy profile with an underestimated energy barrier and, hence, wrong conclusions. In a general case, the conformational space in which the two minima (state 1 and 2) exist has a dimension much higher than two, and the search is performed in all of these dimensions.
Figure 4—figure supplement 2.
Figure 4—figure supplement 2.. Dot products of the three-dimensional ensemble separation vector with vectors of higher dimensions for the tubulin ensembles in two different nucleotide states.
With the increasing number of PCA eigenvectors in the search space, the ensemble separation vector becomes independent of the search space dimension. This yields the minimal search space in which the ensembles can be efficiently separated.
Figure 5.
Figure 5.. Nucleotide-dependent motions of tubulin bending.
(A) Molecular representation of the twist-bend and splay-bend tubulin bending motions derived from the TUBSGTP and TUBKGTP simulated ensembles. The anchor point around the H8 helix is indicated with dashed lines/circles. See also Figure 5—video 1 for a side-by-side comparison. (B) Same data as in Figure 4 (left) with the derived bending motions shown as solid lines overlayed onto the free energy distributions. Experimental structures used for the free simulations are highlighted with gray dashed lines and green (straight structures) and pink squares (kinked structures).
Figure 5—figure supplement 1.
Figure 5—figure supplement 1.. Functional mode analysis of the TUBSGTP and TUBKGTP ensembles.
(A) Straight (reference) and kinked tubulin structures aligned by α-subunit. The RMSD to the reference increases as the tubulin conformation deviates from the straight conformation, irrespective of the bending direction. (B) Pearson correlation coefficients between model building (Rm, red) and cross-validation (Rv, cyan) sets as functions of the FMA basis dimension. The optimal number of FMA components is indicated with an arrow in both cases. (C) Overlays of the RMSD (black) and the FMA fit with the model building and cross-correlation parts shown in red and cyan, respectively.
Figure 6.
Figure 6.. Free energy profiles along the bending RCs defined for the TB and SB bending motions calculated for GTP- and GDP-tubulin.
Smaller (larger) values on the x-axis correspond to straighter (more kinked) dimer conformations. Squares denote the positions of the starting PDB structures in the GTP- (black) and GDP-state (gray) used for the free MD simulations. Note that the scaling for both RCs does not necessarily coincide with that of the common bending RC in Figure 4, as the vectors defining the TB and SB motions and the common bending motion were derived differently (see Materials and methods).
Figure 6—figure supplement 1.
Figure 6—figure supplement 1.. Convergence properties and robustness of the error evaluation with respect to the method used.
(A) Unnormalized individual umbrella histograms, each derived from a restrained simulation of at least 120 ns or longer. (B) Error evaluation using a block average method (Zhu and Hummer, 2012). The errors are consistent with those obtained through Bayesian bootstrapping in Figure 6. Gray circles depict the points on which the restraining harmonic potentials were centered. Here, the reference points are located at the leftmost edge of the respective free energy profile (black circles). The same color-coding is used as in Figure 5 and Figure 6.
Figure 7.
Figure 7.. Dynamics and energetics of GTP-tubulin along the ensemble separation RC.
(A) Collective mode of motion along the ensemble separation RC represented as a linear interpolation between the TUBS and TUBK simulated ensembles. The largest-amplitude intrinsic rearrangements in β-tubulin are indicated with dashed lines and involve the H7 and H8 helices as well as a loop connecting them. (B) Free energy landscape as a function of the ensemble separation RC. Orientation of this coordinate with respect to the TB and SB free energy basins is schematically shown as an insert. Experimental structures used for the free simulations are highlighted with green (straight structures) and pink squares (kinked structures).
Figure 7—figure supplement 1.
Figure 7—figure supplement 1.. Convergence properties and robustness of the error evaluation with respect to the method used.
(A) Unnormalized individual umbrella histograms, each derived from a restrained simulation of at least 120 ns or longer. The region around the barrier at 2.5 nm was sampled more extensively. (B) Error evaluation using a block average method (Zhu and Hummer, 2012). The errors are consistent with those obtained through Bayesian bootstrapping in Figure 7B (ΔGTB=11.7±3.6kT, ΔGSB=19.1±2.9kT, and ΔGTBSB=7.4±3.4kT). Gray circles depict the points on which the restraining harmonic potentials were centered. Here, the reference point is located at the rightmost edge of the free energy profile (black circle).
Figure 8.
Figure 8.. The proposed, combined model of MT assembly represented by a thermodynamic cycle.
Here, TB and SB denote not only the different modes of tubulin bending but also the belonging to the respective free energy basin, i.e. anchor point state.

Similar articles

Cited by

References

    1. Altschul SF, Gish W, Miller W, Myers EW, Lipman DJ. Basic local alignment search tool. Journal of Molecular Biology. 1990;215:403–410. doi: 10.1016/S0022-2836(05)80360-2. - DOI - PubMed
    1. Alushin GM, Lander GC, Kellogg EH, Zhang R, Baker D, Nogales E. High-resolution microtubule structures reveal the structural transitions in αβ-tubulin upon GTP hydrolysis. Cell. 2014;157:1117–1129. doi: 10.1016/j.cell.2014.03.053. - DOI - PMC - PubMed
    1. Amadei A, Linssen AB, Berendsen HJ. Essential dynamics of proteins. Proteins: Structure, Function, and Genetics. 1993;17:412–425. doi: 10.1002/prot.340170408. - DOI - PubMed
    1. André JR, Clément MJ, Adjadj E, Toma F, Curmi PA, Manivet P. The state of the guanosine nucleotide allosterically affects the interfaces of tubulin in protofilament. Journal of Computer-Aided Molecular Design. 2012;26:397–407. doi: 10.1007/s10822-012-9566-x. - DOI - PubMed
    1. Arnal I, Karsenti E, Hyman AA. Structural transitions at microtubule ends correlate with their dynamic properties in Xenopus egg extracts. The Journal of Cell Biology. 2000;149:767–774. doi: 10.1083/jcb.149.4.767. - DOI - PMC - PubMed

Publication types

LinkOut - more resources