. 2018 Jun:16:414-425.
doi: 10.1016/j.redox.2018.03.019. Epub 2018 Apr 2.

Autophagy inhibition attenuates hyperoxaluria-induced renal tubular oxidative injury and calcium oxalate crystal depositions in the rat kidney

Affiliations

Autophagy inhibition attenuates hyperoxaluria-induced renal tubular oxidative injury and calcium oxalate crystal depositions in the rat kidney

Xiaolu Duan et al. Redox Biol. 2018 Jun.

Abstract

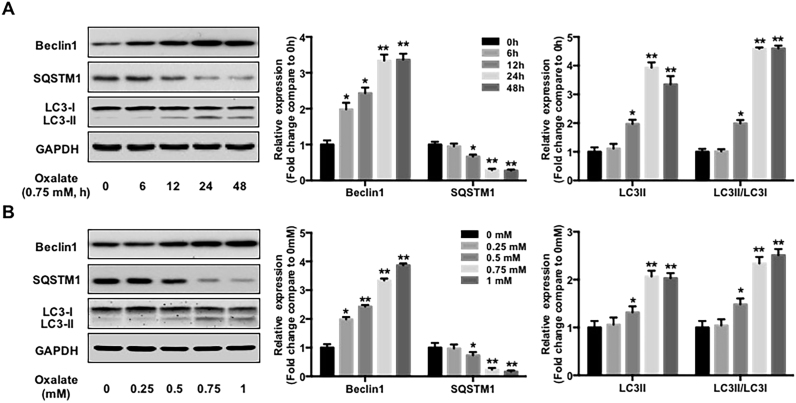
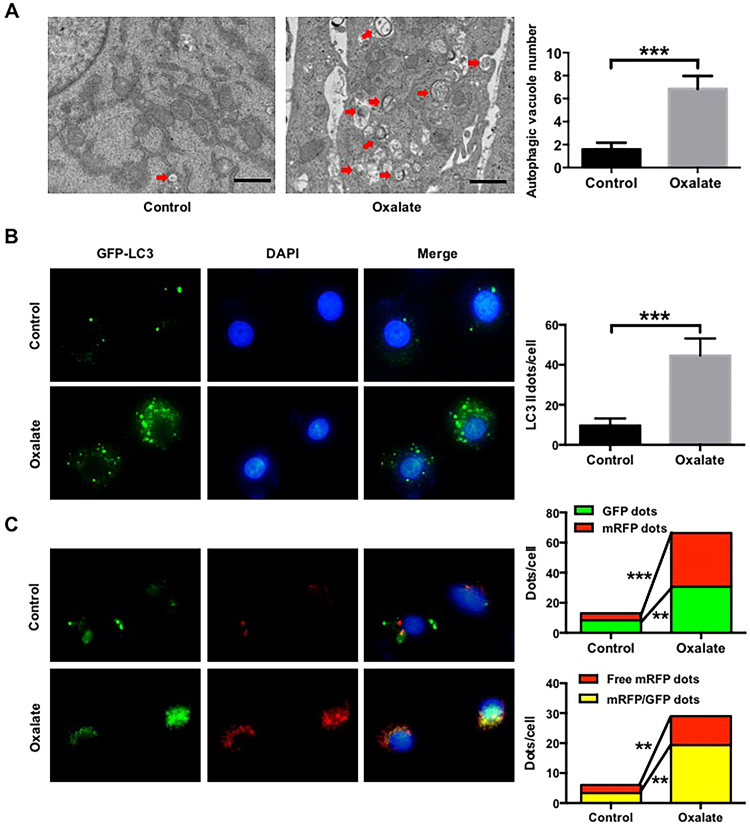
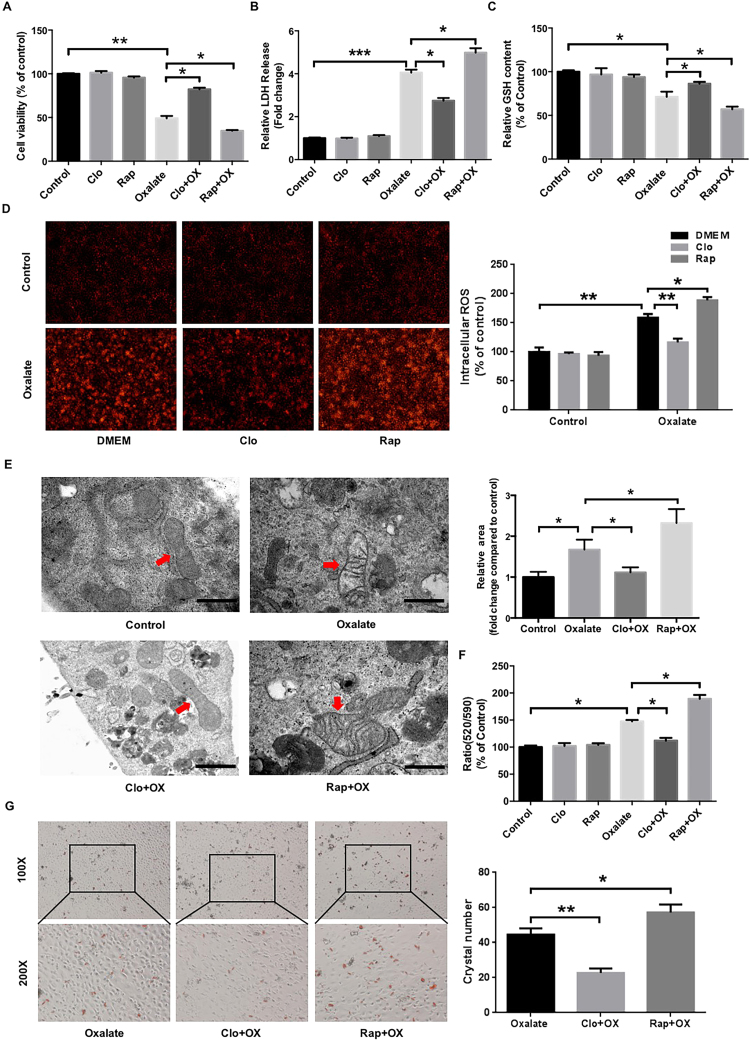
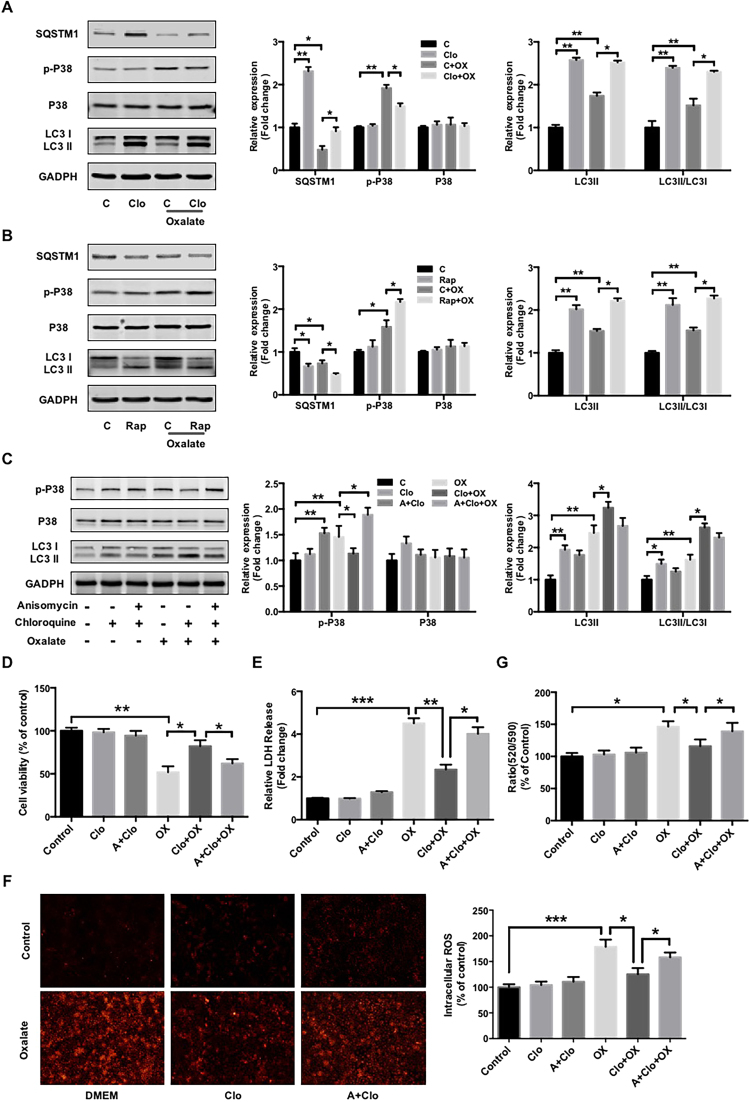
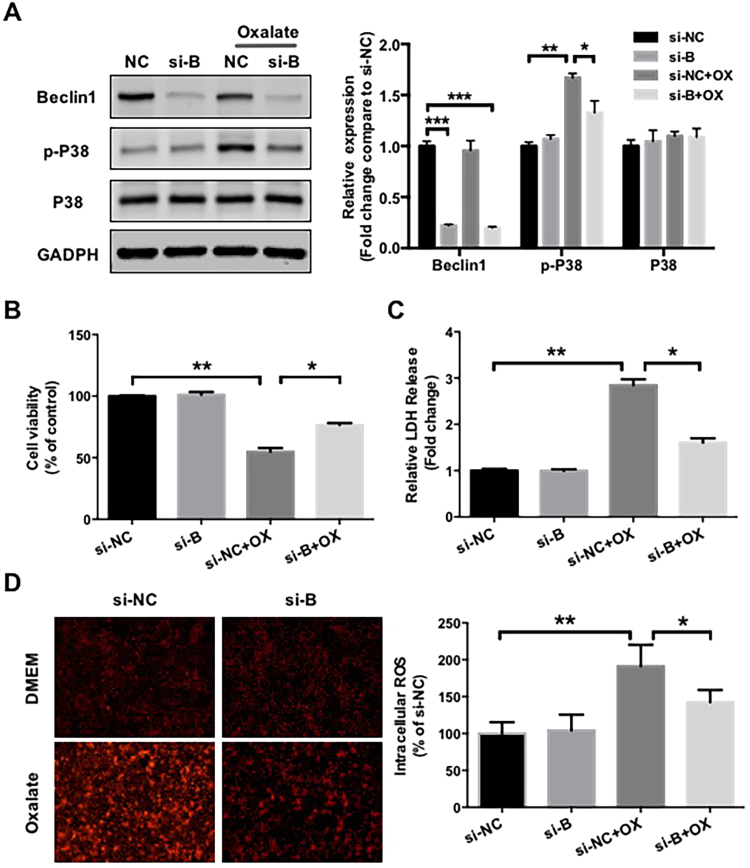
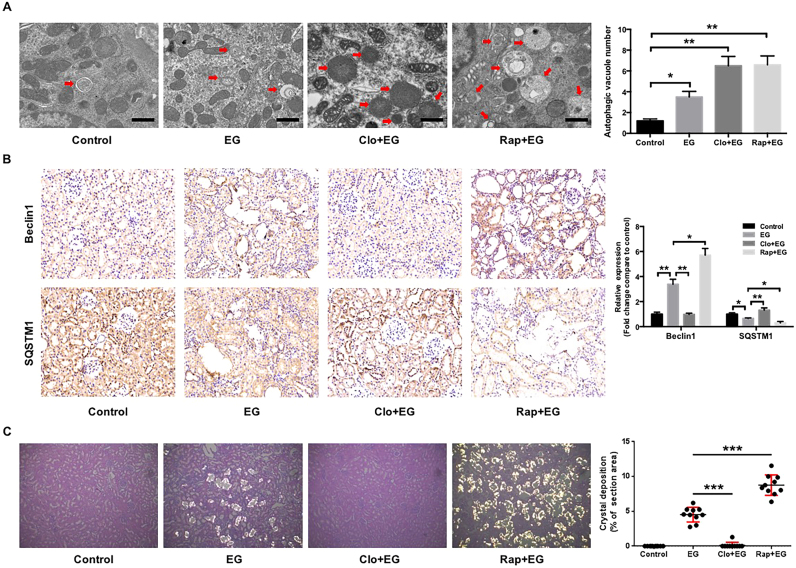
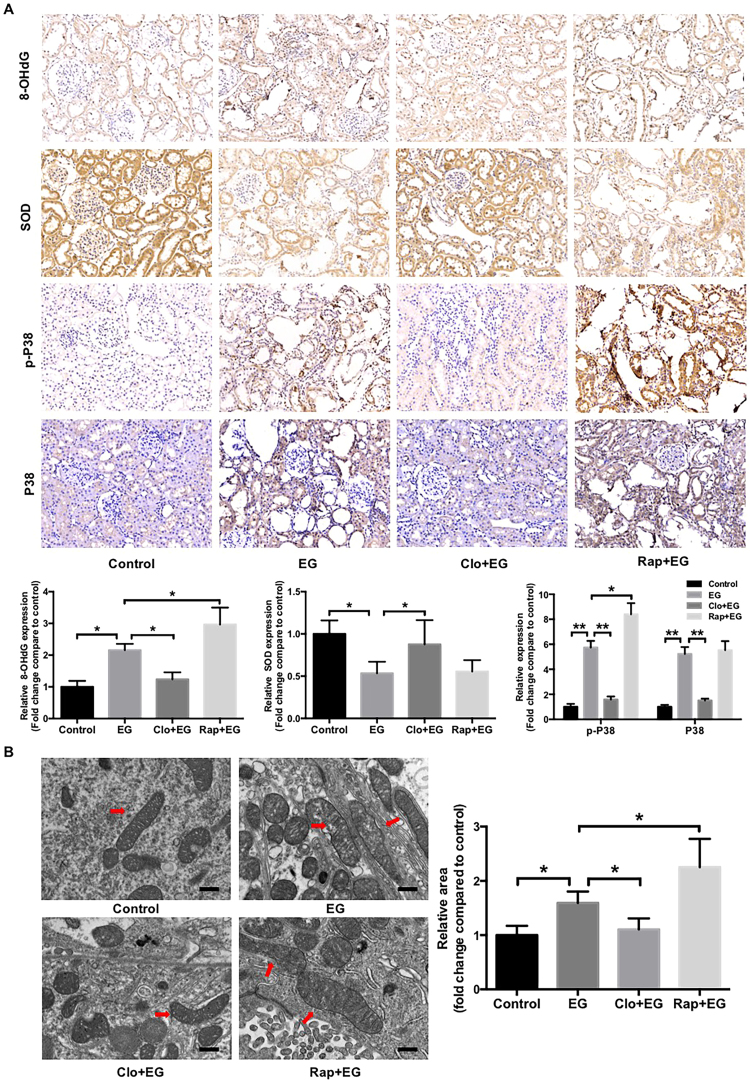
Hyperoxaluria-induced oxidative injury of renal tubular epithelial cell is a casual and essential factor in kidney calcium oxalate (CaOx) stone formation. Autophagy has been shown to be critical for the regulation of oxidative stress-induced renal tubular injury; however, little is known about its role in kidney CaOx stone formation. In the present study, we found that the autophagy antagonist chloroquine could significantly attenuate oxalate-induced autophagy activation, oxidative injury and mitochondrial damage of renal tubular cells in vitro and in vivo, as well as hyperoxaluria-induced CaOx crystals depositions in rat kidney, whereas the autophagy agonist rapamycin exerted contrasting effects. In addition, oxalate-induced p38 phosphorylation was significantly attenuated by chloroquine pretreatment but was markedly enhanced by rapamycin pretreatment, whereas the protective effect of chloroquine on rat renal tubular cell oxidative injury was partly reversed by a p38 protein kinase activator anisomycin. Furthermore, the knockdown of Beclin1 represented similar effects to chloroquine on oxalate-induced cell oxidative injury and p38 phosphorylation in vitro. Taken together, our results revealed that autophagy inhibition could attenuate oxalate-induced oxidative injury of renal tubular cell and CaOx crystal depositions in the rat kidney via, at least in part, inhibiting the activation of p38 signaling pathway, thus representing a novel role of autophagy in the regulation of oxalate-induced renal oxidative injury and CaOx crystal depositions for the first time.

Keywords: Autophagy; Calcium oxalate stone; Oxalate; Oxidative injury; p38.


Figures

Fig. 1
Fig. 1
Effect of oxalate stimulation on the expressions of autophagy substrates in NRK-52E cells. Twenty-four hours after seeded, NRK-52E cells were incubated in the medium supplemented with 1% FBS for 1 h, followed by the addition of oxalate (0.75 mM) for indicated hours (A) or different concentrations of oxalate for 48 h (B), then the cells were harvested and the expressions of indicated proteins were detected by western blot and quantified using ImageJ software. *P < 0.05 and ** P < 0.01 versus untreated group.
Fig. 2
Fig. 2
Quantitative changes of autophagic vacuoles, autophagosomes and autolysosomes after exposure to urinary proteins in NRK-52E cells. (A) Quantitative changes of autophagic vacuoles under TEM in NRK-52E cells after treated with/without 0.75 mM oxalate for 48 h. The red arrows indicate autophagic vacuoles. Scale bar: 1 µm. (B) Fluorescent microscopic and quantitative analysis of NRK-52E cells that were transfected with pEGFP-LC3 plasmids and treated with/without 0.75 mM oxalate for 48 h. (C) Fluorescent microscopic and quantitative analysis of NRK-52E cells that were transfected with ptfLC3 plasmids and treated with/without 0.75 mM oxalate for 48 h. **P < 0.01 and ***P < 0.001.
Fig. 3
Fig. 3
Effects of rapamycin and chloroquine on oxalate-induced oxidative injury of NRK-52E cells. (A-C) Twenty-four hours after being seeded in a 96-well plate, NRK-52Ecells were incubated with or without rapamycin (RAP, 5 μM) or chloroquine (Clo, 5 μM) for 2 h, after which they were stimulated with oxalate (0.75 mM) for 48 h. Cell viability, LDH release and GSH release were subsequently assessed as described in the “Materials and Methods”. (D) DHE staining results and quantitative data for cells treated as described in (A-C). Original magnification 200×. (E) Ultrastructural images of the mitochondria in NRK-52E cells treated as described above. Scale bar: 500 nm. The surface areas of indicated mitochondria were quantified using ImageJ software. (F) Mitochondrial membrane potential (Δψm) of the cells treated as described above was determined by JC-10 assay. (G) Crystal-cell adhesion assay results and quantitative data for ponceau-S-labeled COM crystals (red) adhering to cells treated as described above. Original magnification 200×. *P < 0.05, **P < 0.01 and ***P < 0.001.
Fig. 4
Fig. 4
Involvement of p38 signaling in the regulation of autophagy-mediated oxidative injury induced by oxalate. (A and B) The expression levels of indicated proteins in NRK-52E cells treated as described in Fig. 3A were detected by western blot and quantified using ImageJ software. (C) Twenty-four hours after being seeded in 60-mm dishes, the cells were incubated with or without anisomycin (A, 1 μM) for 2 h, after which they were treated with or without chloroquine (Clo, 5 μM) for 2 h and stimulated with oxalate (0.75 mM) for 48 h. The expression levels of the indicated proteins were detected by western blot and quantified using ImageJ software. (D, E and G) NRK-52E cells were seeded in a 96-well plate and treated as described in (B), then the cell viability, LDH release and mitochondrial membrane potential were assessed as described in Fig. 3. (F) DHE staining results and quantitative data for cells treated as described in (C). Original magnification 200×. *P < 0.05, **P < 0.01 and ***P < 0.001.
Fig. 5
Fig. 5
Effects of siRNA-mediated Beclin1 knockdown on oxalate-induced oxidative injury in NRK-52E cells. (A) Forty-eight hours after transfection, NRK-52E cells were cultured in medium supplemented with or without 0.75 mM oxalate for 48 h, then the expressions of indicated proteins were detected by western blot and quantified using ImageJ software. (B and C) Forty-eight hours after transfection, equal amounts of cells were seeded in 96-well plate and cultured in medium supplemented with or without 0.75 mM oxalate for 48 h. Cell viability and LDH release were subsequently assessed. (D) DHE staining results and quantitative data for cells treated as described in (A). Original magnification 200×. *P < 0.05 and **P < 0.01.
Fig. 6
Fig. 6
Effects of rapamycin or chloroquine on autophagic activity and EG-induced CaOx crystals depositions in rat kidneys. (A) Quantitative changes in autophagic vacuoles under TEM in kidney sections from indicated rats. The red arrows indicate autophagic vacuoles. Scale bar: 1 µm. (B) The expressions of Beclin1 and SQSTM1 in kidney sections from indicated rats were detected by immunohistochemical staining and quantified using Image Pro Plus software. (magnification 200×) (C) Photomicrographs of kidney sections from indicated rats were obtained under dark field illumination with polarized light. Retained crystals exhibit strong birefringence (magnification 200×). The sizes of the areas of crystal deposition per field were estimated and quantified using ImageJ software. *P < 0.05, **P < 0.01 and ***P < 0.001.
Fig. 7
Fig. 7
Effects of rapamycin or chloroquine on EG-induced renal oxidative injury in rat kidneys. (A) Immunohistochemical staining and quantification for oxidative injury-related markers and p38 in kidney sections from indicated rats. Original magnification 200×. (B) Ultrastructural images of mitochondria in kidney sections from indicated rats. The red arrows indicate mitochondria. Scale bar: 500 nm. The surface areas of indicated mitochondria were quantified using ImageJ software. *P < 0.05, **P < 0.01 versus Control group, # P < 0.05, ##P < 0.01 versus EG group.

References

    1. Kusmartsev S., Dominguez-Gutierrez P.R., Canales B.K., Bird V.G., Vieweg J., Khan S.R. Calcium oxalate stone fragment and crystal phagocytosis by human macrophages. J. Urol. 2016;195:1143–1151. - PMC - PubMed
    1. Zeng G., Mai Z., Xia S., Wang Z., Zhang K., Wang L., Long Y., Ma J., Li Y., Wan S.P., Wu W., Liu Y., Cui Z., Zhao Z., Qin J., Zeng T., Liu Y., Duan X., Mai X., Yang Z., Kong Z., Zhang T., Cai C., Shao Y., Yue Z., Li S., Ding J., Tang S., Ye Z. Prevalence of kidney stones in China: an ultrasonography based cross-sectional study. BJU Int. 2017;120:109–116. - PubMed
    1. Evan A.P., Worcester E.M., Coe F.L., Williams J., Lingeman J.E. Mechanisms of human kidney stone formation. Urolithiasis. 2015;43(Suppl. 1):19–32. - PMC - PubMed
    1. Worcester E.M., Coe F.L. Clinical practice. Calcium kidney stones. N. Engl. J. Med. 2010;363:954–963. - PMC - PubMed
    1. Aggarwal K.P., Narula S., Kakkar M., Tandon C. Nephrolithiasis: molecular mechanism of renal stone formation and the critical role played by modulators. BioMed. Res. Int. 2013;2013:292953. - PMC - PubMed

Publication types

Substances

Supplementary concepts