. 2018 Aug;18(8):e228-e238.
doi: 10.1016/S1473-3099(18)30134-8. Epub 2018 Apr 10.

Progression from latent infection to active disease in dynamic tuberculosis transmission models: a systematic review of the validity of modelling assumptions

Affiliations

Progression from latent infection to active disease in dynamic tuberculosis transmission models: a systematic review of the validity of modelling assumptions

Nicolas A Menzies et al. Lancet Infect Dis. 2018 Aug.

Erratum in

  • Corrections.
    [No authors listed] [No authors listed] Lancet Infect Dis. 2018 Nov;18(11):1177. doi: 10.1016/S1473-3099(18)30603-0. Epub 2018 Sep 27. Lancet Infect Dis. 2018. PMID: 30269945 No abstract available.

Abstract

Mathematical modelling is commonly used to evaluate infectious disease control policy and is influential in shaping policy and budgets. Mathematical models necessarily make assumptions about disease natural history and, if these assumptions are not valid, the results of these studies can be biased. We did a systematic review of published tuberculosis transmission models to assess the validity of assumptions about progression to active disease after initial infection (PROSPERO ID CRD42016030009). We searched PubMed, Web of Science, Embase, Biosis, and Cochrane Library, and included studies from the earliest available date (Jan 1, 1962) to Aug 31, 2017. We identified 312 studies that met inclusion criteria. Predicted tuberculosis incidence varied widely across studies for each risk factor investigated. For population groups with no individual risk factors, annual incidence varied by several orders of magnitude, and 20-year cumulative incidence ranged from close to 0% to 100%. A substantial proportion of modelled results were inconsistent with empirical evidence: for 10-year cumulative incidence, 40% of modelled results were more than double or less than half the empirical estimates. These results demonstrate substantial disagreement between modelling studies on a central feature of tuberculosis natural history. Greater attention to reproducing known features of epidemiology would strengthen future tuberculosis modelling studies, and readers of modelling studies are recommended to assess how well those studies demonstrate their validity.


Conflict of interest statement

Declaration of interests

PJW has received research funding from Otsuka SA for a retrospective study of multidrug-resistant tuberculosis treatment in several eastern European countries. The other authors declare no competing interests.

Figures

Figure 1
Figure 1. Classification of model types and transition probabilities
Some model structures are special cases of other structures. For example, structures A and C are special cases of structures E and G, with parameter “a” set to zero. S=susceptible compartment (not infected with tuberculosis and not previously exposed). λ =force of infection for Mycobacterium tuberculosis. L=latent M tuberculosis infection compartment. c=rate of progression to active tuberculosis for individuals in the latent compartment or slow latent compartment. I=active tuberculosis disease compartment. Ls=slow latent M tuberculosis infection compartment. Lf=fast latent M tuberculosis infection compartment. f=rate of transition to the fast latent compartment for individuals in the slow latent compartment. d=rate of progression to active tuberculosis for individuals in the fast latent compartment. e=rate of transition to the slow latent compartment for individuals in the fast latent compartment. a=probability of immediate progression to active tuberculosis compartment, for individuals in susceptible compartment who are infected with M tuberculosis. b=probability of progression to fast latent compartment, for individuals in susceptible compartment who are infected with M tuberculosis. *Structure B involves a set of tunnel states for recent latent infection (Lf1..Lfn), whereby individuals not progressing to active tuberculosis transition deterministically to next tunnel state (n+1) at each time step. Each of these compartments has a different progression risk (d1..dn). †Structure J involves a sequence of latent compartments (L1..Ln), with individuals only transitioning to the active tuberculosis compartment from the final compartment. ‡Structures K and L involve a single latent compartment, with the rate of transition to active tuberculosis calculated as a function of time since infection. Both of these structures were implemented using individual-based models, allowing time since infection to be tracked at the individual level.
Figure 2
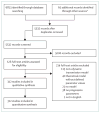
Figure 2. Flow diagram of studies assessed for the review
*Other sources included a database of modelling publications compiled by the TB Modelling and Analysis Consortium, the reference lists of eligible publications, a group of non-indexed journals, and the personal databases of the authors to identify publications not included in the electronic search.
Figure 3
Figure 3
Model predictions for annual (A) and cumulative (B) incidence of active tuberculosis by years since infection, for population groups with no individual risk factors
Figure 4
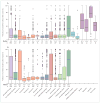
Figure 4. Distribution of model predictions for cumulative incidence of active tuberculosis at 2 (A) and 20 (B) years since Mycobacterium tuberculosis infection; stratified by model structure, individual risk factors*, and other study characteristics
ART=antiretroviral therapy. *Individual results not shown for structures D, G, H, I, J, and K, as less than five studies used these structures to model individuals with no other risk factors. †Only includes results for population groups with no individual factors modifying tuberculosis progression risks. ‡20-year cumulative incidence projections are not shown for these groups because of potential for unmodelled changes in risk factors.
Figure 5
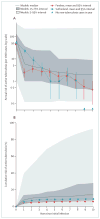
Figure 5. Comparison between model predictions and empirical evidence for annual (A) and cumulative (B) incidence of active tuberculosis by years since Mycobacterium tuberculosis infection, for groups with no individual risk factors
Empirical estimates based on the British Medical Research Council BCG trials (Sutherland) and the US Public Health Service’s isoniazid trials (Ferebee).

Comment in

References

    1. Ferebee SH. Controlled chemoprophylaxis trials in tuberculosis. A general review. Bibl Tuberc. 1970;26:28–106. - PubMed
    1. Sutherland I. Recent studies in the epidemiology of tuberculosis, based on the risk of being infected with tubercle bacilli. Adv Tuberc Res. 1976;19:1–63. - PubMed
    1. Barnett G, Grzybowski S, Styblo K. Present risk of developing active tuberculosis in Saskatchewan according to previous tuberculin and X-ray status. Bull Int Union Tuberc. 1971;45:51–74. - PubMed
    1. Houben RM, Dodd PJ. The global burden of latent tuberculosis infection: a re-estimation using mathematical modelling. PLoS Med. 2016;13:e1002152. - PMC - PubMed
    1. Yuen CM, Kammerer JS, Marks K, Navin TR, France AM. Recent transmission of tuberculosis—United States, 2011–2014. PLoS One. 2016;11:e0153728. - PMC - PubMed

Publication types