

Estimating Time to ESRD in Children With CKD
- PMID: 29653769
- PMCID: PMC5970998
- DOI: 10.1053/j.ajkd.2017.12.011
Estimating Time to ESRD in Children With CKD
Erratum in
-
Erratum Regarding "Estimating Time to ESRD in Children With CKD" (Am J Kidney Dis. 2018;71(6):783-792).Am J Kidney Dis. 2019 Jul;74(1):144. doi: 10.1053/j.ajkd.2019.04.010. Epub 2019 May 23. Am J Kidney Dis. 2019. PMID: 31128771 Free PMC article. No abstract available.
Abstract
Rationale & objective: The KDIGO (Kidney Disease: Improving Global Outcomes) guideline for chronic kidney disease (CKD) presented an international classification system that ranks patients' risk for CKD progression. Few data for children informed guideline development.
Study design: Observational cohort study.
Settings & participants: Children aged 1 to 18 years enrolled in the North American Chronic Kidney Disease in Children (CKiD) cohort study and the European Effect of Strict Blood Pressure Control and ACE Inhibition on the Progression of CRF in Pediatric Patients (ESCAPE) trial.
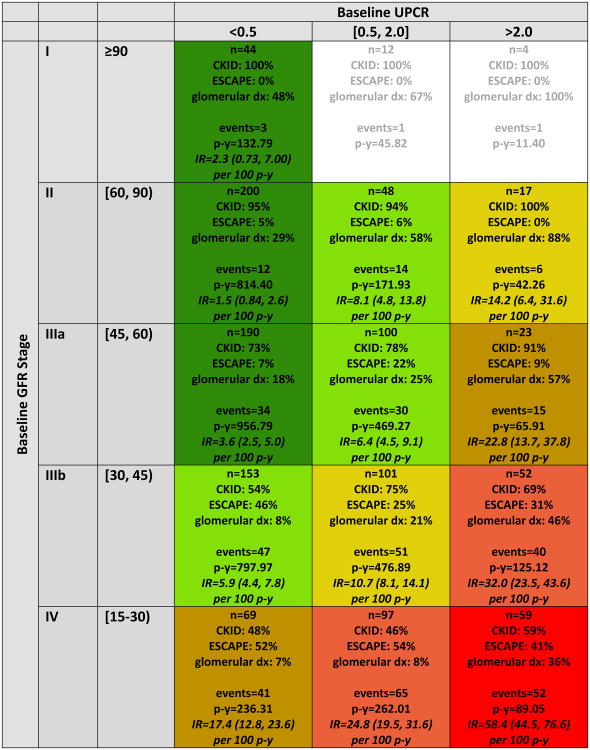
Predictor: Level of estimated glomerular filtration rate (eGFR) and proteinuria (urine protein-creatinine ratio [UPCR]) at study entry.
Outcome: A composite event of renal replacement therapy, 50% reduction in eGFR, or eGFR<15mL/min/1.73m2. eGFR was estimated using the CKiD-derived "bedside" equation.
Analytical approach: Accelerated failure time models of the composite outcome using a conventional generalized gamma distribution. Likelihood ratio statistics of nested models were used to amalgamate levels of similar risk.
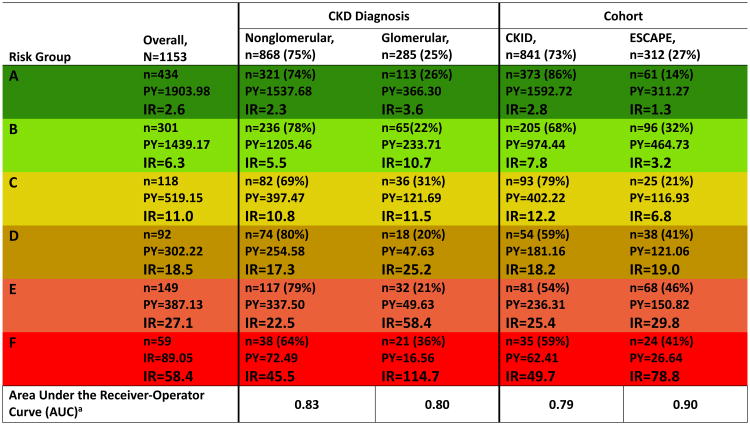
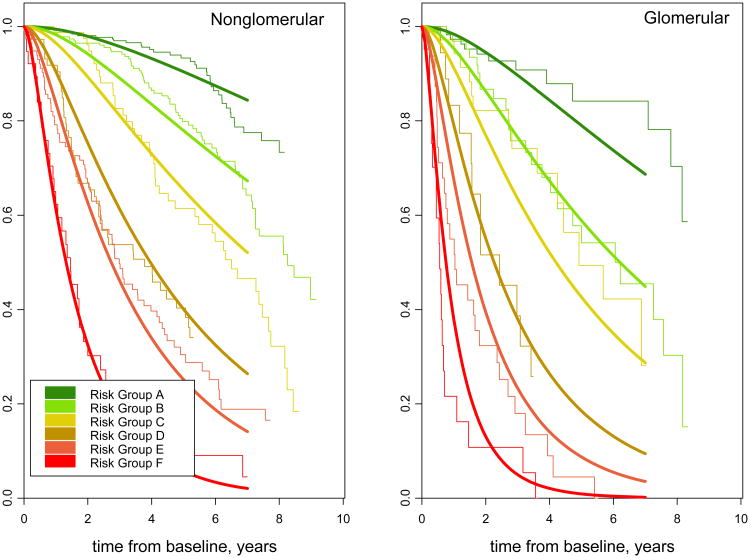
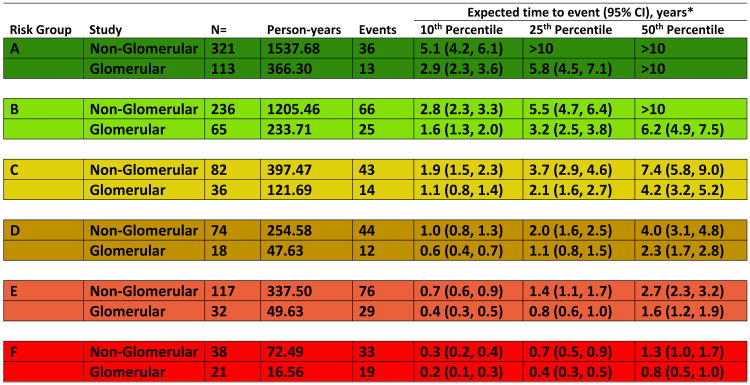
Results: Among 1,232 children, median age was 12 (IQR, 8-15) years, median eGFR was 47 (IQR, 33-62) mL/min/1.73m2, 60% were males, and 13% had UPCRs>2.0mg/mg at study entry. 6 ordered stages with varying combinations of eGFR categories (60-89, 45-59, 30-44, and 15-29mL/min/1.73m2) and UPCR categories (<0.5, 0.5-2.0, and >2.0mg/mg) described the risk continuum. Median times to event ranged from longer than 10 years for eGFRs of 45 to 90mL/min/1.73m2 and UPCRs<0.5mg/mg to 0.8 years for eGFRs of 15 to 30mL/min/1.73m2 and UPCRs>2mg/mg. Children with glomerular disease were estimated to have a 43% shorter time to event than children with nonglomerular disease. Cross-validation demonstrated risk patterns that were consistent across the 10 subsample validation models.
Limitations: Observational study, used cross-validation rather than external validation.
Conclusions: CKD staged by level of eGFR and proteinuria characterizes the timeline of progression and can guide management strategies in children.
Keywords: Pediatric; children; chronic kidney disease (CKD); disease progression; disease staging; end-stage renal disease (ESRD); estimated glomerular filtration rate (eGFR); proteinuria; risk pattern; urinary protein-creatinine ratio (UPCR).
Copyright © 2018 National Kidney Foundation, Inc. Published by Elsevier Inc. All rights reserved.
Figures
Comment in
-
More Realistic Estimation of Time to ESRD in Children.Am J Kidney Dis. 2018 Jun;71(6):766-768. doi: 10.1053/j.ajkd.2018.02.356. Am J Kidney Dis. 2018. PMID: 29801550 No abstract available.
-
In Reply to 'The Use of Estimated GFR-Based Staging in Children With CKD: Proceed With Care'.Am J Kidney Dis. 2018 Sep;72(3):464. doi: 10.1053/j.ajkd.2018.05.010. Epub 2018 Jul 23. Am J Kidney Dis. 2018. PMID: 30049547 No abstract available.
-
The Use of Estimated GFR-Based Staging in Children With CKD: Proceed With Care.Am J Kidney Dis. 2018 Sep;72(3):463-464. doi: 10.1053/j.ajkd.2018.05.011. Epub 2018 Jul 23. Am J Kidney Dis. 2018. PMID: 30049549 No abstract available.
References
-
- Eckardt KU, Coresh J, Devuyst O, Johnson RJ, Köttgen A, Levey AS, et al. Evolving importance of kidney disease: from subspecialty to global health burden. Lancet. 2013;382:158–69. - PubMed
-
- Levey AS, Stevens LA, Coresh J. Conceptual model of CKD: applications and implications. Am J Kidney Dis. 2009;53(S3):S4–16. - PubMed
-
- The Kidney Disease: Improving Global Outcomes (KDIGO) CKD Work Group. KDIGO 2012 Clinical Practice Guideline for the Evaluation and Management of Chronic Kidney Disease. Kidney International Suppl. 2013;3:1–150.
Publication types
MeSH terms
Grants and funding
LinkOut - more resources
Full Text Sources
Other Literature Sources
Medical
Research Materials
Miscellaneous
