. 2018 Aug;17(8):1637-1649.
doi: 10.1074/mcp.TIR117.000582. Epub 2018 Apr 13.

Remote Atmospheric Pressure Infrared Matrix-Assisted Laser Desorption-Ionization Mass Spectrometry (Remote IR-MALDI MS) of Proteins

Affiliations

Remote Atmospheric Pressure Infrared Matrix-Assisted Laser Desorption-Ionization Mass Spectrometry (Remote IR-MALDI MS) of Proteins

Benoit Fatou et al. Mol Cell Proteomics. 2018 Aug.

Abstract

Remote Infrared Matrix-Assisted Laser Desorption/Ionization (Remote IR-MALDI) system using tissue endogenous water as matrix was shown to enable in vivo real-time mass spectrometry analysis with minimal invasiveness. Initially the system was used to detect metabolites and lipids. Here, we demonstrate its capability to detect and analyze peptides and proteins. Very interestingly, the corresponding mass spectra show ESI-like charge state distribution, opening many applications for structural elucidation to be performed in real-time by Top-Down strategy. The charge states show no dependence toward laser wavelength or length of the transfer tube. Indeed, remote analysis can be performed 5 m away from the mass spectrometer without modification of spectra. On the contrary, addition of glycerol to water shift the charge state distributions toward even higher charge states. The desorption/ionization process is very soft, allowing to maintain protein conformation as in ESI. Observation of proteins and similar spectral features on tissue, when protein standards are deposited on raw tissue pieces, could potentially open the way to their direct analysis from biological samples. This also brings interesting features that could contribute to the understanding of IR MALDI ionization mechanism.

Keywords: Biophysical methods; Mass Spectrometry; Multiply Charged Ions; Protein Conformation; Protein Identification; Real-Time Analysis; Remote IR MALDI; SpiderMass; Tandem Mass Spectrometry; Top-Down.


Figures

Fig. 1.
Fig. 1.
Schematic representation of the Remote IR-MALDI prototype so-called SpiderMass system. The system is composed of three parts including a fibered laser tuned to 2.94 μm equipped with a hand-piece for maneuvering the laser beam onto surfaces, a Tygon® ND 100–65 transfer tubing line connected to the laser hand-piece on one end and to the inlet of the MS instrument on the other, and the MS instrument itself (here an Ion mobility QqTOF).
Fig. 2.
Fig. 2.
MS spectra recorded in positive mode using the Re-AP-IR-MALDI system for (A) angiotensin-I and (B) bovine ubiquitin in water/glycerol (1:1, v/v) as matrix. 2 μl of analyte at 5×10⁻⁴ m was deposited onto a glass slide and submitted to 5 s laser irradiation period (ca. 50 laser shots).
Fig. 3.
Fig. 3.
MS spectrum recorded in positive mode using the Re-AP-IR-MALDI system of a standard protein mix composed of bovine Insulin, bovine ubiquitin, cytochrome, C and myoglobin and prepared with glycerol/water (1:1, v/v) as matrix. 2 μl of standard protein mix was deposited onto a glass slide after dilution by a factor of 2 and submitted to 5 s laser irradiation period (ca. 50 laser shots).
Fig. 4.
Fig. 4.
MS2 spectrum of the precursor ion [M+7H]7+ (m/z 1224.4) and [M+8H]8 (m/z 1071.3) of bovine ubiquitin recorded in real-time in positive mode using the SpiderMass prototype. 2 μl of analyte at 5×10⁻⁴ m was deposited onto a glass slide and submitted to 5s laser irradiation period (ca. 50 laser shots).
Fig. 5.
Fig. 5.
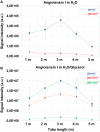
Evolution of the MS signal intensity (peak area, a.u.) of the protonated signals (singly-, doubly- and triply-charged if observed) of angiotensin I at varying transfer tube lengths. Water and glycerol/water (1:1, v/v) were used as matrix. Tube lengths of 0.01, 1, 2, 3, and 5 m were tested. 2 μl of analyte at 5×10⁻⁴ m was deposited onto a glass slide and submitted to 5s laser irradiation period (ca. 50 laser shots).
Fig. 6.
Fig. 6.
Evolution of the MS spectra of bovine ubiquitin with the temperature of the transfer tube (for 2 m transfer tube length). Glycerol/water (1:1, v/v) was used as matrix. (A) T = 20 °C, (B) T = 40 °C and (C) T = 60 °C. Signals in the low m/z range [100–400] are attributed to pyrolysis products released by the heated coil at the interface of the mass spectrometer and are not coming from the analyte. 2 μl of analyte at 5×10⁻⁴ m was deposited onto a glass slide and submitted to 5s laser irradiation period (ca. 50 laser shots).
Fig. 7.
Fig. 7.
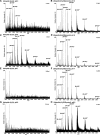
Evolution of the MS spectra of bovine ubiquitin as a function of solution pH, recorded using the Re-AP-IR-MALDI system in the positive mode and using water (A, C, E, G) or glycerol/water (1:1, v/v) (B, D, F, H) as matrix. (A, B) pH 3, (C, D) pH 5, (E, F) pH 7, (G, H) pH 9. The transfer tube length was fixed at 3 m. 2 μl of analyte at 5×10⁻⁴ m was deposited onto a glass slide and submitted to 5s laser irradiation period (ca. 50 laser shots).
Fig. 8.
Fig. 8.
MS spectra recorded in positive mode using the Remote IR-MALDI system of a standard protein mix composed of bovine Insulin, bovine ubiquitin, cytochrome C, and myoglobin prepared in glycerol/water. A, Solution is spotted onto a glass slide or, on a raw piece of bovine liver tissue. Analyses were conducted after complete absorption of the solution by the tissue. Spectrum shows the presence of both endogenous signals from the tissue (especially lipid signals in the lower m/z range) as well as the exogenous standard proteins. Samples was submitted to 5s laser irradiation periods (ca. 50 laser shots).
Fig. 9.
Fig. 9.
Schematic representation of desorption/ionization mechanism occurring in the Remote IR-MALDI (SpiderMass) system.

References

    1. Huang M. Z., Cheng S. C., Cho Y. T., and Shiea J. (2011) Ambient ionization mass spectrometry: a tutorial. Anal. Chim. Acta 702, 1–15 - PubMed
    1. Harris G. A., Galhena A. S., and Fernandez F. M. (2011) Ambient sampling/ionization mass spectrometry: applications and current trends. Anal. Chem. 83, 4508–4538 - PubMed
    1. Alberici R. M., Simas R. C., Sanvido G. B., Romão W., Lalli P. M., Benassi M., Cunha I. B., and Eberlin M. N. (2010) Ambient mass spectrometry: bringing MS into the “real world”. Anal. Bioanal. Chem. 398, 265–294 - PubMed
    1. Wu C., Dill A. L., Eberlin L. S., Cooks R. G., and Ifa D. R. (2013) Mass spectrometry imaging under ambient conditions. Mass Spectrometry Rev. 32, 218–243 - PMC - PubMed
    1. Ferreira C. R., Yannell K. E., Jarmusch A. K., Pirro V., Ouyang Z., and Cooks R. G. (2016) Ambient ionization mass spectrometry for point-of-care diagnostics and other clinical measurements. Clin. Chem. 62, 99–110 - PMC - PubMed

Publication types

MeSH terms