. 2018 May 24;131(21):2335-2344.
doi: 10.1182/blood-2018-02-835561. Epub 2018 Apr 13.

Patients with CD3G mutations reveal a role for human CD3γ in Treg diversity and suppressive function

Affiliations

Patients with CD3G mutations reveal a role for human CD3γ in Treg diversity and suppressive function

Jared H Rowe et al. Blood. .

Abstract

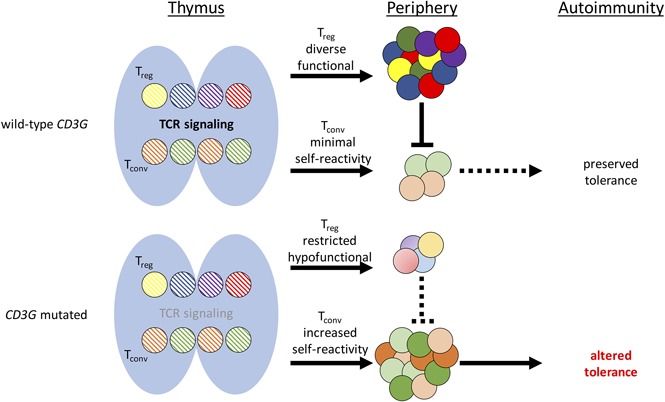
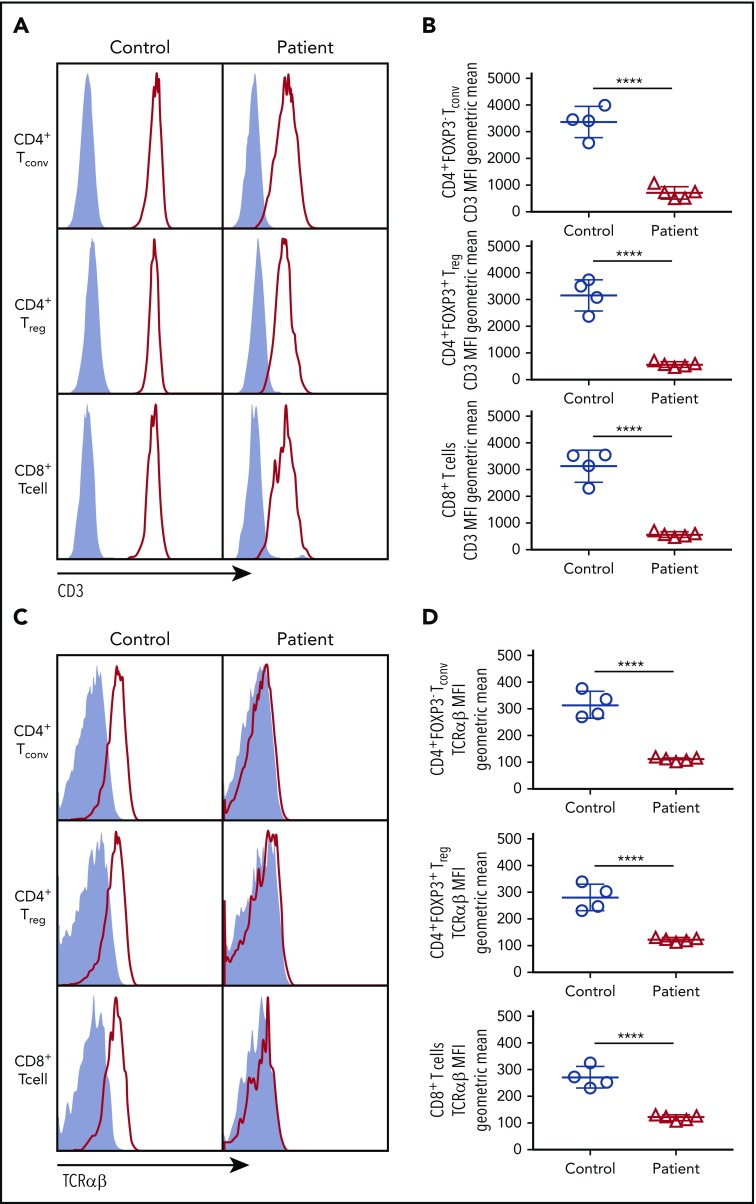
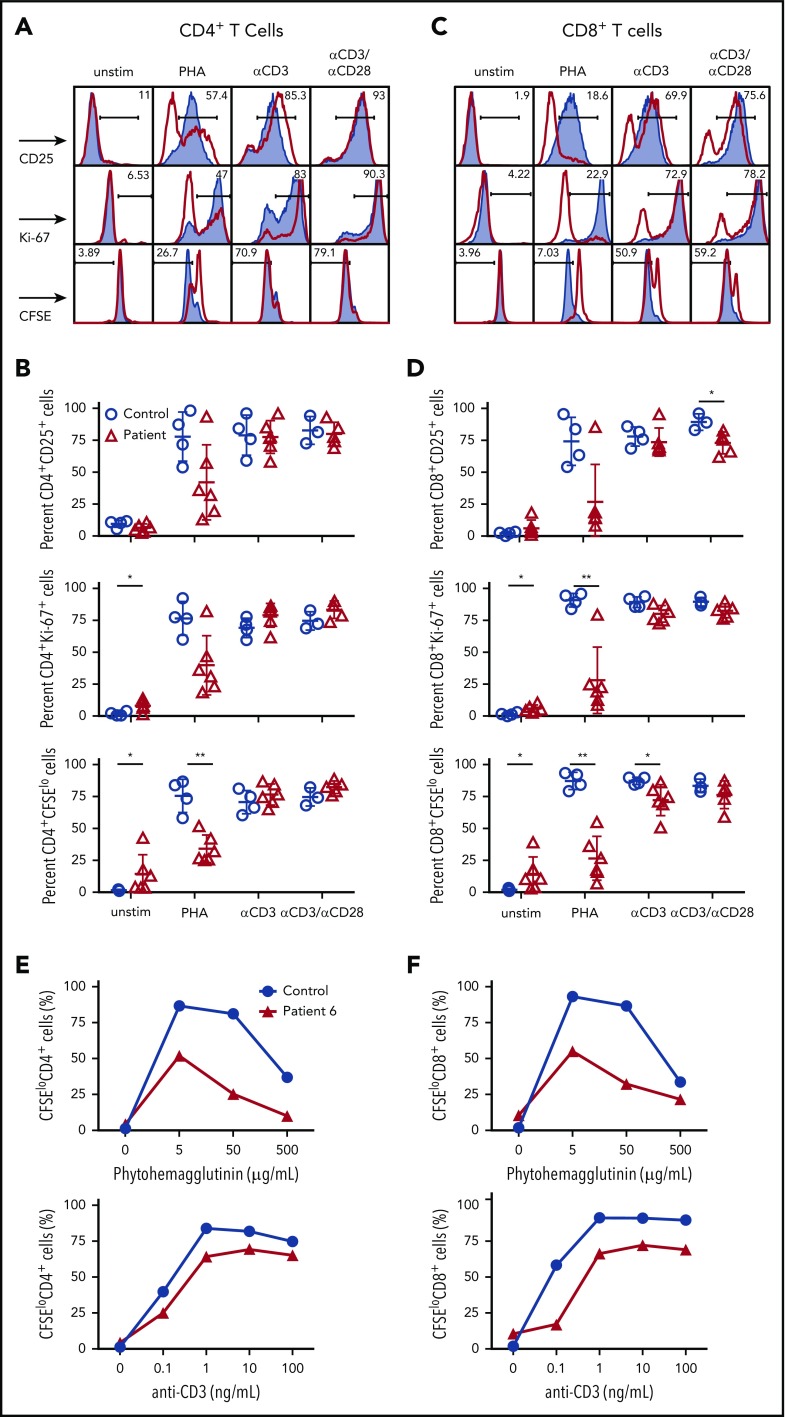
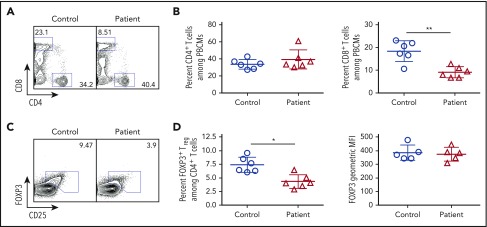
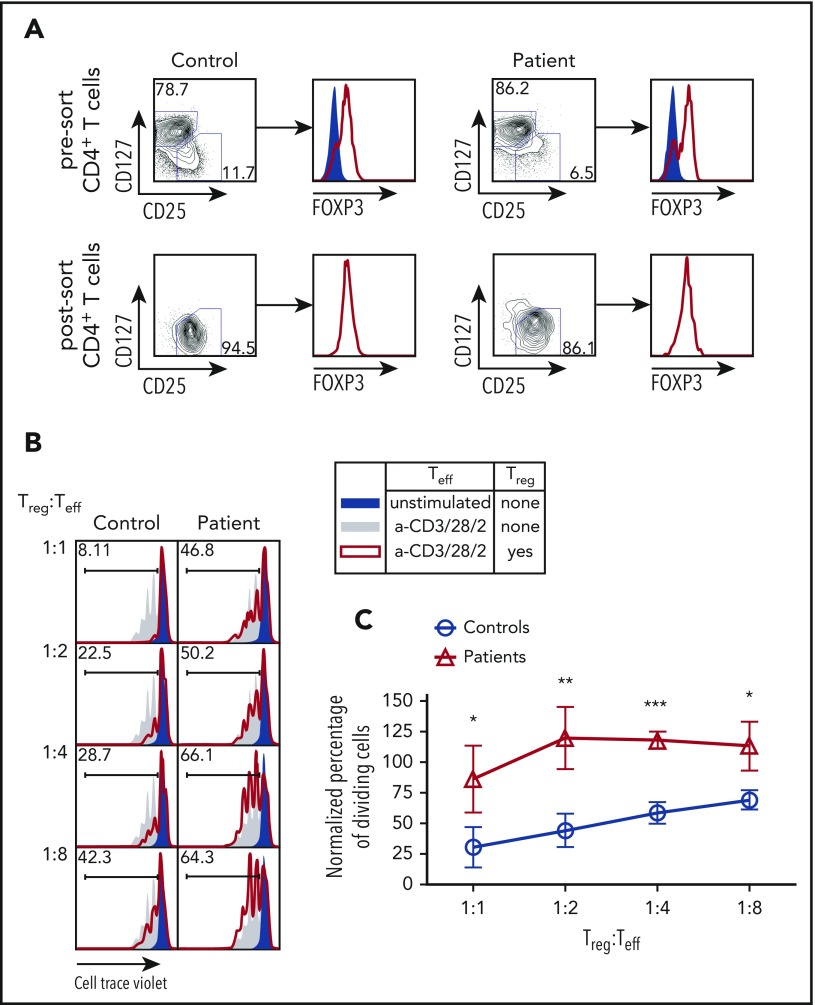
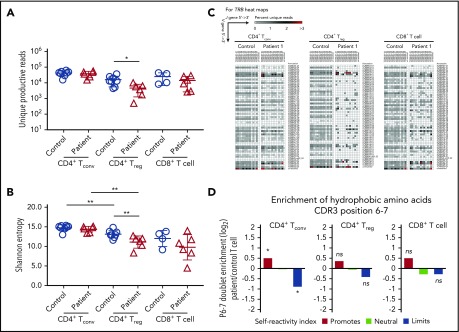
Integrity of the T-cell receptor/CD3 complex is crucial for positive and negative selection of T cells in the thymus and for effector and regulatory functions of peripheral T lymphocytes. In humans, CD3D, CD3E, and CD3Z gene defects are a cause of severe immune deficiency and present early in life with increased susceptibility to infections. By contrast, CD3G mutations lead to milder phenotypes, mainly characterized by autoimmunity. However, the role of CD3γ in establishing and maintaining immune tolerance has not been elucidated. In this manuscript, we aimed to investigate abnormalities of T-cell repertoire and function in patients with genetic defects in CD3G associated with autoimmunity. High throughput sequencing was used to study composition and diversity of the T-cell receptor β (TRB) repertoire in regulatory T cells (Tregs), conventional CD4+ (Tconv), and CD8+ T cells from 6 patients with CD3G mutations and healthy controls. Treg function was assessed by studying its ability to suppress proliferation of Tconv cells. Treg cells of patients with CD3G defects had reduced diversity, increased clonality, and reduced suppressive function. The TRB repertoire of Tconv cells from patients with CD3G deficiency was enriched for hydrophobic amino acids at positions 6 and 7 of the CDR3, a biomarker of self-reactivity. These data demonstrate that the T-cell repertoire of patients with CD3G mutations is characterized by a molecular signature that may contribute to the increased rate of autoimmunity associated with this condition.


Conflict of interest statement

Conflict-of-interest disclosure: The authors declare no competing financial interests.

Figures

None
Graphical abstract
Figure 1.
Figure 1.
CD3 and TCRαβ expression on the surface of T-cell subsets. (A) Expression of CD3 (red line) or isotype (solid gray) on the surface of CD4+ FOXP3 Tconv, CD4+FOXP3+ Treg, and CD8+ T cells. (B) Cumulative data of geometric mean for mean fluorescence intensity of CD3 surface expression among Tconv, Treg, or CD8+ cells. (C) Expression of TCRαβ (red line) or isotype (solid gray) on the surface of Tconv, Treg. and CD8+cells. (D) Cumulative data of geometric mean for mean fluorescence intensity of TCRαβ surface expression among Tconv, Treg, and CD8+ cells. (B,D) Five patients (P1-P5) were studied.
Figure 2.
Figure 2.
T-cell activation and cell division following mitogen stimulation. (A) Representative plots and (B) cumulative percentage of (top) CD25 expression, (middle) Ki67 expression, and (bottom) CFSE staining in CD4+ T cells from controls (solid gray) or CD3G patients (red) in unstimulated samples or following activation with PHA, anti-CD3, or anti-CD3/CD28. (C) Representative plots and (D) cumulative data for (top) CD25 expression, (middle) Ki67 expression, and (bottom) CFSE staining in CD8+ T cells from controls (solid gray) or patients (red) among the indicated groups. (A-D) Response to anti-CD3+anti-CD28 was studied in 5 patients (P1-P5) because not enough cells were available from P6. Dose titration curve of CFSE dilution among (E) CD4+ and (F) CD8+ T cells following stimulation with PHA (top) or anti-CD3 (bottom) for patient P6 (red line) and control sample (blue line). Unstim, unstimulated.
Figure 3.
Figure 3.
Flow cytometric analysis of peripheral blood lymphocyte populations in patients with CD3G mutations. (A) Representative flow cytometry plots for circulating CD4+ and CD8+ T lymphocytes in controls and CD3G-mutated patients. (B) Percentage of CD4+ (left) and CD8+ (right) T cells among PBMCs for control and CD3G-mutated patients. (C). Representative flow cytometry for Treg identification by FOXP3 and CD25 expression. (D) Percentage (left) of FOXP3+ Treg cells and FOXP3 mean fluorescence intensity (right) for controls and patients.
Figure 4.
Figure 4.
Treg suppression assay from fluorescent activated cell sorting purified Treg cells in CD3G-mutated patients. (A) CD25hiCD127lo Treg sort purification strategy from control (left) and patient (right) samples. Intranuclear FOXP3 staining was performed on CD25loCD127hi Teff cells (solid blue) and CD25hiCD127lo Treg cells (red line). (B) Representative plots of Cell Trace Violet dilution in experiments in which CD4+ CD25low CD127hi Teff cells from controls were either left unstimulated (solid blue) or stimulated with anti-CD3 + anti-CD28 + anti-CD2, in the absence (solid gray) or presence (red line) of Treg cells from controls (left) or from CD3G-mutated patients (right). (C) Cumulative percentage of dividing cells in Treg suppression assay, normalized to the no Treg group within each individual experiment. Treg function was tested in 4 patients (P2-P5) and 4 controls. Results are expressed as mean ± standard deviation. *P < .05; **P < .01; ***P < .001.
Figure 5.
Figure 5.
HTS analysis of TRB repertoire in CD4+Treg, CD4+Tconv, and CD8+T-cell subsets. (A) Number of unique reads identified in each patient for Treg, Tconv, and CD8+ T cells and (B) Shannon entropy index calculated among unique reads for Treg, Tconv, and CD8+ T cells. (A-B) *P < .05; **P < .01. (C) Representative heat maps depicting and gene pairing in unique sequences from (left) CD4+ Tconv, (middle) CD4+ Treg, and (right) CD8+ T cells from controls and patient 1. (D) Hydrophobicity analysis of amino acid residues at positions 6 and 7 of the TRB-CDR3 in (left) CD4+ Tconv, (middle) CD4+ Treg, and (right) CD8+ T cells from CD3G-mutated patients (n = 6) compared with controls (n = 8). *P < 10−4.

References

    1. Call ME, Wucherpfennig KW. The T cell receptor: critical role of the membrane environment in receptor assembly and function. Annu Rev Immunol. 2005;23(1):101-125. - PubMed
    1. Alarcón B, Gil D, Delgado P, Schamel WW. Initiation of TCR signaling: regulation within CD3 dimers. Immunol Rev. 2003;191(1):38-46. - PubMed
    1. Picard C, Bobby Gaspar H, Al-Herz W, et al. International Union of Immunological Societies: 2017 Primary Immunodeficiency Diseases Committee Report on Inborn Errors of Immunity. J Clin Immunol. 2018;38(1):96-128. - PMC - PubMed
    1. Dadi HK, Simon AJ, Roifman CM. Effect of CD3delta deficiency on maturation of alpha/beta and gamma/delta T-cell lineages in severe combined immunodeficiency. N Engl J Med. 2003;349(19):1821-1828. - PubMed
    1. de Saint Basile G, Geissmann F, Flori E, et al. Severe combined immunodeficiency caused by deficiency in either the delta or the epsilon subunit of CD3. J Clin Invest. 2004;114(10):1512-1517. - PMC - PubMed

Publication types