Observational Study
. 2018 Apr 13;8(4):e019809.
doi: 10.1136/bmjopen-2017-019809.

Can microstructural MRI detect subclinical tissue injury in subjects with asymptomatic cervical spinal cord compression? A prospective cohort study

Affiliations
Observational Study

Can microstructural MRI detect subclinical tissue injury in subjects with asymptomatic cervical spinal cord compression? A prospective cohort study

Allan R Martin et al. BMJ Open. .

Abstract

Objectives: Degenerative cervical myelopathy (DCM) involves extrinsic spinal cord compression causing tissue injury and neurological dysfunction. Asymptomatic spinal cord compression (ASCC) is more common, but its significance is poorly defined. This study investigates if: (1) ASCC can be automatically diagnosed using spinal cord shape analysis; (2) multiparametric quantitative MRI can detect similar spinal cord tissue injury as previously observed in DCM.

Design: Prospective observational longitudinal cohort study.

Setting: Single centre, tertiary care and research institution.

Participants: 40 neurologically intact subjects (19 female, 21 male) divided into groups with and without ASCC.

Interventions: None.

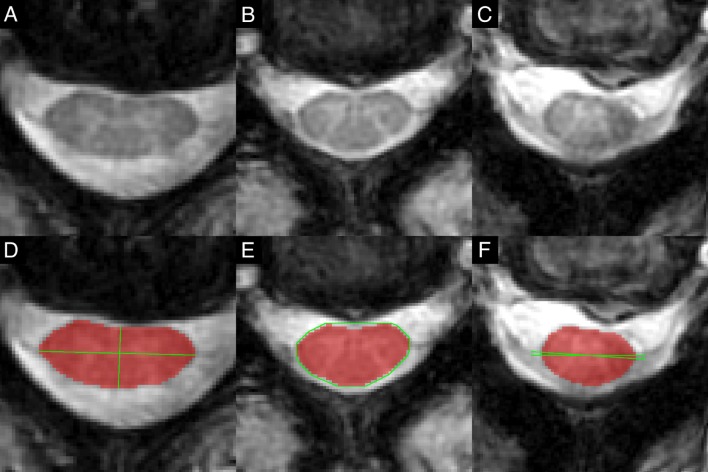
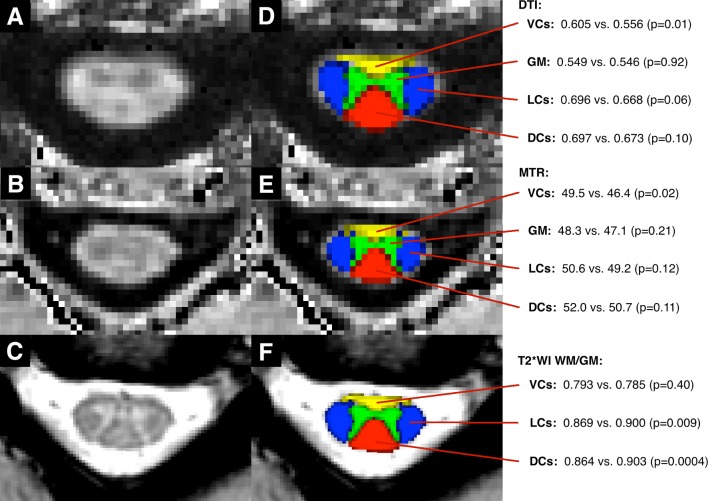
Outcome measures: Clinical assessments: modified Japanese Orthopaedic Association score and physical examination. 3T MRI assessments: automated morphometric analysis compared with consensus ratings of spinal cord compression, and measures of tissue injury: cross-sectional area, diffusion fractional anisotropy, magnetisation transfer ratio and T2*-weighted imaging white to grey matter signal intensity ratio (T2*WI WM/GM) extracted from rostral (C1-3), caudal (C6-7) and maximally compressed levels.

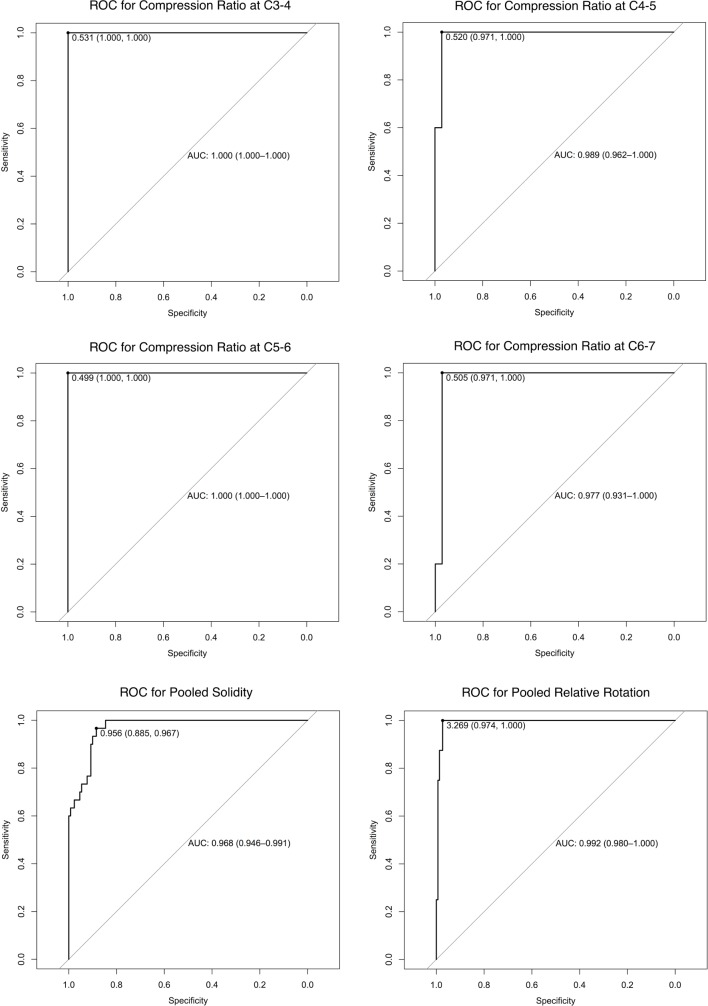
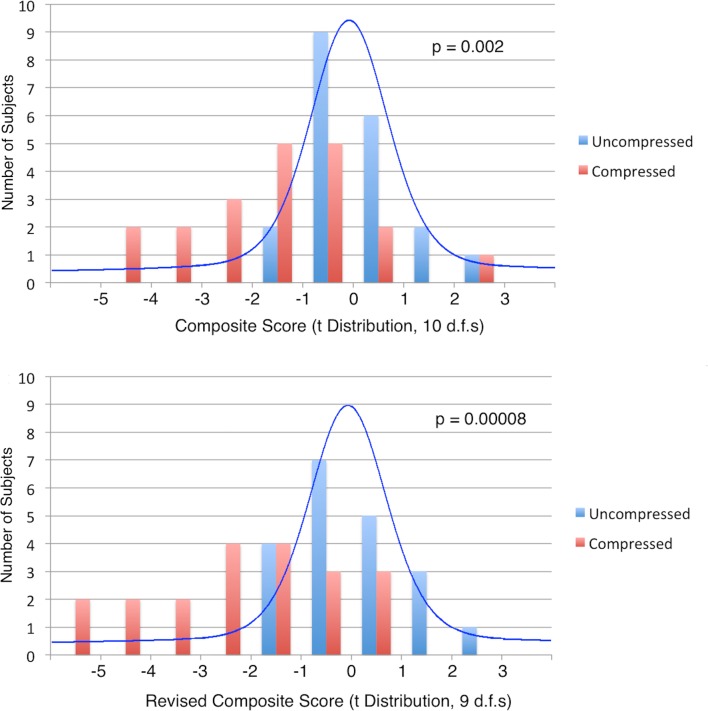
Results: ASCC was present in 20/40 subjects. Diagnosis with automated shape analysis showed area under the curve >97%. Five MRI metrics showed differences suggestive of tissue injury in ASCC compared with uncompressed subjects (p<0.05), while a composite of all 10 measures (average of z scores) showed highly significant differences (p=0.002). At follow-up (median 21 months), two ASCC subjects developed DCM.

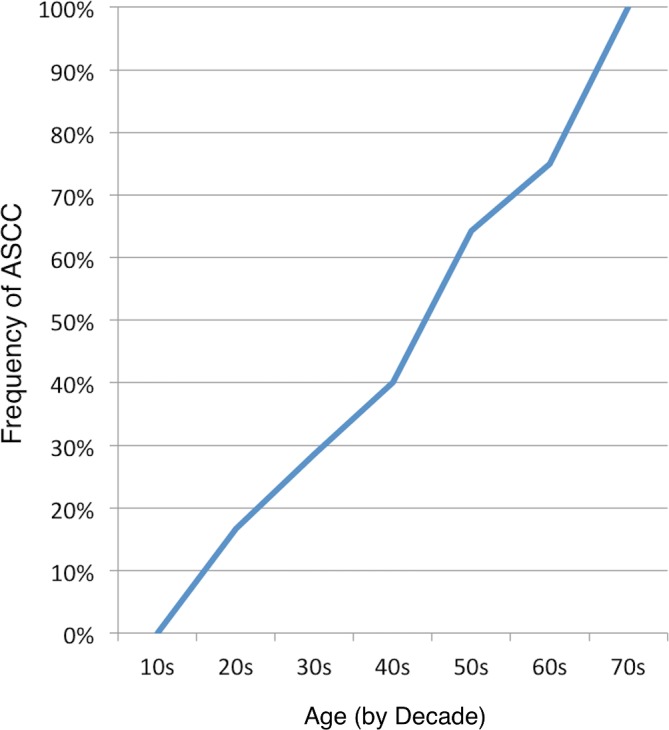
Conclusions: ASCC appears to be common and can be accurately and objectively diagnosed with automated morphometric analysis. Quantitative MRI appears to detect subclinical tissue injury in ASCC prior to the onset of neurological symptoms and signs. These findings require further validation, but offer the intriguing possibility of presymptomatic diagnosis and treatment of DCM and other spinal pathologies.

Keywords: diffusion tensor imaging; magnetization transfer; myelopathy; preclinical; quantitative mri; spinal cord injury.


Conflict of interest statement

Competing interests: None declared.

Figures

Figure 1
Figure 1
Automatic shape analysis. T2*WI of asymptomatic subjects showing flattening (A), indentation (B) and torsion (C) of the spinal cord. (D) The spinal cord segmentation (red) is analysed with 2D PCA to identify the long (transverse) and short (AP) axes (green) that intersect at the centre of mass, and CR is calculated as ratio of AP to transverse diameters to measure flattening. (E) A convex hull (green) is computed that surrounds the segmentation (red), and solidity is calculated as the ratio of segmented area to subtended area. (F) The angle between the transverse axis and horizontal is computed, and then relative rotation is calculated as the ratio between the current slice and average angle in slices above and below. AP, anterior–posterior; CR, compression ratio; PCA, principal component analysis; T2*WI, T2*-weighted imaging.
Figure 2
Figure 2
Receiver operating characteristic (ROC) curves for diagnosis of spinal cord compression using automated morphometric analysis. The results of automated shape analysis to diagnose spinal cord compression were compared against consensus ratings and ROC curves were plotted. The optimal threshold (maximising Youden’s Index) is displayed, along with the sensitivity and specificity at that level. 95% CIs for area under the curve (AUC) are calculated using the Delong method.
Figure 3
Figure 3
Frequency of ASCC by decade. The frequency of ASCC is plotted against decade of life, with data for each decade provided in parentheses. ASCC, asymptomatic spinal cord compression.
Figure 4
Figure 4
Distributions of composite scores. Top: histograms (bars) of composite scores (average of the z scores of 10 MRI metrics) are displayed for subjects with asymptomatic spinal cord compression (ASCC) (red) and no cord compression (blue). The expected distribution of results based on the null hypothesis (t-distribution with 10 df) is superimposed. Six ASCC subjects had abnormally low composite score (t10≤2.23) and group differences were significant (Wilcoxon signed-rank test: p=0.002). Bottom: the same plot is displayed for a revised composite score that replaces rostral and maximally compressed levels cross-sectional area (CSA) measures with CSA ratio, and the corresponding t-distribution with 9 df. Nine ASCC subjects had abnormal scores (t9 ≤2.26) and stronger group differences were found (p=0.00008).
Figure 5
Figure 5
Quantitative MRI metrics by anatomical structure. Images include a FA map (A), a MTR map (B) and a T2*-weighted image (C) of C3–4 in an uncompressed subject. Panels (D–F) The SCT probabilistic maps of the VCs (yellow), LCs (blue), DCs (red) and GM (green) overlaid. DCs, dorsal columns; DTI, diffusion tensor imaging; FA, fractional anisotropy; GM, grey matter; LCs, lateral columns; MTR, magnetisation transfer ratio; SCT, Spinal Cord Toolbox; VCs, ventral columns, T2*WI WM/GM, T2*-weighted imaging white to grey matter.

Similar articles

Cited by

References

    1. Nouri A, Tetreault L, Singh A, et al. Degenerative cervical myelopathy: epidemiology, genetics, and pathogenesis. Spine 2015;40:E675–93. 10.1097/BRS.0000000000000913 - DOI - PubMed
    1. Kalsi-Ryan S, Karadimas SK, Fehlings MG. Cervical spondylotic myelopathy: the clinical phenomenon and the current pathobiology of an increasingly prevalent and devastating disorder. Neuroscientist 2013;19:409–21. 10.1177/1073858412467377 - DOI - PubMed
    1. Teresi LM, Lufkin RB, Reicher MA, et al. Asymptomatic degenerative disk disease and spondylosis of the cervical spine: MR imaging. Radiology 1987;164:83–8. 10.1148/radiology.164.1.3588931 - DOI - PubMed
    1. Boden SD, McCowin PR, Davis DO, et al. Abnormal magnetic-resonance scans of the cervical spine in asymptomatic subjects. A prospective investigation. J Bone Joint Surg Am 1990;72:1178–84. 10.2106/00004623-199072080-00008 - DOI - PubMed
    1. Matsumoto M, Fujimura Y, Suzuki N, et al. MRI of cervical intervertebral discs in asymptomatic subjects. J Bone Joint Surg Br 1998;80:19–24. 10.1302/0301-620X.80B1.7929 - DOI - PubMed

Publication types