. 2018 Jul;29(7):1849-1858.
doi: 10.1681/ASN.2017111179. Epub 2018 Apr 13.

Glycine Amidinotransferase (GATM), Renal Fanconi Syndrome, and Kidney Failure

Affiliations

Glycine Amidinotransferase (GATM), Renal Fanconi Syndrome, and Kidney Failure

Markus Reichold et al. J Am Soc Nephrol. 2018 Jul.

Abstract

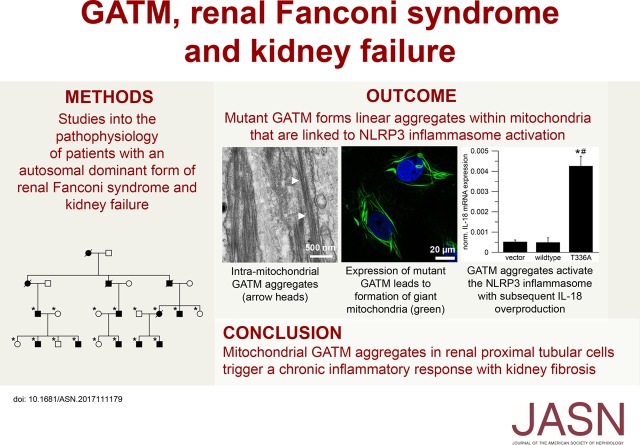
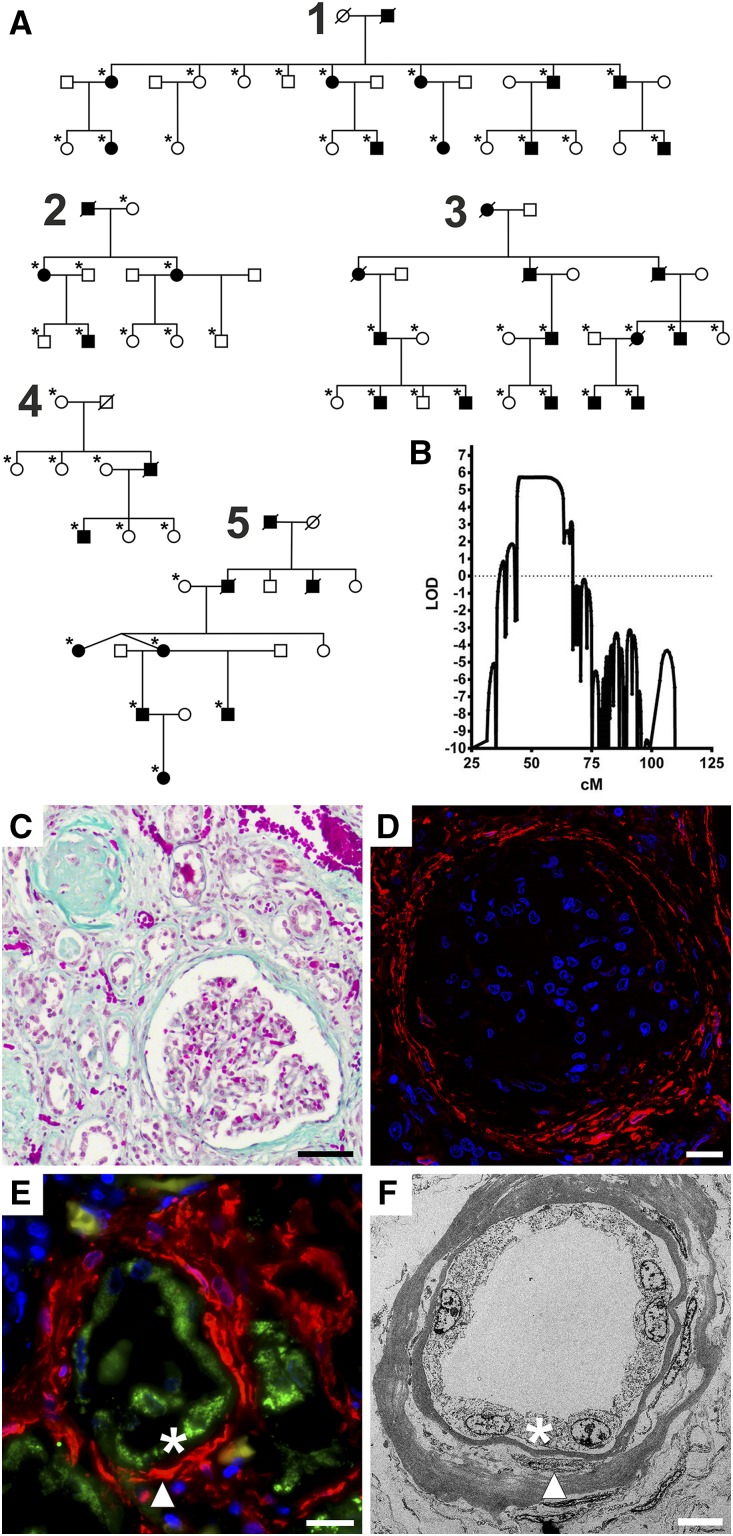
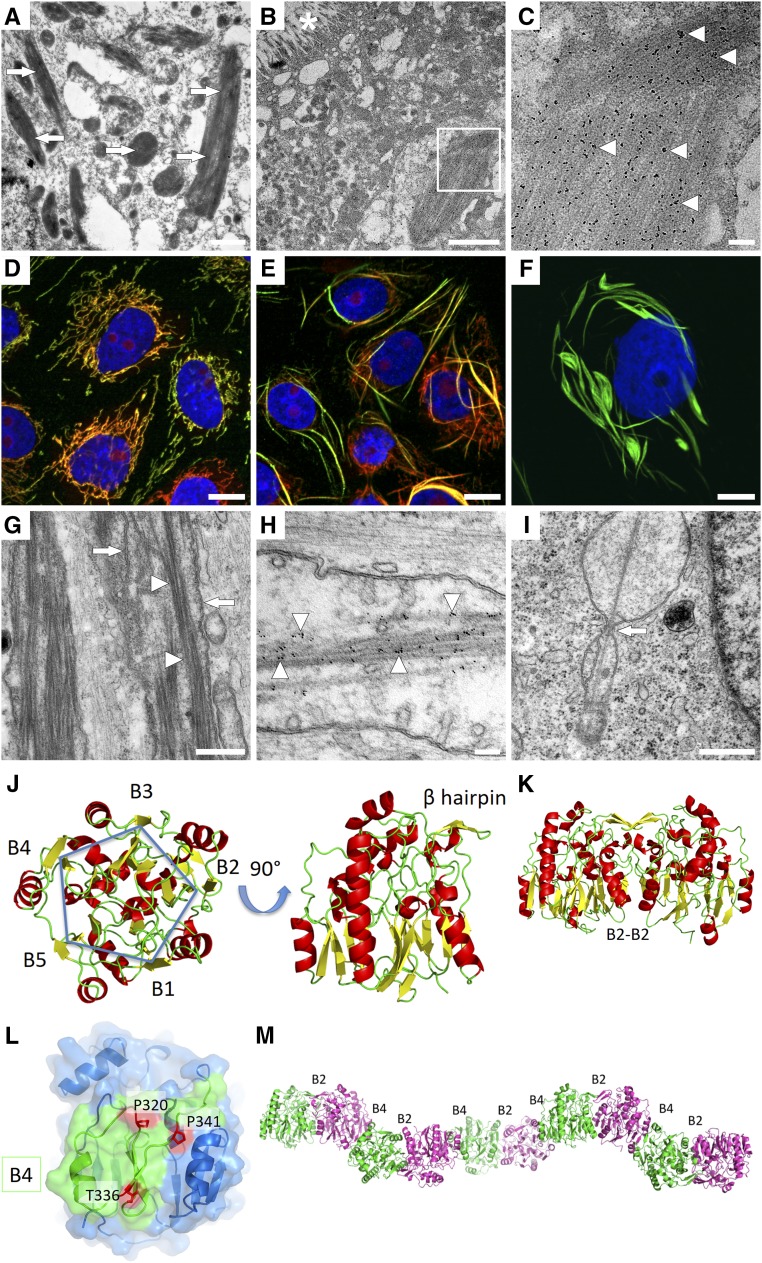
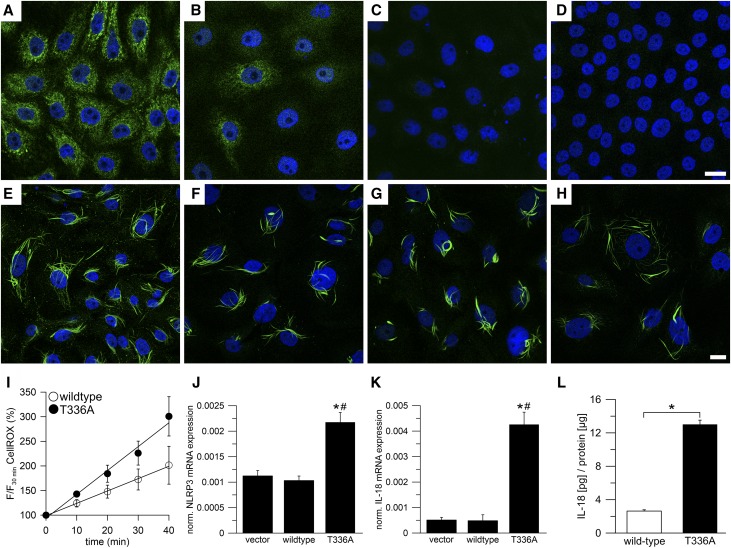
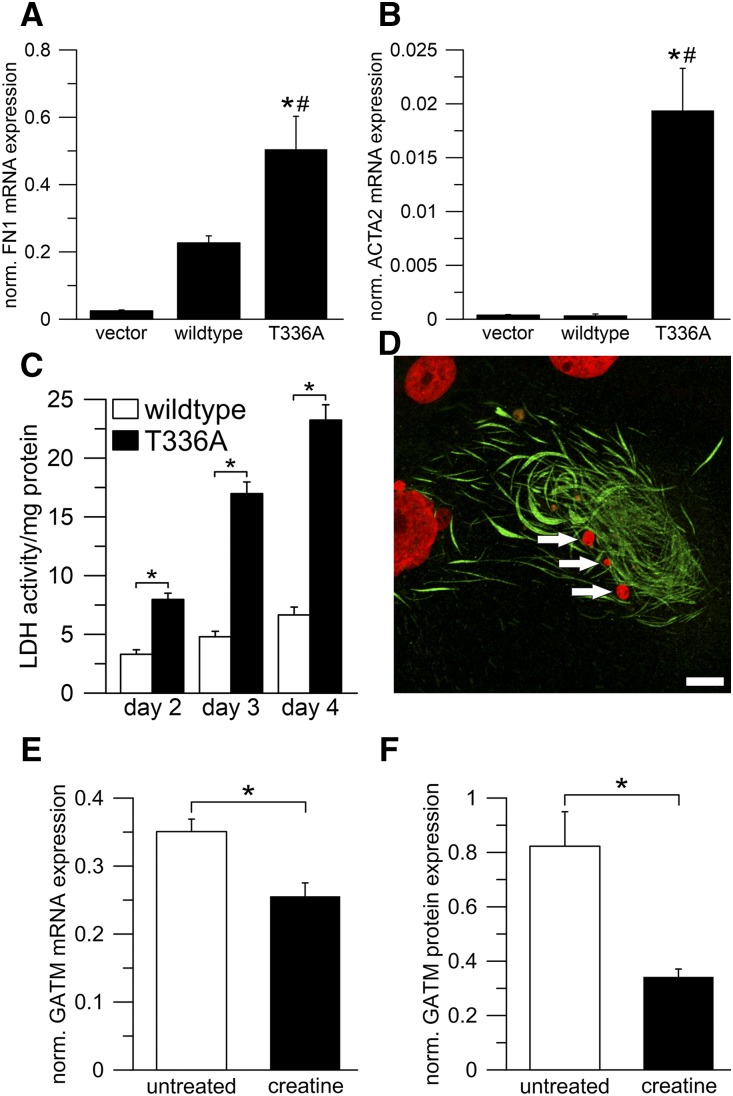
Background For many patients with kidney failure, the cause and underlying defect remain unknown. Here, we describe a novel mechanism of a genetic order characterized by renal Fanconi syndrome and kidney failure.Methods We clinically and genetically characterized members of five families with autosomal dominant renal Fanconi syndrome and kidney failure. We performed genome-wide linkage analysis, sequencing, and expression studies in kidney biopsy specimens and renal cells along with knockout mouse studies and evaluations of mitochondrial morphology and function. Structural studies examined the effects of recognized mutations.Results The renal disease in these patients resulted from monoallelic mutations in the gene encoding glycine amidinotransferase (GATM), a renal proximal tubular enzyme in the creatine biosynthetic pathway that is otherwise associated with a recessive disorder of creatine deficiency. In silico analysis showed that the particular GATM mutations, identified in 28 members of the five families, create an additional interaction interface within the GATM protein and likely cause the linear aggregation of GATM observed in patient biopsy specimens and cultured proximal tubule cells. GATM aggregates-containing mitochondria were elongated and associated with increased ROS production, activation of the NLRP3 inflammasome, enhanced expression of the profibrotic cytokine IL-18, and increased cell death.Conclusions In this novel genetic disorder, fully penetrant heterozygous missense mutations in GATM trigger intramitochondrial fibrillary deposition of GATM and lead to elongated and abnormal mitochondria. We speculate that this renal proximal tubular mitochondrial pathology initiates a response from the inflammasome, with subsequent development of kidney fibrosis.

Keywords: AGAT; fibrosis; mitochondriopathy; protein deposits; tubulopathy.


Figures

None
Graphical abstract
Figure 1.
Figure 1.
Pedigrees of families with autosomal dominant renal Fanconi syndrome and kidney failure and kidney specimens with signs of renal fibrosis. (A) Pedigrees of families with renal Fanconi syndrome and kidney failure. Squares indicate men, and circles indicate women. A black symbol indicates that the person is affected; deceased individuals are drawn with a diagonal line through the symbol. An asterisk indicates that the person contributed to linkage and sequencing studies. Note the de novo “appearance” of the disease in family 4. (B) Multipoint parametric linkage analysis for families 3–5 for chromosome 15. The y axis shows the logarithm (base 10) of odds (LOD) score, and the x axis gives the genetic distance in centimorgan. Note significant linkage (LOD score >3) in the region of 40–60 cM. (C) Masson–Goldner staining of a postmortem kidney specimen from a patient with renal Fanconi and kidney failure. Connective tissue is stained light green. This specimen shows the highly fibrotic terminal kidney morphology of the disease. The cortex is shrunken and contains very few proximal tubules. Most glomeruli as well as the tubules are atrophic and fibrotic (upper left corner), and some appear intact (lower right corner). Scale bar, 50 μm. (D) Immunofluorescence of same specimen as in C. α-Smooth muscle actin (a marker for myofibroblasts) is red, and nuclei are blue. The Bowman capsule of the glomerulus contains myofibroblasts (red), which suggests that the kidney damage is not restricted to proximal tubules during the final stage of the disease. Scale bar, 20 μm. (E) Immunofluorescence of same specimen as in C. Glycine amidinotransferase (GATM) is green, α-smooth muscle actin (a marker for myofibroblasts) is red, and nuclei are blue. The picture shows a proximal tubule with GATM-positive epithelium (asterisk). Several layers of myofibroblasts (arrowhead) surround the tubule. Scale bar, 20 μm. (F) Electron microscopy of same specimen as in C. Most tubules show an extremely thick basal membrane containing myofibroblasts (arrowhead). Tubular epithelium is marked by an asterisk. Scale bar, 7 μm.
Figure 2.
Figure 2.
Mutant GATM proteins form intramitochondrial filaments due to a mutation-induced additional interaction site that allows linear aggregation of GATM dimers. (A) Electron microscopy of a proximal tubular cell from a patient’s biopsy showing giant mitochondria with deposits (arrows). Scale bar, 1 μm. (B) Glycine amidinotransferase (GATM) immunogold electron microscopy of a proximal tubular cell with an enlarged, filament-containing mitochondrion from a patient’s biopsy. Asterisk indicates proximal tubule brush border membrane. Scale bar, 2 μm. (C) Higher magnification of B (white square). Note the packed linear deposits with 6-nm GATM-specific gold particles attached (arrowheads). Scale bar, 200 nm. (D) Immunofluorescence of LLC-PK1 renal proximal tubular cells with induced expression (3 days) of wild-type GATM (green). Normal mitochondria are in red (Mitotracker), and nuclei are in blue. Scale bar, 20 μm. (E) Immunofluorescence of LLC-PK1 cells with induced expression (3 days) of mutant GATM (T336A; green) and abnormal mitochondria (red). Nuclei are in blue. Scale bar, 20 μm. (F) Immunofluorescence of LLC-PK1 cells with induced expression (9 weeks) of mutant GATM (green) causing large deposits. Nucleus is in blue. Scale bar, 10 μm. (G) Electron microscopy of an LLC-PK1 cell overexpressing the T336A mutant. Within the mitochondrial matrix, GATM filaments were aligned in a parallel manner (arrowheads). Cristae are marked by arrows. Scale bar, 500 nm. (H) Immunogold electron microscopy of mutant GATM (T336A) in LLC-PK1 cells. Intramitochondrial gold particles attached to linear long aggregates (arrowheads) indicate that GATM comprises these deposits. Scale bar, 100 nm. (I) Electron microscopy of LLC-PK1 cells overexpressing the P341L mutant in LLC-PK1 cells. A GATM filament appears to prevent mitochondrial fission (arrow). Scale bar, 500 nm. (J) Wild-type GATM in two orientations rotated by 90° around the horizontal axis colored by secondary structures: yellow β-sheets, green loops, and red α-helices. In the left orientation, the fivefold symmetry with the five β-sheets B1–B5 is visible. In the right orientation, the β-hairpin involved in wild-type homodimer formation becomes visible. (K) The wild-type homodimer is stabilized by interaction of β-sheets B2. (L) Mutated GATM. Surface of the B4 module (green) shows the mutated amino acids in red. Remainder of GATM is blue. Localization of all observed mutations (p.P320S, p.T336A, p.T336I, and p.P341L) on the same surface leads to the appearance of a novel additional interaction site. (M) Proposed disease mechanism in which the creation of an additional mutation-related novel interaction site in the B4 module can lead to aggregation of GATM multimers instead of the physiologic homodimer; B2 denotes physiologic interaction site forming enzymatically active GATM. B4 denotes additional interaction site opposite the B2 module mediating longitudinal GATM aggregation. Monomers carrying the mutation are shown in green and cyan, respectively.
Figure 3.
Figure 3.
Intramitochondrial filaments of mutant GATM escape degradation and are associated with increased ROS production and activation of the NLRP3 inflammasome. (A–D) LLC-PK1 cells, induced with tetracycline for 2 weeks, overexpressed wild-type glycine amidinotransferase (GATM). Induction was discontinued to stop further overexpression. GATM was immunolabeled immediately after (A) discontinuing tetracycline or (B) 4, (C) 6, and (D) 8 weeks. At week 4, the GATM signal (green) was very faint, and at week 6, GATM was no longer detected. Nuclei are in blue. Scale bar, 20 μm. (E–H) Protocol is the same as in A–D but with LLC-PK1 cells overexpressing the T336A mutant. Within 8 weeks, the cells were not able to degrade GATM deposits and giant mitochondria. Scale bar, 20 μm. (I) Live cell imaging of mitochondrial reactive oxygen species (ROS) production in LLC-PK1 cells overexpressing wild-type GATM (n=6) or the T336A mutant (n=6). ROS production rate was measured with the ROS cell–permeant dye CellROX Deep Red. The slopes of the linear regression curves were significantly different (analysis of covariance; P<0.01). (J and K) Real time PCR in LLC-PK1 vector control cells (vector), cells overexpressing wild-type GATM (wild type), and the T336A mutant (T336A); n=20 dishes for each group (mean±SEM). Values were normalized to β-actin mRNA expression. (J) Real time PCR of the inflammasome component NLRP3. *Significantly different from vector control cells (ANOVA; Bonferroni test; P<0.001); #significantly different from wild-type GATM-expressing cells (P<0.001). (K) Real time PCR of the profibrotic cytokine IL-18. *Significantly different from vector control cells (ANOVA; Bonferroni test; P<0.001); #significantly different from wild-type GATM-expressing cells (P<0.001). (L) IL-18 ELISA in total cell lysates of LLC-PK1 cells overexpressing wild-type GATM (n=3) or the T336A mutant (n=3). Data were normalized to total protein content. *Overexpression of the T336A mutant led to increased IL-18 synthesis (unpaired; two-sided t test; P=0.001).
Figure 4.
Figure 4.
Expression of mutant GATM in epithelial cells results in enhanced transcription of fibronectin and smooth muscle actin and increases the rate of cell death. Dietary creatine supplementation can be used to suppress GATM expression. (A and B) Real time PCR in LLC-PK1 vector control cells (vector), cells overexpressing wild-type glycine amidinotransferase (GATM; wild type), and the T336A mutant (T336A); n=20 dishes for each group (mean ±SEM). Values were normalized to β-actin expression. (A) Real time PCR of fibronectin 1 (FN1). Values of vector control cells were not different from wild-type GATM-expressing cells (P=0.05). *Significantly different from vector control cells (ANOVA; Bonferroni test; P<0.001); #significantly different from wild-type GATM-expressing cells (P=0.003). (B) Real time PCR of α-smooth muscle actin 2 (ACTA2). *Significantly different from vector control cells (ANOVA; Bonferroni test; P<0.001); #significantly different from wild-type GATM-expressing cells (P<0.001). (C) Lactate dehydrogenase (LDH) release as a measure of cell death in LLC-PK1 cells overexpressing wild-type GATM (n=3) or the T336A mutant (n=3). After induction (3 weeks), the cell medium remained unchanged, and samples were taken on days 2–4. ANOVA with post hoc t tests corrected for multiple testing by the Bonferroni method; P values were 0.004 (day 2), <0.0001 (day 3), and <0.0001 (day 4). *Significantly different from wild-type GATM-expressing cells. (D) Cell death in LLC-PK1 cells overexpressing the T336A mutant (induced for 7 weeks). The remains of a dead cell with giant mitochondria (green). The nucleus (red) is fragmented (arrows), indicating cell death. Scale bar, 10 μm. (E and F) Effect of oral creatine supplementation on Gatm expression. Wild-type mice were supplemented with 1% creatine in their drinking water (n=4) for 1 week; control mice received tap water (n=4). *Significantly different from untreated mice. Renal Gatm mRNA and protein expression were determined using (E) real time PCR and (F) Western blot. Creatine supplementation led to a reduction of mRNA and protein expression (unpaired, two-sided t tests; P=0.01 and P=0.03, respectively). Values are normalized to β-actin mRNA or total protein expression.

Comment in

References

    1. Jha V, Garcia-Garcia G, Iseki K, Li Z, Naicker S, Plattner B, et al.: Chronic kidney disease: Global dimension and perspectives. Lancet 382: 260–272, 2013 - PubMed
    1. Dent CE, Harris H: The genetics of cystinuria. Ann Eugen 16: 60–87, 1951 - PubMed
    1. Luder J, Sheldon W: A familial tubular absorption defect of glucose and amino acids. Arch Dis Child 30: 160–164, 1955 - PMC - PubMed
    1. Sheldon W, Luder J, Webb B: A familial tubular absorption defect of glucose and amino acids. Arch Dis Child 36: 90–95, 1961 - PMC - PubMed
    1. Smith R, Lindenbaum RH, Walton RJ: Hypophosphataemic osteomalacia and Fanconi syndrome of adult onset with dominant inheritance. Possible relationship with diabetes mellitus. Q J Med 45: 387–400, 1976 - PubMed

Publication types

MeSH terms