. 2018 Apr 13;9(1):1461.
doi: 10.1038/s41467-018-03687-x.

Directed evolution of broadly crossreactive chemokine-blocking antibodies efficacious in arthritis

Affiliations

Directed evolution of broadly crossreactive chemokine-blocking antibodies efficacious in arthritis

Alessandro Angelini et al. Nat Commun. .

Abstract

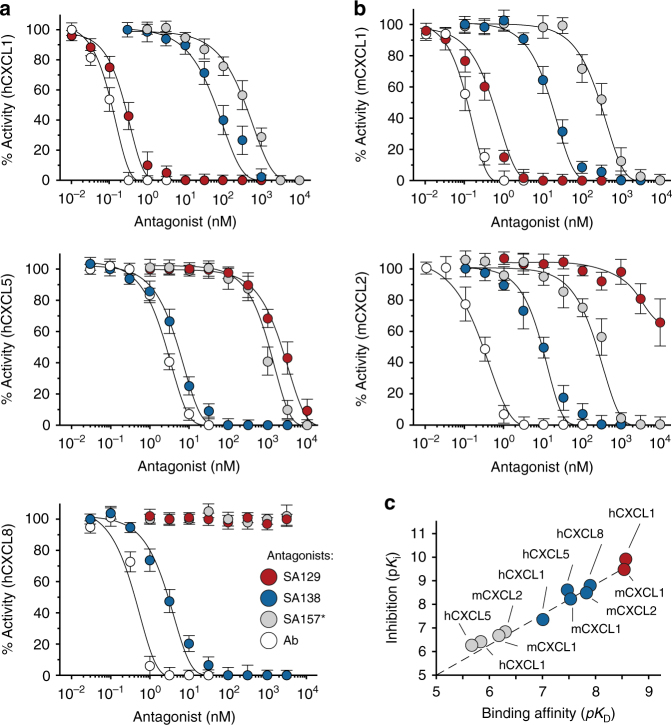
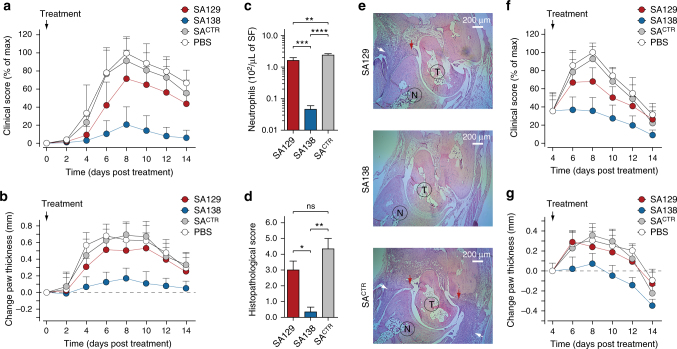
Chemokine receptors typically have multiple ligands. Consequently, treatment with a blocking antibody against a single chemokine is expected to be insufficient for efficacy. Here we show single-chain antibodies can be engineered for broad crossreactivity toward multiple human and mouse proinflammatory ELR+ CXC chemokines. The engineered molecules recognize functional epitopes of ELR+ CXC chemokines and inhibit neutrophil activation ex vivo. Furthermore, an albumin fusion of the most crossreactive single-chain antibody prevents and reverses inflammation in the K/BxN mouse model of arthritis. Thus, we report an approach for the molecular evolution and selection of broadly crossreactive antibodies towards a family of structurally related, yet sequence-diverse protein targets, with general implications for the development of novel therapeutics.


Conflict of interest statement

A.A., A.D.L., and K.D.W. declare that they are named on a provisional patent application 62/546814 entitled “Multiple Specificity Binders of CXC Chemokines and Uses Thereof” that has been filed in the United States Patent and Trademark Office on behalf of the Massachusetts Institute of Technology and the Massachusetts General Hospital. The remaining authors declare no competing interests.

Figures

Fig. 1
Fig. 1
Isolation of crossreactive antibodies toward multiple ELR+ CXC chemokines. a Heat map displaying the sequence identity among multiple human and murine ELR+ CXC chemokines. The color of each element in the heat map indicates the sequence identity percentage, ranging from 10% (white) to 100% (dark blue). “h” and “m” indicates human and murine CXC chemokines, respectively. b Schematic representation of the iterative selection pathways applied to isolate crossreactive molecules from a naïve library of synthetic antibodies displayed on the surface of yeast. Two cycles of magnetic bead screening followed by four cycles of flow cytometry sorting were applied. c Plot of the binding affinities of 18 unique yeast-displayed synthetic antibody protein binders (CK) selected using six diverse human (hCXCL1, hCXCL5, and hCXCL8) and murine (mCXCL1, mCXCL2, and mCXCL5) ELR+ CXC chemokine ligands. Each chemokine and its corresponding binding affinity values are reported as differently colored filled circles and indicate the means of at least three independent experiments. Data are presented as inverse equilibrium binding constants (1/KD; M−1)
Fig. 2
Fig. 2
Molecular co-evolution of antibody affinity and crossreactivity. Plots displaying binding affinities of engineered clones derived from a CK1, c CK2, and e CK4 lineages. Two independent processes of selection (I and II), each including the generation of random yeast-display antibody libraries and six cycles of flow cytometry sorting, followed by a third round of site-directed mutagenesis (III), were performed. ELR+ CXC chemokines and their corresponding binding affinity values are reported as differently colored filled circles and indicate the means of at least three independent experiments. Data are presented as inverse equilibrium binding constants (1/KD; M−1). Selection pathways applied to isolate crossreactive molecules from a mutagenized yeast-display synthetic antibody library that yielded b CK1-, d CK2-, and f CK4-derived clones with improved binding affinity and crossreactivity. Each pathway comprises five to six cycles of flow cytometry sorting
Fig. 3
Fig. 3
Frequency and distribution of mutations in crossreactive antibodies. a Box-and-whiskers graph comparing the total number (left y-axis) and frequencies (right y-axis) of mutated residues detected in CK1-, CK2-, and CK4-derived clones before (light gray) and after (dark gray) the first (I) and second (II) process of selection, respectively. “Inp” indicates sequenced clones picked from the random yeast-display antibody library before selection (input). “Out” indicates sequenced clones after selection (output). “n” indicates samples size. The middle line within each box represents the median, and the lower and upper boundaries of the box indicate the 25th (Q1) and 75th (Q3) percentiles. Whiskers represent the 1.5× interquartile range (IQR = Q3–Q1) extending beyond box. Statistical comparisons were made between each group using one-way analysis of variance (ANOVA), followed by Tukey’s test to calculate P-values: *P < 0.05, **P < 0.01, ***P < 0.001; ****P < 0.0001. ns: non-significant. Homology model and frequencies of enriched mutations of engineered b CK138 and c CK157 antibodies. Left, the VL and VH backbones are represented as ribbons (light gray). Mutations acquired during the selection process are depicted as spheres at the Cα positions. Mutated amino acids belonging to CDR loops of CK138 and CK157 are colored in dark blue and dark red, respectively. Diversified amino acids belonging to FWR regions of CK138 and CK157 are colored in light blue and light red, respectively. Right, columns graph reporting the mutation frequency in CDR (dark gray) and FWR (light gray) regions. Only amino-acid mutations of CK1 and CK2 lineages that showed at least 20% frequency and were enriched through two iterative processes of selection are reported. Wild type and mutated amino acids are listed at the top and bottom, respectively. d Fluorescence binding signal of CK1- (left) and CK2- (right) derived clones bearing highly frequent mutations within the CDR-H3 and FWRs, respectively, that were reverted to the wild-type amino acids. ELR+ CXC chemokines and the corresponding binding/display values (y-axis) are indicated as differently colored filled circles and represent the means of at least three independent experiments
Fig. 4
Fig. 4
Crossreactivity of engineered antibodies toward multiple CXC chemokines. a Heat map indicating the binding intensity of the engineered antibodies against 20 diverse human and murine CXC chemokines. Binding was assessed by flow cytometry using two cell-display arrangements: soluble CXC chemokine against yeast-displayed CK129 (red), CK138 (blue), and CK157 (gray) antibodies (on the left) and soluble serum albumin–antibody fusions SA129 (red), SA138 (blue), and SA157* (gray) against yeast-displayed CXC chemokines (on the right). Normalized binding/display signal intensities range from light to dark colors indicating low (0.0‒0.2) and high (0.8‒1.0) titers, respectively. b Binding isotherms of yeast-displayed CXC chemokines to soluble serum albumin–antibody fusions SA129, SA138, and SA157*. Equilibrium binding affinity (KD) values were determined only for chemokines exhibiting signals at high concentrations of soluble antibody fusions. CXC chemokines are gradient colored ranging from dark (high affinity) to light (low affinity) red (SA129), blue (SA138), and gray (SA157*). Data are presented as mean (dots) ± s.e.m. (bars). c Plot showing binding affinities of yeast-displayed CXC chemokines to SA129 (red), SA138 (blue), and SA157* (gray) antibody fusions. The indicated values are displayed as differently colored filled circles and represent the means of at least three independent experiments presented as inverse equilibrium binding constants (1/KD; M−1)
Fig. 5
Fig. 5
Epitope mapping of crossreactive antibodies. a Binding of SA129 (red), SA138 (blue), SA157 (gray), Ab275 (green), and Ab276 (orange) to a defined panel of hCXCL1 alanine mutants was assessed by flow cytometry. Obtained median values were normalized to the display median fluorescence intensities of each single yeast surface displayed mutant (binding/display). Normalized values represent the means of at least three independent experiments. Mutations that do not significantly affect binding (0.75‒1.0) are shown in white, while mutations that weakly (0.5‒0.75), moderately (0.25‒0.5), or strongly (0.0‒0.25) disrupt binding are shown respectively in light, intermediate, and dark colors. b The identified contact residues of hCXCL1 (PDB ID: 1MGS) to each antibody as defined by epitope mapping are shown in red (SA129), blue (SA138), gray (SA157*), green (Ab275), and orange (Ab276). The color intensity correlates with the strength of the interaction, with weak and strong interactions shown as light and dark colors, respectively. c Sequence alignment of various CXC chemokine proteins. Positions of conserved solvent-exposed residues that appear to be involved in the interaction with SA129 (red), SA138 (blue), SA157* (gray), Ab275 (green), and Ab276 (orange) based on residues identified using hCXCL1 alanine mutants are shown. Amino-acid sequences have been listed based on binding affinity (KD), with the tightest CXC chemokine protein at the top and the weakest at the bottom. Upper case N and C letters indicate the N- and C-terminus of the amino-acid sequence, respectively. Regions including residues that are not involved in binding are not reported for space reasons. The regions denoting the ELR-motif, N-loop, 30s-loop, 40s-loop, and 50s-loop that are known to be crucial for the binding of ELR+ CXC chemokines to the cognate CXCR2 receptor are indicated at the bottom. Residues have been highlighted according to the strength of interaction determined using soluble antibodies against hCXCL1 alanine mutants, as shown in panel a
Fig. 6
Fig. 6
Crossreactive antibodies inhibit ELR+ CXC chemokine signaling in vitro. Residual activity of a human hCXCL1, hCXCL5, and hCXCL8 and b mouse mCXCL1 and mCXCL2 chemokines incubated with varying concentrations of SA129 (red), SA138 (blue), and SA157* (gray) fusions, and commercial neutralizing antibodies (Ab, white). The indicated values are the means of three independent experiments. c Plot displaying pKi versus the calculated pKD of SA129 (red), SA138 (blue), and SA157* (gray) fusions. Data are presented as mean (dots) ± s.e.m. (bars)
Fig. 7
Fig. 7
Crossreactive serum albumin–antibody fusion reverses inflammation in vivo. a Clinical score (% of max) and b change in ankle thickness (mm) of mice treated with serum albumin–antibody fusion proteins on day 0 (preventative regimen). Arthritogenic serum was injected into C57BL/6J on days 0 and 2. Mice were also treated daily with SA129, SA138, and SACTR fusions (1 mg per mouse in PBS i.p.) beginning on day 0. Paw thickness of ten mice per group (n = 10), pooled from two independent experiments, were measured every 2 days for a total of 14 days. Arrows indicate first day of treatment. Data are presented as mean (dots) ± s.e.m. (bars). c Columns graph reporting the number of infiltrating synovial fluid neutrophils (Ly6G+ cells) from the ankles of serum-transferred arthritic mice measured at day 8 by flow cytometry (n = 3 per condition). Statistical comparisons were made between each group using one-way analysis of variance (ANOVA), followed by Tukey’s test to calculate P-values: *P < 0.05, **P < 0.01, ***P < 0.001; ****P < 0.0001. ns: non-significant. d Columns graph reporting the histopathological scoring and e representative H&E staining of ankle tissue sections of mice treated with SA129 (top), SA138 (middle), and control SACTR (bottom) on day 8. Scale bar represents 200 μm. White arrows indicate joint-infiltrating inflammatory cells, and red arrows indicate pannus formation. T taulus, N navicular. f Clinical score (% of max) and g change in ankle thickness (mm) of K/BxN serum-induced arthritic mice treated beginning on day 4 with serum albumin–antibody fusion proteins (therapeutic regimen). Arthritogenic serum was injected into C57BL/6J on days 0 and 2, and mice were then treated daily i.p. with SA129, SA138, and SACTR fusions (1 mg per mouse in PBS i.p.) beginning on day 4 after inflammation had developed. Paw thickness of ten mice per group (n = 10), pooled from two independent experiments, was measured every 2 days for a total of 14 days. Arrows indicate the day treatment began. Data are presented as mean (dots) ± s.e.m. (bars)

References

    1. Cho JH, Feldman M. Heterogeneity of autoimmune diseases: pathophysiologic insights from genetics and implications for new therapies. Nat. Med. 2015;21:730–738. doi: 10.1038/nm.3897. - DOI - PMC - PubMed
    1. Charo IF, Ransohoff RM. The many roles of chemokines and chemokine receptors in inflammation. N. Engl. J. Med. 2006;354:610–621. doi: 10.1056/NEJMra052723. - DOI - PubMed
    1. Zlotnik A, Yoshie O. The chemokine superfamily revisited. Immunity. 2012;36:705–716. doi: 10.1016/j.immuni.2012.05.008. - DOI - PMC - PubMed
    1. Griffith JW, Sokol CL, Luster AD. Chemokines and chemokine receptors: positioning cells for host defense and immunity. Annu Rev. Immunol. 2014;32:659–702. doi: 10.1146/annurev-immunol-032713-120145. - DOI - PubMed
    1. Koch AE, et al. Synovial tissue macrophage as a source of the chemotactic cytokine IL-8. J. Immunol. 1991;147:2187–2195. - PubMed

Publication types

MeSH terms