. 2018 Apr 13;8(1):5955.
doi: 10.1038/s41598-017-14419-4.

Water-stress induced downsizing of light-harvesting antenna complex protects developing rice seedlings from photo-oxidative damage

Affiliations

Water-stress induced downsizing of light-harvesting antenna complex protects developing rice seedlings from photo-oxidative damage

Vijay K Dalal et al. Sci Rep. .

Abstract

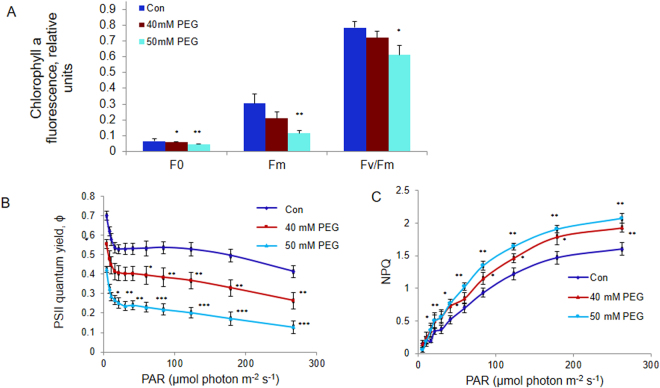
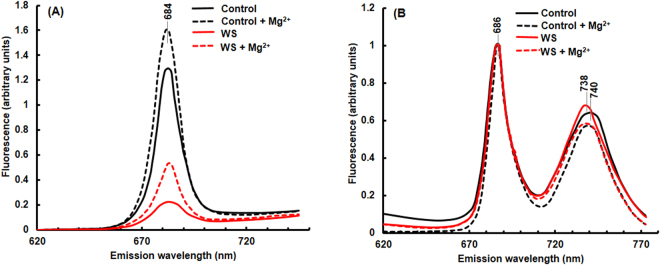
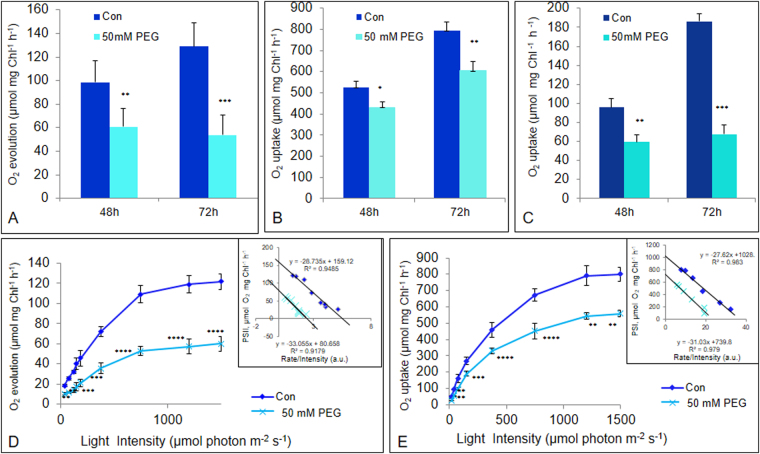
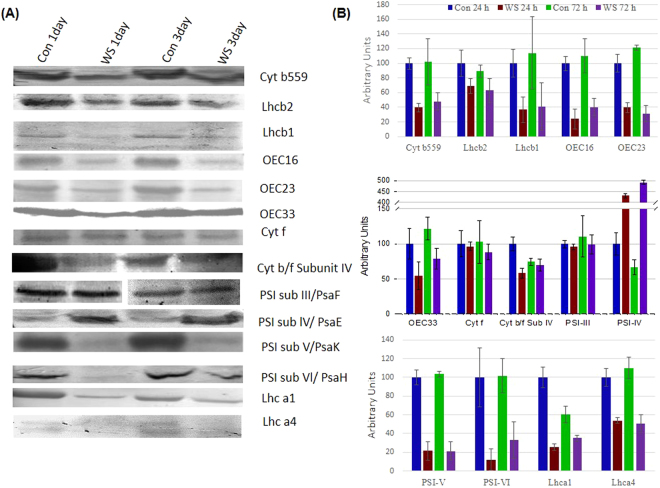
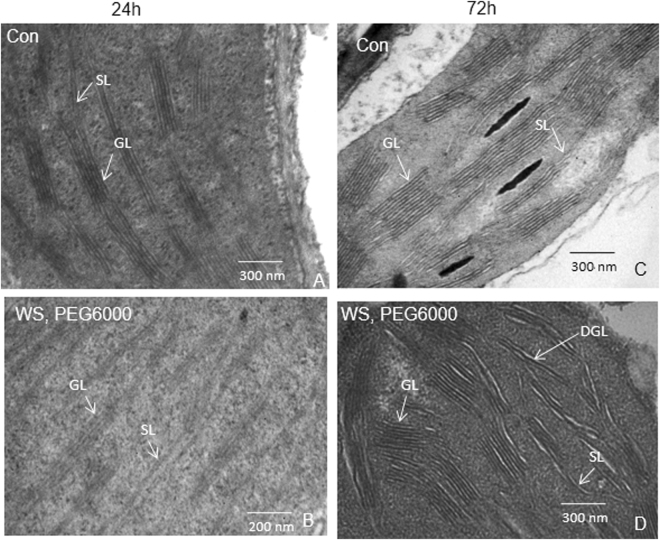
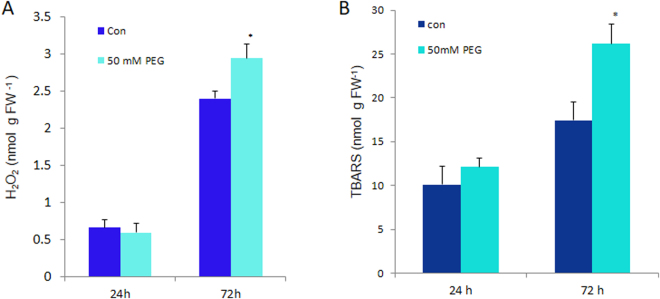
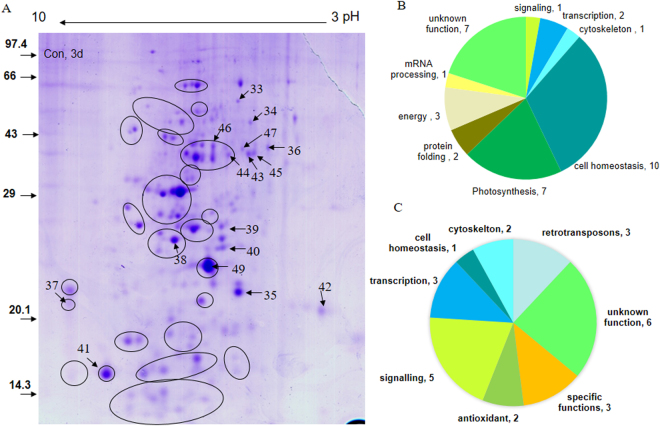
The impact of water-stress on chloroplast development was studied by applying polyethylene glycol 6000 to the roots of 5-day-old etiolated rice (Oryza sativa) seedlings that were subsequently illuminated up to 72 h. Chloroplast development in drought environment led to down-regulation of light-harvesting Chl-proteins. Photosynthetic proteins of Photosystem II (PSII) and oxygen evolving complex i.e., Cytb559, OEC16, OEC23 and OEC33 as well as those of PSI such as PSI-III, PSI-V, and PSI-VI, decreased in abundance. Consequently, due to reduced light absorption by antennae, the electron transport rates of PSII and PSI decreased by 55% and 25% respectively. Further, seedling development in stress condition led to a decline in the ratio of variable (Fv) to maximum (Fm) Chl a fluorescence, as well in the quantum yield of PSII photochemistry. Addition of Mg2+ to the thylakoid membranes suggested that Mg2+-induced grana stacking was not affected by water deficit. Proteomic analysis revealed the down-regulation of proteins involved in electron transport and in carbon reduction reactions, and up-regulation of antioxidative enzymes. Our results demonstrate that developing seedlings under water deficit could downsize their light-harvesting capacity and components of photosynthetic apparatus to prevent photo-oxidative stress, excess ROS generation and membrane lipid peroxidation.


Conflict of interest statement

The authors declare that they have no competing interests.

Figures

Figure 1
Figure 1
Chlorophyll a fluorescence measurements of control and water-stressed rice seedlings after 72 h of greening. (A) Fo, Fm, Fv/Fm = (Fm − Fo)/Fm, (B) “Operating” quantum yield (Φ) of PSII and (C) Non-photochemical quenching (NPQ). Five-day old etiolated seedlings were treated with 40 mM (or 50 mM) PEG 6000 dissolved in half strength MS nutrient soln., 16 h prior to their illumination with cool white fluorescent + incandescent light (100 μmol photons m−2 s−1), at 28 °C. Chl a fluorescence based parameters were measured with a PAM 2100 fluorometer. “Operating” PSII quantum yield (Φ) and NPQ were calculated as (Fm′ − Ft)/Fm′ and (Fm-Fm′)/Fm′ respectively. Each data point is the average of three replicates. The error bars represent standard deviations (SD). ANOVA: *p < 0.05; **p < 0.01; and *** p < 0.001.
Figure 2
Figure 2
Fluorescence emission spectra of thylakoid membranes isolated from leaves of control and water-stressed rice seedlings. (A) Room temperature and (B) Low temperature (77K) fluorescence spectra (E440) of thylakoid membranes (3 μg Chl) suspended in 5 mM Hepes-NaOH buffer containing 0 or 4 mM MgCl2 (pH 7.5), after 72 h of stress treatment. Seedlings were treated as in Fig. 1. Fluorescence emission spectra were recorded in ratio mode in a photon counting SLM-AMINCO 8000 spectrofluorometer. For 77 K spectral measurements, excitation and emission slit widths were set at 4 nm. For room temperature spectra, the excitation and emission slit widths were set at 8 nm and 4 nm, respectively. The room temperature spectra were corrected for photomultiplier tube response. Rhodamine B was used in the reference channel as a quantum counter. A tetraphenylbutadiene (TPD) block was used to adjust the voltage to 20000 counts per second in the sample as well as in the reference channels at excitation and emission wavelengths of 348 nm and 422 nm, respectively. Fluorescence spectra were measured three times and identical results were obtained.
Figure 3
Figure 3
Photosynthetic polarographic measurements of thylakoid membranes isolated from control and water-stressed rice seedlings. (A) PSII, (B) PSI and (C) whole chain activities after 48 h and 72 h of greening, and light saturation curve of (D) PSII and (E) PSI reactions after 72 h of greening in thylakoid membranes isolated from control and water-stressed seedlings. Seedlings were treated essentially as in Fig. 1. Oxygen evolution/uptake by thylakoid membranes was measured by Oxy Lab, Hansatech. Thylakoids, equivalent to 20 µg of Chl, were used for each reaction. PSII, PSI and whole chain activities were measured as electron transport from H2O to p-phenylenediamine (PD), Ascorbate/DCIP couple to methylviologen (MV) and H2O to MV, respectively. For measurement of light saturation curve, different light intensities were obtained from a tungsten lamp using neutral density filters. Each data point is the average of three replicates. The error bars represent SD. ANOVA: *p < 0.05; **p < 0.01; and *** p < 0.001.
Figure 4
Figure 4
Immunoblot analysis of photosynthetic proteins. (A) Immunoblot and (B) Quantitation of immunoblots; Seedlings were treated as described in Fig. 1. Thylakoid membranes were isolated from control and water-stressed rice seedlings after 24 h and 72 h of greening. Equal amount of protein (20 µg) was separated on 12.5 % SDS-PAGE. After transfer to nitrocellulose membranes, the blotted bands were immune-detected with specific antibodies for each protein and subsequently visualized utilizing alkaline phosphatase labeled anti-IgG antibodies. Quantitation of immunoblots was performed with ImageJ and is represented as percent of control (24 h) values. In immunoblot image of PSI sub III, intervening lines have been removed (white gap). Error bars represent SD of three independent replicates.
Figure 5
Figure 5
Ultrastructure of chloroplasts. Transmission electron micrograph depicting the ultrastructure of chloroplast was performed in control and water-stressed rice seedlings, after (A and B) 24 h and (C and D) 72 h of greening. Seedlings were treated as described in Fig. 1. Glutaraldehyde fixed tissues were dehydrated with acetone, cleared with epoxy propane or xylene and infiltrated with araldite. Araldite was polymerized at 50 °C for 12–24 h and then at 60 °C for 24–48 h. Ultrathin sections were cut, stained in saturated uranyl acetate in 50% ethanol for 10–15 min, washed in 50% ethanol and distilled water, and viewed in a Transmission Electron Microscope. The electron micrograph of chloroplasts were performed three times and representative figures are displayed. Scale bar is 200/300 nm. GL-grana lamellae, SL-stroma lamellae, DGL-dis-integrated grana lamellae.
Figure 6
Figure 6
Antioxidative response of seedlings. (A) H2O2 content and (B) MDA content in control (Con) and stressed (50 mM PEG) rice seedlings after 24 h and 72 h of greening. Seedlings were treated as in Fig. 1. H2O2 was measured by absorbance at 240 nm, against a standard curve and MDA was measured as TBARS equivalents. Leaf tissue (200 mg) was homogenized in 20% TCA solution with and without 0.25% TBA, boiled and centrifuged. Absorptions at 440, 532 and 600 nm were measured from supernatant. Unspecific absorption contribution from without-TBA solution was deducted appropriately (see M&M) from sample values. The error bar represents SD of three replicates. ANOVA: *p < 0.05; **p < 0.01; and ***p < 0.001.
Figure 7
Figure 7
Proteomics of PEG fractionated soluble and peripheral thylakoid proteins of rice leaves after 72 h of water-stress treatment in light. Five-day old etiolated seedlings were subject to water-stress as in Fig. 1. The 2D gel of control and treated samples were done several times till a consistent pattern was obtained. (A) Representative 2-D gel of PEG fractionated soluble proteins of control rice seedlings, (B) functional category distribution of 34 down-regulated and (C) 25 up-regulated differentially expressed proteins based on actual number of identified proteins. Soluble proteome was isolated and PEG fractionated in two steps; first upto 10% and later upto 20% to remove abundant proteins e.g. Rubisco. Protein (800 µg) from supernatant was treated with G-Biosciences Perfect Focus kit to remove impurities; the obtained pellet was air dried and dissolved in rehydration buffer. After rehydration, isoelectric focusing of proteins was done on a 17 cm IP strip overnight; strip was equilibrated and second dimension was run on a 12.5% SDS-PAGE. 2-D gel was stained with Coomassie Brilliant Blue (CBB), Imaged with UMAX PowerLook 2100XL Image Scanner. Spots were detected, and matched with the Image Master-2D Platinum 6.0 software to get differentially expressed proteins. Numbered spots showing down-regulated proteins in the representative gel from control seedlings are mentioned in text and tables starting with CBC3.

References

    1. Pareek, A., Sopory, S. K. & Bohnert, H. J. Govindjee (eds) Abiotic Stress Adaptation in Plants, Physiological, Molecular and Genomic Foundation (Springer, Dordrecht, 2010).
    1. Zhao MS, Running SW. Drought-Induced reduction in global terrestrial net primary production from 2000 through 2009. Science. 2010;329:940–943. doi: 10.1126/science.1192666. - DOI - PubMed
    1. Lawlor DW, Tezara W. Causes of decreased photosynthetic rate and metabolic capacity in water-deficient leaf cells: a critical evaluation of mechanisms and integration of processes. Annal. Bot. 2009;103:561–579. doi: 10.1093/aob/mcn244. - DOI - PMC - PubMed
    1. Pinheiro C, Chaves MM. Photosynthesis and drought: can we make metabolic connections from available data? J. Exp. Bot. 2011;62:869–882. doi: 10.1093/jxb/erq340. - DOI - PubMed
    1. Chaves MM, Flexas J, Pinheiro C. Photosynthesis under drought and salt stress: Regulation mechanisms from whole plant to cell. Annal. Bot. 2009;103:551–560. doi: 10.1093/aob/mcn125. - DOI - PMC - PubMed

Publication types

MeSH terms