. 2018 Apr 13;9(1):1457.
doi: 10.1038/s41467-018-03970-x.

Cell-free prediction of protein expression costs for growing cells

Affiliations

Cell-free prediction of protein expression costs for growing cells

Olivier Borkowski et al. Nat Commun. .

Abstract

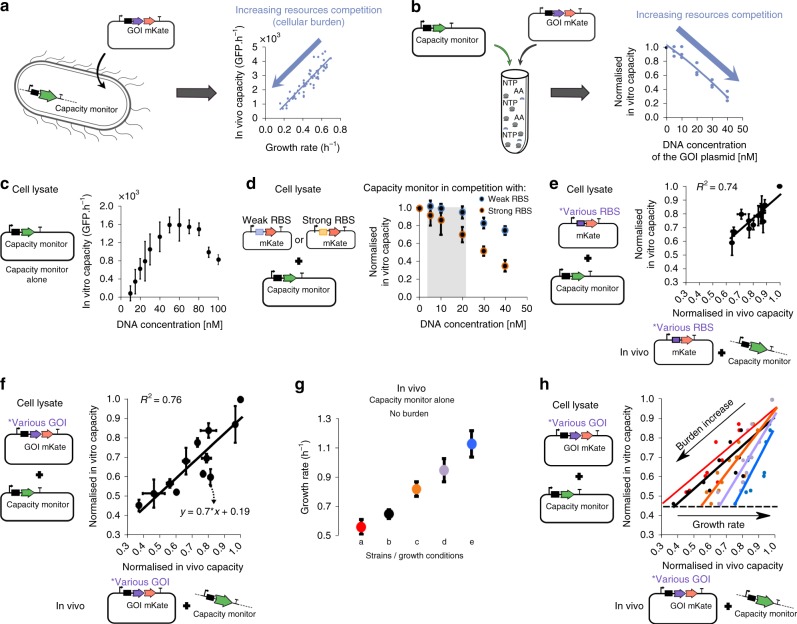
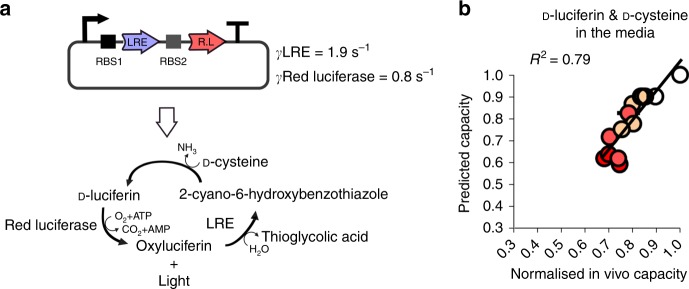
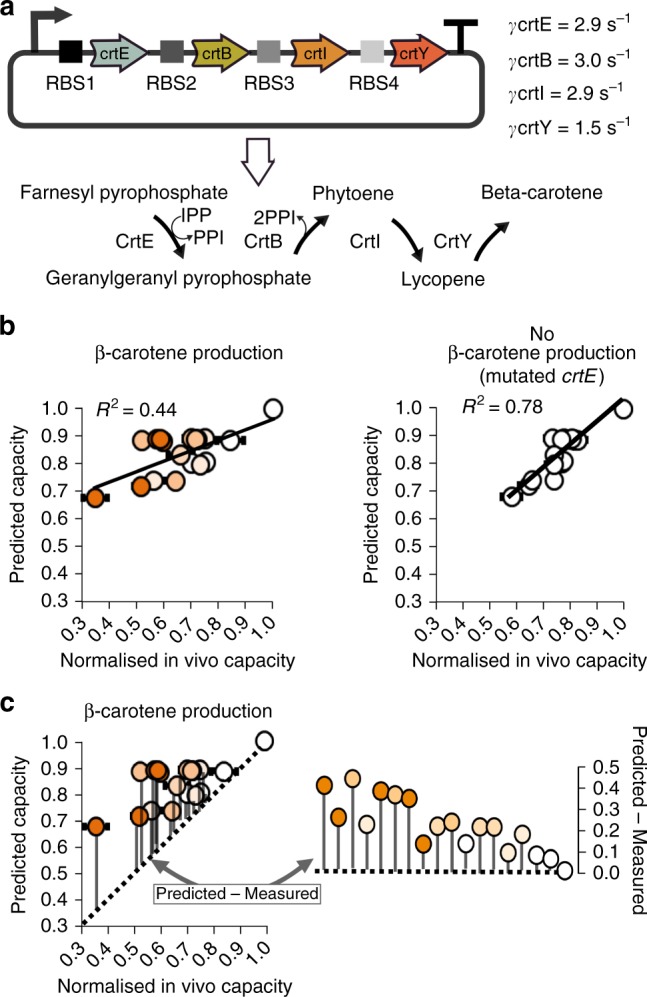
Translating heterologous proteins places significant burden on host cells, consuming expression resources leading to slower cell growth and productivity. Yet predicting the cost of protein production for any given gene is a major challenge, as multiple processes and factors combine to determine translation efficiency. To enable prediction of the cost of gene expression in bacteria, we describe here a standard cell-free lysate assay that provides a relative measure of resource consumption when a protein coding sequence is expressed. These lysate measurements can then be used with a computational model of translation to predict the in vivo burden placed on growing E. coli cells for a variety of proteins of different functions and lengths. Using this approach, we can predict the burden of expressing multigene operons of different designs and differentiate between the fraction of burden related to gene expression compared to action of a metabolic pathway.


Conflict of interest statement

The authors declare no competing interests.

Figures

Fig. 1
Fig. 1
A method to measure resource competition using a capacity monitor in cell lysate. a Illustration of resource competition in E. coli between a genome-integrated GFP capacity monitor gene and a plasmid-based gene of interest (GoI) fused to mkate. Graph shows the correlation between the inferred expression capacity (measured as max GFP production rate per cell) and the cell growth rate. b Illustration of resource competition in cell lysates expressing the capacity monitor from a plasmid and the GoI from another plasmid. Graph shows the correlation between the normalized in vitro capacity (measured as max GFP production rate, Supplementary Fig. 1A) and increasing concentrations of a GoI plasmid. c Measured in vitro capacity with the capacity monitor plasmid added at different concentrations in cell lysate. d Normalized in vitro capacity measured in cell lysate containing 30 nM of the capacity monitor plasmid and different concentration plasmids bearing mkate with either a strong (black/orange) or a very weak (black/blue) RBS sequence. The grey area represents the concentration of plasmid where competition is for translational resources. Values are normalised to the in vitro capacity obtained with capacity monitor plasmid alone. e Correlation between normalized in vitro capacity measured in cell lysate and normalized in vivo capacity measured with DH10B cells. The constructs in this experiment all express mkate with different RBS sequences (Supplementary Table 1). f Correlation between normalized in vitro capacity measured in cell lysate and normalized in vivo capacity measured in DH10B using constructs with various genes of different sizes paired with RBS BCD2. g Growth rate of strains growing in different conditions and containing only the capacity monitor. Strains/conditions: DH10B in M9 pyruvate (a, red); DH10B in M9 fructose (b, black); MG1655 in M9 fructose (c, orange); DH10B in M9 glucose (d, purple); DH10B in LB (e, blue). h Correlation between normalized in vitro capacity (from f) and normalized in vivo capacity when constructs with various genes of different sizes paired with RBS BCD2 are expressed in the strains and conditions described in g. Error bars show standard error of three independent repeats
Fig. 2
Fig. 2
Predictive model for resource competition between a synthetic construct and capacity monitor. a Schematic of mathematical model of competitive translation between capacity monitor construct and a construct expressing a GoI, with a finite ribosome pool. A free ribosome binds to an unoccupied RBS at a rate a+ (a+ = a+M × RBS strength) and either unbinds and returns to the free ribosome pool at a rate a (a = a−M/RBS strength), or initiates synthesis at a rate b0 (b0 = b0M × RBS strength). Once synthesis has initiated, all the mechanisms of the protein synthesis are gathered in the lumped parameter γ, which represents the cost of protein synthesis. The number of protein synthesis steps depends on size (mRNA size/30—as 30 bases represents the footprint of a ribosome). Each synthesis step is considered to proceed with the same cost γ. b Heat maps of simulated capacity monitor expression (monitor output) when mRNA size and γ value of a synthetic construct are varied. The heat map is used to determine the γ value of each construct in Fig. 1f. c A new heat map simulated for weaker RBS is used to predict monitor output using γ values calculated in b. As prediction is done for cell lysate, in vivo predictions are then deduced from the relationship between cell lysate and in vivo measurements as per Fig. 1f. d First row: heat maps of simulated capacity (monitor output) when mRNA concentration and γ-values of a synthetic circuit are varied. Each heat map is a construct with different RBS strength. Second row: capacity (monitor output) as a function of mRNA level. Each line corresponds to different γ-values. e Measurements of normalised in vitro capacity when increasing synthetic construct DNA is added to cell lysate. Top: mkate with a strong RBS. Bottom: viob-mkate with a strong RBS. The calculated γ and RBS strengths (from Supplementary Fig. 4B) are shown for each construct. Lines show a fit to data points. Error bars show standard error of three independent repeats. Values are normalised to the capacity obtained with capacity monitor plasmid alone
Fig. 3
Fig. 3
Predicting the burden of operon designs for the Luciferase biosynthesis pathway. a Diagram of the luciferase pathway and the γ-values for the two enzyme-encoding sequences as measured by the cell lysate capacity assay (see Supplementary Fig. 5). The operon is designed with randomised RBS sequences and promoter BBa_J23100 (strong). b Model-predicted burden of each operon design compared to the measured capacity of E. coli expressing the operons. d-Luciferin and d-cysteine are added to the media to enable luminescence measurements and these are represented by the red intensity in each circle. Error bars show standard error of three independent repeats. Values are normalised to the capacity obtained with capacity monitor plasmid alone
Fig. 4
Fig. 4
Predicting the burden of operon designs for the beta-carotene biosynthesis pathway. a Diagram of the beta-carotene pathway and the γ-values for the four enzyme-encoding sequences as measured by the cell lysate capacity assay (see Supplementary Fig. 7). The operon is designed with partially randomised RBS sequences and one of three promoters: BBa_J23113 (weak), BBa_J23106 (medium), or BBa_J23100 (strong). b Model-predicted burden of each operon design compared to the measured in vivo capacity of E. coli expressing the operons with or without an inactivating mutation in the crtE gene (prediction method described in Supplementary Fig. 8). The orange intensity in each circle represents the measured beta-carotene level for each strain (see Supplementary Fig. 9). Error bars show standard error of three independent repeats. c Model-predicted burden of each operon design compared to the measured in vivo capacity of E. coli expressing the active pathway (same data as b, non-mutated pathway on left). The diagonal dot line represents equality between predicted and measured normalised in vivo capacity. Grey bars indicate the difference between the predicted and measured normalised in vivo capacity of the 17 operons. Right plot compares the relative differences between predicted and measured normalised capacity for the 17 operons and the strain-only control. Operons are ranked from low to high-in vivo capacity values. Values are normalised to the capacity obtained with capacity monitor plasmid alone

References

    1. Sleight SC, Sauro HM. Visualization of evolutionary stability dynamics and competitive fitness of Escherichia coli engineered with randomized multigene circuits. ACS Synth. Biol. 2013;2:519–528. doi: 10.1021/sb400055h. - DOI - PubMed
    1. Cardinale S, Arkin AP. Contextualizing context for synthetic biology--identifying causes of failure of synthetic biological systems. Biotechnol. J. 2012;7:856–866. doi: 10.1002/biot.201200085. - DOI - PMC - PubMed
    1. Borkowski O, Ceroni F, Stan GB, Ellis T. Overloaded and stressed: whole-cell considerations for bacterial synthetic biology. Curr. Opin. Microbiol. 2016;33:123–130. doi: 10.1016/j.mib.2016.07.009. - DOI - PubMed
    1. Ceroni F, Algar R, Stan GB, Ellis T. Quantifying cellular capacity identifies gene expression designs with reduced burden. Nat. Methods. 2015;12:415–418. doi: 10.1038/nmeth.3339. - DOI - PubMed
    1. Dong H, Nilsson L, Kurland CG. Gratuitous overexpression of genes in Escherichia coli leads to growth inhibition and ribosome destruction. J. Bacteriol. 1995;177:1497–1504. doi: 10.1128/jb.177.6.1497-1504.1995. - DOI - PMC - PubMed

Publication types