. 2018 Apr 13;8(1):5944.
doi: 10.1038/s41598-018-24357-4.

Photoreceptor-induced RPE phagolysosomal maturation defects in Stargardt-like Maculopathy (STGD3)

Affiliations

Photoreceptor-induced RPE phagolysosomal maturation defects in Stargardt-like Maculopathy (STGD3)

Camille Dejos et al. Sci Rep. .

Abstract

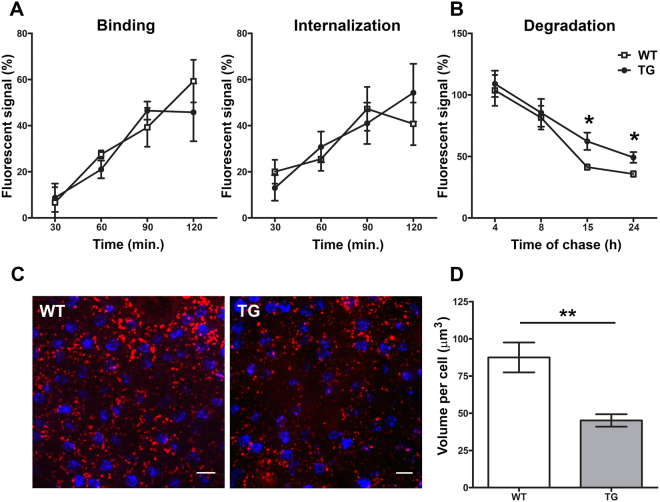
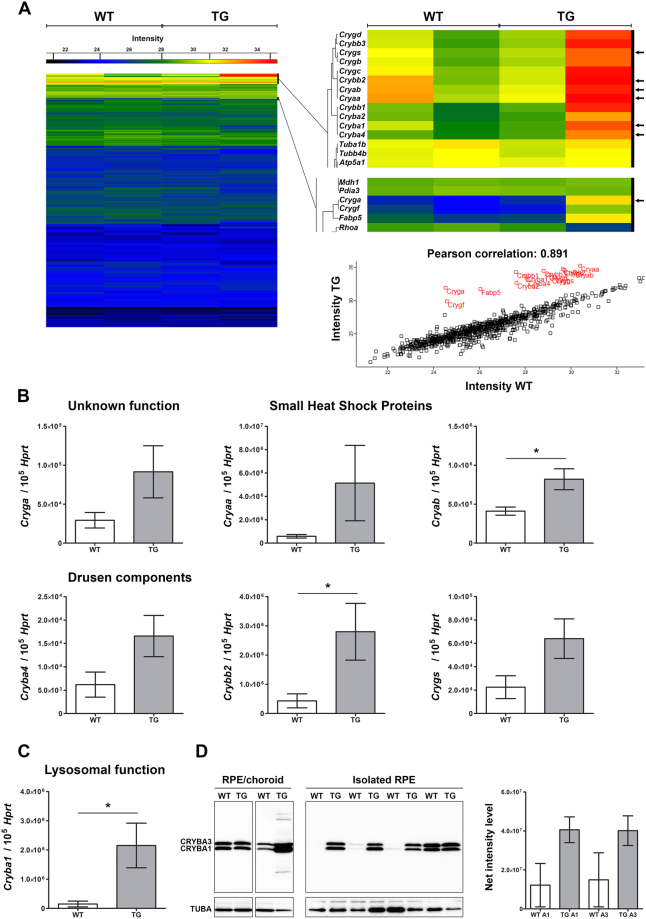
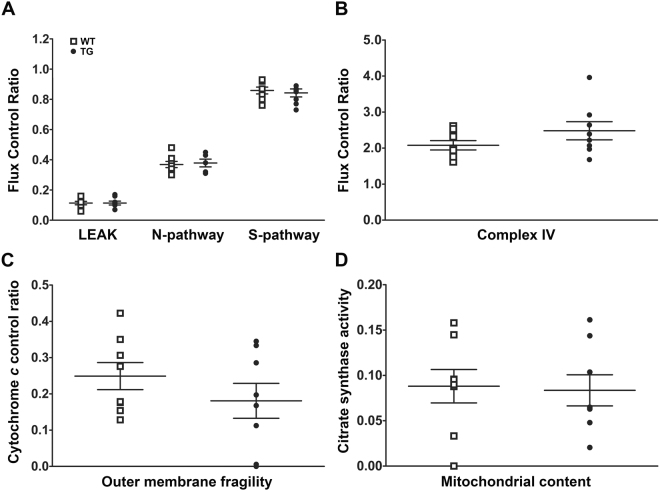
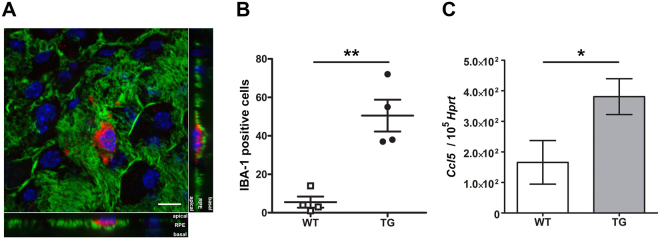
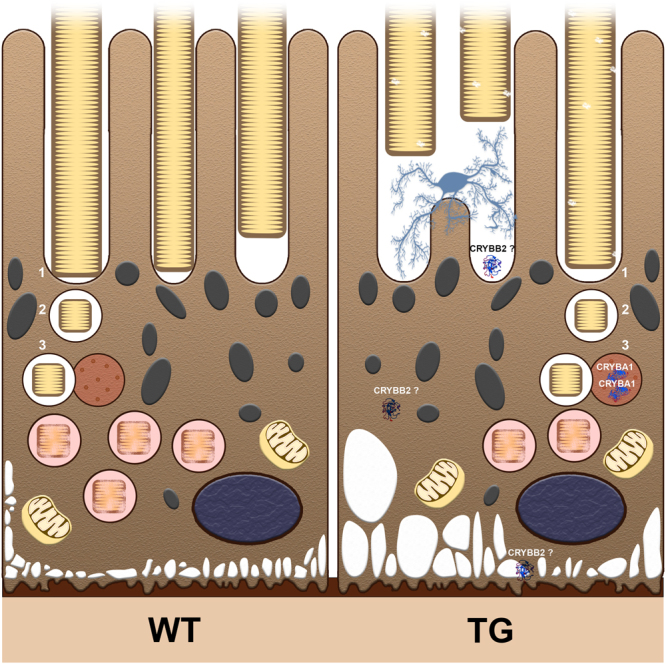
For many neurodegenerative disorders, expression of a pathological protein by one cell type impedes function of other cell types, which in turn contributes to the death of the first cell type. In transgenic mice modelling Stargardt-like (STGD3) maculopathy, human mutant ELOVL4 expression by photoreceptors is associated with defects in the underlying retinal pigment epithelium (RPE). To examine how photoreceptors exert cytotoxic effects on RPE cells, transgenic ELOVL4 (TG1-2 line; TG) and wild-type (WT) littermates were studied one month prior (preclinical stage) to onset of photoreceptor loss (two months). TG photoreceptor outer segments presented to human RPE cells are recognized and internalized into phagosomes, but their digestion is delayed. Live RPE cell imaging pinpoints decreased numbers of acidified phagolysomes. In vivo, master regulator of lysosomal genes, transcription factor EB (TFEB), and key lysosomal enzyme Cathepsin D are both unaffected. Oxidative stress, as ruled out with high-resolution respirometry, does not play a role at such an early stage. Upregulation of CRYBA1/A3 and phagocytic cells (microglia/macrophages) interposed between RPE and photoreceptors support adaptive responses to processing delays. Impaired phagolysosomal maturation is observed in RPE of mice expressing human mutant ELOVL4 in their photoreceptors prior to photoreceptor death and associated vision loss.


Conflict of interest statement

The authors declare no competing interests.

Figures

Figure 1
Figure 1
Degradation of TG POS is delayed. Numbers of phagolysosomes are reduced. In vitro: (A) Graphs representing the kinetics of binding (OS bound but not internalized) and internalization (OS bound and internalized). Human RPE were presented with Alexa Fluor 488-labeled POS, isolated from WT (white squares) or TG (black circles) mice, for 120 minutes. Kinetics of POS binding and internalization were calculated using total fluorescence and internal signal from phagosomes after quenching. Data are expressed as mean ± SEM; n = 3–4 independent experiments. (B) Graph showing phagocytic pulse-chase assay. Human RPE were presented with POS for 2 hours, and fluorescence levels were quantified at different times following POS removal. Fusion of phagosomes containing fluorescently-labelled POS with acidified lysosomes, leads to POS degradation and loss of fluorescence signal, expressed here on the y axis as percentage of signal at time zero of presentation. Data are expressed as mean ± SEM; n = 3–5 independent experiments. *P ≤ 0.05. Live cell imaging: (C) Representative confocal images of acidified phagolysosomes labelled with pH sensitive dye (red) and nuclei stained with DAPI (blue) on freshly dissected RPE flatmounts, from WT (left) and TG (right) mice. Animals were culled 2 hours after light onset (7AM). (Scale bar: 10 μm). (D) Histogram showing the volume of acidified phagolysosomes occupied inside single RPE cells. Data are expressed as mean ± SEM; n = 13 microscope fields per group. **P ≤ 0.005.
Figure 2
Figure 2
Autophagy-lysosomal pathway genes and proteins have normal expression levels. (A) Immunoblots of TFEB, PCNA and TUBA using cytoplasmic proteins (5 µg per lane) and nuclear proteins (2 µg per lane) from RPE homogenates prepared 2 hours after light onset (7AM). (B) Representatives confocal images of TFEB (green) and DAPI (blue) immunochemistry in WT (left) and TG (right) mice (Scale bar: 10 µm). (C) Histogram showing relative Tfeb, Map1lc3a, Ctsd and Atp6v0a1 mRNA levels in the RPE by qRT-PCR. Each mRNA level was normalized to Hprt. Total RNA was prepared 3 hours (8AM) and 5 hours (10AM) after light onset. Data represent mean ± SEM; n = 5–8 mice per group. (D) Immunoblots of LC3B-I/LC3B-II, CTSD (i, immature and m, mature) and TUBA using RPE homogenates prepared 3 hours (8AM) and 5 hours (10AM) after light onset.
Figure 3
Figure 3
Crystallin genes and proteins are differentially expressed. (A) Heatmap showing expression levels of 963 proteins detected in RPE/choroid homogenates from WT (left) and TG (right) mice (2 independent experiments). Eyecup pool WT, n = 4 mice; eyecup pool TG n = 3–4 mice. Zoom showing relative intensities for the crystallin protein cluster. Expression of genes coding for targeted crystallin family members was further evaluated by qRT-PCR (black arrows). Graph showing Pearson correlation (2 independent experiments). (B) Histogram showing relative mRNA levels of drusen components (Cryba4, Crybb2 and Crygs), genes coding for small heat shock proteins (Cryaa and Cryab) and Cryga in the RPE by qRT-PCR. Each mRNA level was normalized to Hprt. Data represent mean ± SEM; n = 6–10 mice per group. *P ≤ 0.05. (C) Histogram showing relative mRNA levels of Cryba1, involved in lysosomal function, in the RPE by qRT-PCR. Each mRNA level was normalized to Hprt. Data represent mean ± SEM; n = 7–9 mice per group. *P ≤ 0.05. (D) Immunoblots of CRYBA1/3 and TUBA using RPE/choroid homogenates analysed by mass spectrometry (left, proteins from 3–4 mice per lane) and isolated RPE protein extracts (right, 1 animal per lane, n = 4 each group).
Figure 4
Figure 4
Mitochondrial oxidative phosphorylation and mitochondrial content are preserved. (A) Dot plot of flux control ratios for LEAK, NADH (N)- and Succinate (S)- OXPHOS pathways. (B) Dot plot presenting flux control ratios for Complex IV single step. (C) Dot plot showing cytochrome c control ratio. (D) Dot plot of mitochondrial content as assessed by citrate synthase enzymatic activity assays. Data are presented as mean ± SEM; n = 8 independent experiments.
Figure 5
Figure 5
Microglia/macrophages infiltrate the subretinal space. (A) Confocal image of a cell reactive for IBA-1 (red), actin filaments labelled with phalloidin (green) and nuclei stained with Hoechst (blue). Z-stack orthogonal projections (right, bottom) show an IBA-1 positive cell located on the apical side of the RPE. (Scale bar: 10 μm). (B) Dot plot of the number of IBA-1 positive cells per RPE flatmount. Data are presented as mean ± SEM; n = 4 eyes per group. **P ≤ 0.005. (C) Histogram showing relative Ccl5 mRNA levels in the retina by qRT-PCR. mRNA levels were normalized to Hprt. Data represent mean ± SEM; n = 7–8 mice per group. *P ≤ 0.05.
Figure 6
Figure 6
Summary of events occurring prior to photoreceptor death. Daily renewal of POS relies on phagocytosis of shed POS (in yellow) by underlying RPE cells (cytoplasm, brown; melanosomes, grey; nuclei, dark blue). In healthy cells (on the left), POS are recognized by microvilli (1) and phagosomes containing shed POS are internalized (2). Finally (3), phagosomes fuse with lysosomes (red vesicle), forming mature acidified phagolysosomes (red vesicles containing POS). In TG mice (on the right), photoreceptors expressing the mutant human ELOVL4 protein have outer segment ultrastructural abnormalities. Presentation of these segments to RPE cells leads to impaired phagolysosome maturation. Less acidified phagolysosomes are detected during the burst of phagocytic activity (2 hours after light onset). Lysosomal protein CRYBA1/A3 levels remain abundant (3 and 5 hours after light onset). Vacuoles (in white) form at the basal RPE. RPE cells produce CRYBB2, a protein present in AMD drusen. Phagocytic cells (microglia/macrophages, pale blue) are recruited to the subretinal space.

References

    1. Agbaga MP, et al. Role of Stargardt-3 macular dystrophy protein (ELOVL4) in the biosynthesis of very long chain fatty acids. Proc. Natl. Acad. Sci. USA. 2008;105:12843–12848. doi: 10.1073/pnas.0802607105. - DOI - PMC - PubMed
    1. Grayson C, Molday RS. Dominant negative mechanism underlies autosomal dominant Stargardt-like macular dystrophy linked to mutations in ELOVL4. J. Biol. Chem. 2005;280:32521–32530. doi: 10.1074/jbc.M503411200. - DOI - PubMed
    1. Barabas P, et al. Role of ELOVL4 and very long-chain polyunsaturated fatty acids in mouse models of Stargardt type 3 retinal degeneration. Proc. Natl. Acad. Sci. USA. 2013;110:5181–5186. doi: 10.1073/pnas.1214707110. - DOI - PMC - PubMed
    1. Kuny S, Gaillard F, Sauvé Y. Differential gene expression in eyecup and retina of a mouse model of Stargardt-like macular dystrophy (STGD3) Invest. Ophthalmol. Vis. Sci. 2012;53:664–675. doi: 10.1167/iovs.11-8418. - DOI - PubMed
    1. Logan S, et al. Deciphering mutant ELOVL4 activity in autosomal-dominant Stargardt macular dystrophy. Proc. Natl. Acad. Sci. USA. 2013;110:5446–5451. doi: 10.1073/pnas.1217251110. - DOI - PMC - PubMed

Publication types

MeSH terms

Substances

Supplementary concepts