. 2018 Apr 25;6(4):496-507.e6.
doi: 10.1016/j.cels.2018.03.009. Epub 2018 Apr 11.

Spatially Correlated Gene Expression in Bacterial Groups: The Role of Lineage History, Spatial Gradients, and Cell-Cell Interactions

Affiliations

Spatially Correlated Gene Expression in Bacterial Groups: The Role of Lineage History, Spatial Gradients, and Cell-Cell Interactions

Simon van Vliet et al. Cell Syst. .

Abstract

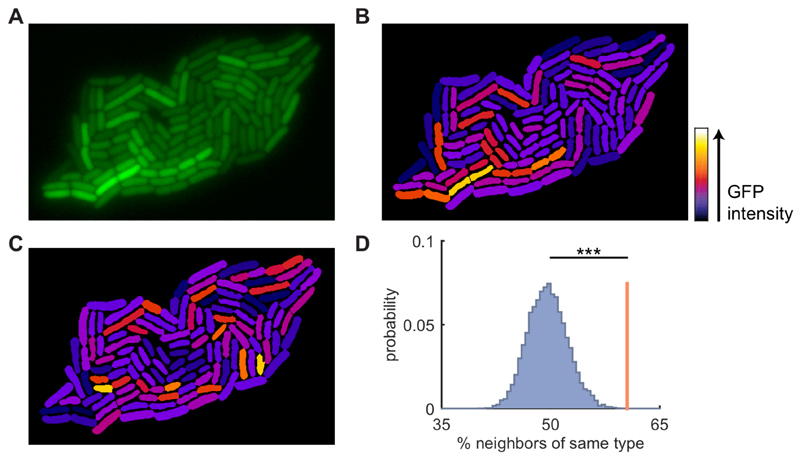
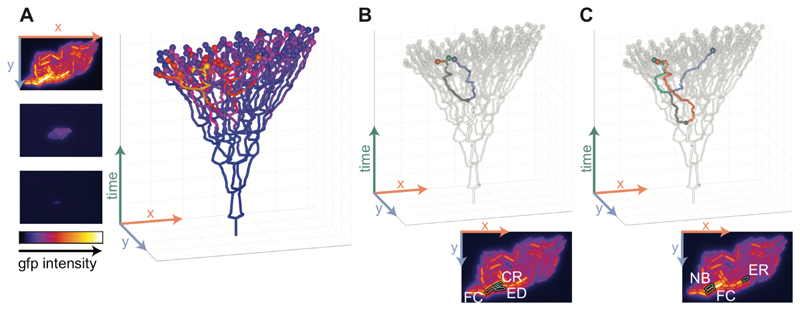
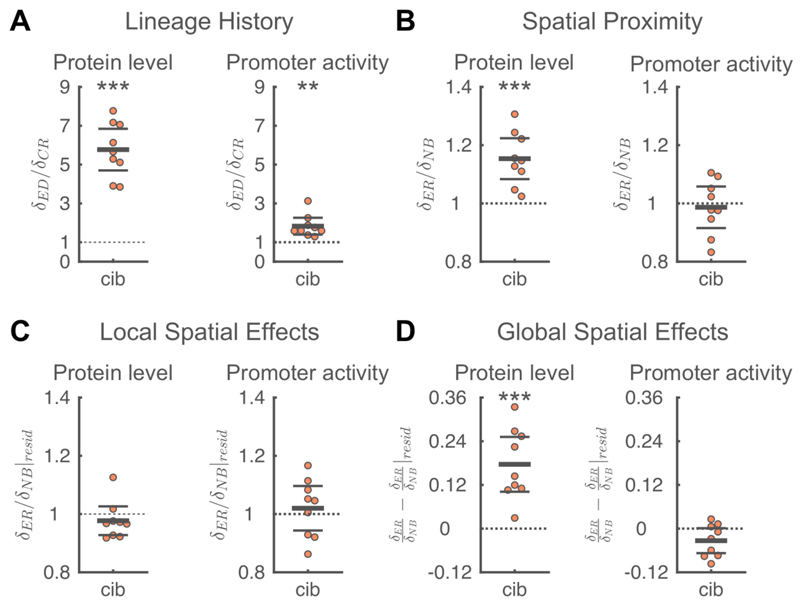
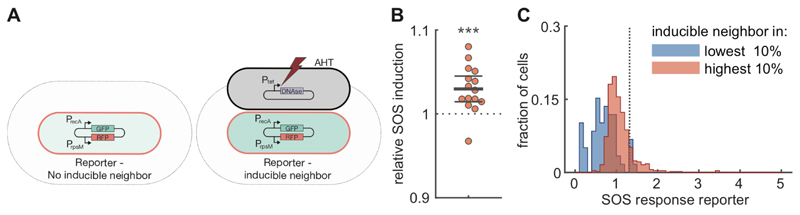
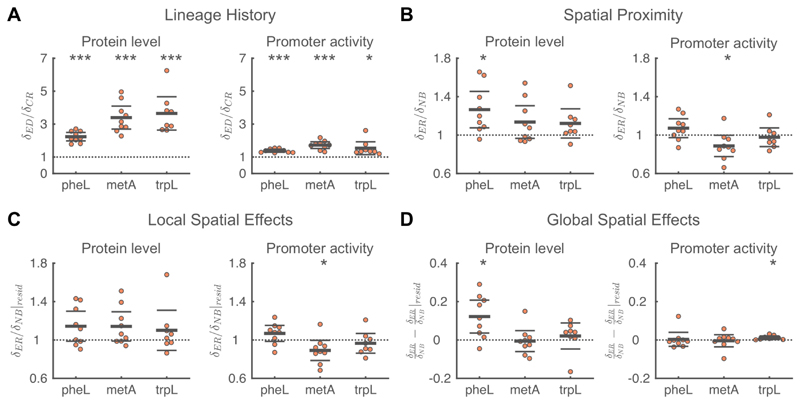
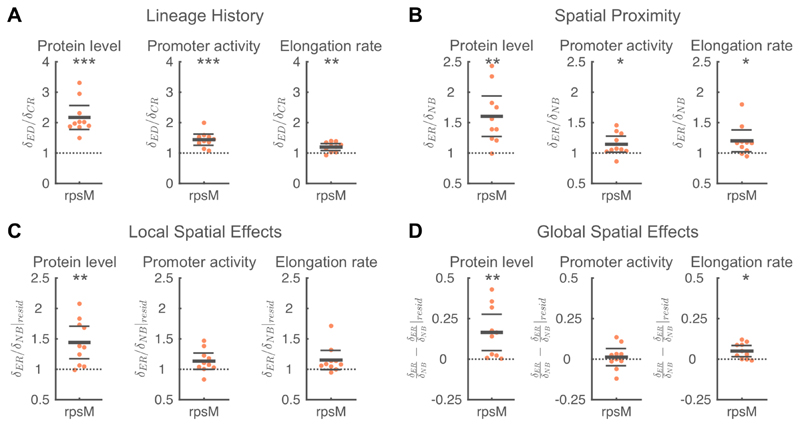
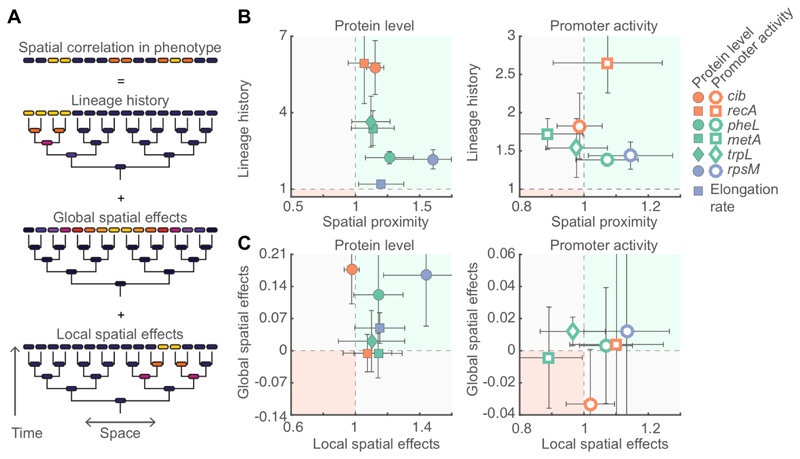
Gene expression levels in clonal bacterial groups have been found to be spatially correlated. These correlations can partly be explained by the shared lineage history of nearby cells, although they could also arise from local cell-cell interactions. Here, we present a quantitative framework that allows us to disentangle the contributions of lineage history, long-range spatial gradients, and local cell-cell interactions to spatial correlations in gene expression. We study pathways involved in toxin production, SOS stress response, and metabolism in Escherichia coli microcolonies and find for all pathways that shared lineage history is the main cause of spatial correlations in gene expression levels. However, long-range spatial gradients and local cell-cell interactions also contributed to spatial correlations in SOS response, amino acid biosynthesis, and overall metabolic activity. Together, our data show that the phenotype of a cell is influenced by its lineage history and population context, raising the question of whether bacteria can arrange their activities in space to perform functions they cannot achieve alone.

Keywords: Escherichia coli; cell-cell interactions; emergent behavior; gene expression dynamics; phenotypic heterogeneity; spatial correlations; statistical method.


Conflict of interest statement

Declaration of interest

The authors declare no competing interests.

Figures

Figure 1
Figure 1. Neighboring cells have similar expression levels of colicin Ib.
A) Fluorescence image of an E. coli microcolony with GFP transcriptional reporter for colicin Ib (cib). B) Reconstructed image of the colony shown in A: cell shapes obtained from cell segmentation are uniformly colored based on their mean corrected intensity (see Figure S1). Note how neighboring cells tend to have similar intensities. C) Same as in B, but fluorescence intensities are randomly permuted among the cells. Note that the similarity between neighboring cells has been reduced compared to B. D) Cells are grouped into two clusters based on their intensity. The red line shows the average fraction of a cell’s neighbors that is of the same type. The blue distribution shows the same quantity obtained after randomly permuting the intensities among the cells (104 permutations). The observed similarity is significantly higher for the true data compared to the randomized data (p<1·10-4, randomization test). See also Figure S1, S2, & S3.
Figure 2
Figure 2. Reconstructing lineage trees to disentangle the effects of space and relatedness.
A) Left: frames from a time-lapse movie of a growing microcolony with a GFP reporter for cib. The images show GFP intensities using a heatmap representation for t=0,3,6h. Right: reconstructed lineage tree. Cells are plotted as a function of location (horizontal plane) and time (vertical axis). Branching points in the lineage tree mark cell division events. The spheres at the tip of the tree represent cells at the final time point with their color indicating the Colicin Ib level of the cell. B) Statistical test to quantify the effect of shared lineage history on similarity in expression levels. A focal cell (FC, red) is compared with its closest relative (CR, green) and with an equidistant cell (ED, blue), which is a cell that has the same distance to the focal cell as the closest relative, but that is less related. C) Statistical test to quantify the effect of spatial proximity on similarity in expression levels. A focal cell (FC, red) is compared with one of its neighbors (NB, green) and with an equally-related cell (ER, blue), which is a cell that has the same relatedness to the focal cell as the neighbor, but that is further away in space. B,C) The insets at the bottom show the positions of these cells in the GFP image for the last time point (see panel A).
Figure 3
Figure 3. Factors contributing to spatial correlations in colicin Ib expression dynamics.
A) Shared lineage history leads to similarity in Colicin Ib protein levels (left) and promoter activity (right). The phenotypic difference between a focal cell and an equidistant cell (δED) is significantly larger than the phenotypic difference between a focal cell and its closest relative (δCR), i.e. 〈δEDCR〉 > 1. B) Spatial proximity leads to similarity in Colicin Ib levels but not in promoter activity. For Colicin Ib levels, the phenotypic difference between a focal cell and an equally-related cell (δED) is significantly larger than the phenotypic difference between the focal cell and one of its neighbors (δNB), i.e. 〈δERNB〉 > 1. C) Local spatial effects do not contribute to spatial correlations in Colicin Ib levels or promoter activity. Local spatial effects were calculated using the residuals of a linear regression of a cell’s phenotype to the distance of a cell to the colony edge. The difference in residuals between a focal cell and an equally-related cell (δER|resid) is not significantly different from the difference in residuals between the focal cell and one of its neighbors δNB|resid),i.e. δER/δNB|reside ≈ 1. D) Global spatial effects contribute to spatial correlations in Colicin Ib levels. Global spatial effects were calculated as the difference between the total effects of spatial proximity (panel B) and the local spatial effects (panel C). A-D) Each point corresponds to a microcolony with 117-138 (mean=128) cells; points are horizontally offset. Thick horizontal lines indicate mean, thin lines 95% confidence intervals. Dashed lines indicate the expected value under the null-hypothesis. Null hypothesis rejected with: *p<0.05, **p<0.01, ***p<0.001, t-test, n=9. The statistics are robust to the choice of the equally-related cell (Figure S4A), the size of the colony being analyzed (Figure S4B), and differences in the processing of fluorescent images (Figure S4C). Full distributions are shown in Figure S5. See also Figure S4-8
Figure 4
Figure 4. Direct cell-cell interactions in SOS response.
A) Test for direct interactions in SOS response. Cells with a transcriptional reporter for recA (pSV66-recA-rpsM, red cells) where grown together on agar pads with cells in which SOS response was induced by expressing the nuclease domain of colicin E2 (pSJB18, black cells). After 1h, the average SOS induction level was compared between reporter cells that do (right) and do-not (left) have inducible neighbors. The grey area indicates the region where cells are considered neighbors. Nuclease expression was induced by adding Anhydrotetracycline (AHT) to the agar pad. B). Cells neighboring inducible cells have higher SOS response levels. For each of 15 biological replicates, we measured the GFP intensity of a recA transcriptional reporter in cells with inducible neighbors (51-189 (mean=137) cells) and in cells with no direct inducible neighbors (359-713 (mean=575) cells). Each dot corresponds to a single biological replicate and shows the ratio between the mean GFP intensity in reporter cells next to inducible neighbors compared to the mean intensity in reporter cells without inducible neighbors. Points are horizontally offset, thick horizontal line indicates mean, thin lines 95% confidence intervals, over the 15 replicates. Reporter cells neighboring inducible cells have significantly higher levels of recA expression with a mean relative SOS induction of 1.030 (95% CI=1.015,1.045), p=9·10-4, t-test, n=15. C). Cells neighboring inducible cells with high levels of SOS response strongly upregulate their own stress response levels. Reporter cells (pUA66-recA) were mixed with inducible cells that also contained a recA transcriptional reporter (pSJB18 + pSV66-recA-rpsM) and grown together for 90 min on agar pads containing AHT. The distribution of SOS response levels is shown for reporter cells that are within 5μm of inducible cells with low levels (dimmest 10% of inducible cells, n=59 cells) of SOS response (blue) and for reporter cells that are within 5μm of inducible cells with high levels (brightest 10% of inducible cell, n=503 cells) of SOS response (red). The distributions were obtained by pooling the data of 4 biological replicates. The dashed vertical line indicates an SOS response level of 2 standard deviation above average. Distributions considering only direct neighbors are shown in Figure S9C.
Figure 5
Figure 5. Analyses of factors that contribute to spatial correlations in amino acid synthesis.
A) Shared lineage history leads to similarity in protein levels and promoter activity for all three pathways involved in amino acid synthesis. In all cases, the phenotypic difference between a focal cell and an equidistant cell (δED) is significantly larger than the phenotypic difference between a focal cell and its closest relative (δCR). B) Spatial proximity leads to similarity in PheL protein levels and dissimilarity in metA promoter activity. For PheL protein levels the phenotypic difference between a focal cell and an equally-related cell (δER) is significantly larger than the phenotypic difference between the focal cell and one of its neighbors (δNB). For metA promoter activities, neighboring cells are less similar than expected based on their relatedness. C) The dissimilarity in metA promoter activity is due to local spatial effects. For metA promoter activity, the difference in residuals between a focal cell and an equally-related cell (δER|resid) is significantly smaller than the difference in residuals between the focal cell and one of its neighbors (δNB|resid). D) Global spatial effects lead to similarity in PheL protein levels and trpL promoter activity. A-D) Each point corresponds to a microcolony with 117-138 (mean=128) cells, points are horizontally offset. Thick horizontal lines indicate mean, thin lines 95% confidence intervals. Dashed lines indicate the expected value under the null hypothesis. Null-hypothesis rejected with: *p<0.05, **p<0.01, ***p<0.001, t-test, n=9 (pheL, metA) or 8 (trpL). See also Figure S5,7.
Figure 6
Figure 6. Analyses of factors that contribute to spatial correlations in metabolism.
A) Shared lineage history leads to similarity in RpsM protein levels (left), rpsM promoter activity (middle), and cell elongation rate (right). In all cases, the phenotypic difference between a focal cell and an equidistant cell (δED) is significantly larger than the phenotypic difference between a focal cell and its closest relative (δCR). B) Spatial proximity leads to similarity in RpsM protein levels, rpsM promoter activity, and cell elongation rate. In all cases, the phenotypic difference between a focal cell and an equally-related cell (δER) significantly is larger than the phenotypic difference between the focal cell and one of its neighbors (δNB). C) The similarity in RpsM protein levels is partly due to local spatial effects. For RpsM protein levels, the difference in residuals between a focal cell and an equally-related cell (δER|resid) is significantly larger than the difference in residuals between the focal cell and one of its neighbors (δNB|resid). D) Global spatial effects lead to similarity in RpsM protein levels and cell elongation rate. A-D) Each point corresponds to a microcolony with 117-138 (mean=128) cells, points are horizontally offset. Thick horizontal lines indicate mean, thin lines 95% confidence intervals. Dashed lines indicate the expected value under the null hypothesis. Null hypothesis rejected with: *p<0.05, **p<0.01, ***p<0.001, t-test, n=10. See Figure S10 for a chromosomal rpsM reporter in Salmonella Tm. See also Figure S5-7.
Figure 7
Figure 7. Causes of spatial correlations in phenotype.
A) Spatial correlations in phenotype are the consequence of shared lineage history, global spatial effects, and local spatial effects. B) For each pathway the relative importance of lineage history (〈δERNB〉) and spatial proximity (〈δEDCR〉) is shown for protein level and cell elongation rate (left) and promoter activity (right). In most cases lineage history is the dominant factor (note the different scaling of the axis). C) For each pathway the relative importance of global spatial effects (〈δERNB − δERNB|resid〉) and local spatial effects (〈δERNB|resid〉) is shown for protein level and cell elongation rate (left) and promoter activity (right). B,C) Each point corresponds to the average value over 8-10 microcolonies; the data are identical to those shown in Figures 3, 5, and 6. Error bars indicate 95% confidence intervals. The green shaded region (upper right region) indicates that both factors contribute to similarity in phenotype; the red shaded region (bottom left) indicates that both factors contribute to dissimilarity in phenotype; in the other two regions (grey shading) the two factors have opposing effects.

References

    1. Ackermann M. A functional perspective on phenotypic heterogeneity in microorganisms. Nat Rev Microbiol. 2015;13:497–508. - PubMed
    1. Ackermann M, Stecher B, Freed NE, Songhet P, Hardt W-D, Doebeli M. Self-destructive cooperation mediated by phenotypic noise. Nature. 2008;454:987–990. - PubMed
    1. Bassler BL, Losick R. Bacterially speaking. Cell. 2006;125:237–246. - PubMed
    1. Berdahl A, Torney CJ, Ioannou CC, Faria JJ, Couzin ID. Emergent sensing of complex environments by mobile animal groups. Science. 2013;339:574–576. - PubMed
    1. Bergmiller T, Ackermann M. Pole age affects cell size and the timing of cell division in Methylobacterium extorquens AM1. J Bacteriol. 2011;193:5216–5221. - PMC - PubMed

MeSH terms

LinkOut - more resources