

Epoxygenase inactivation exacerbates diet and aging-associated metabolic dysfunction resulting from impaired adipogenesis
- PMID: 29656108
- PMCID: PMC6001407
- DOI: 10.1016/j.molmet.2018.03.003
Epoxygenase inactivation exacerbates diet and aging-associated metabolic dysfunction resulting from impaired adipogenesis
Abstract
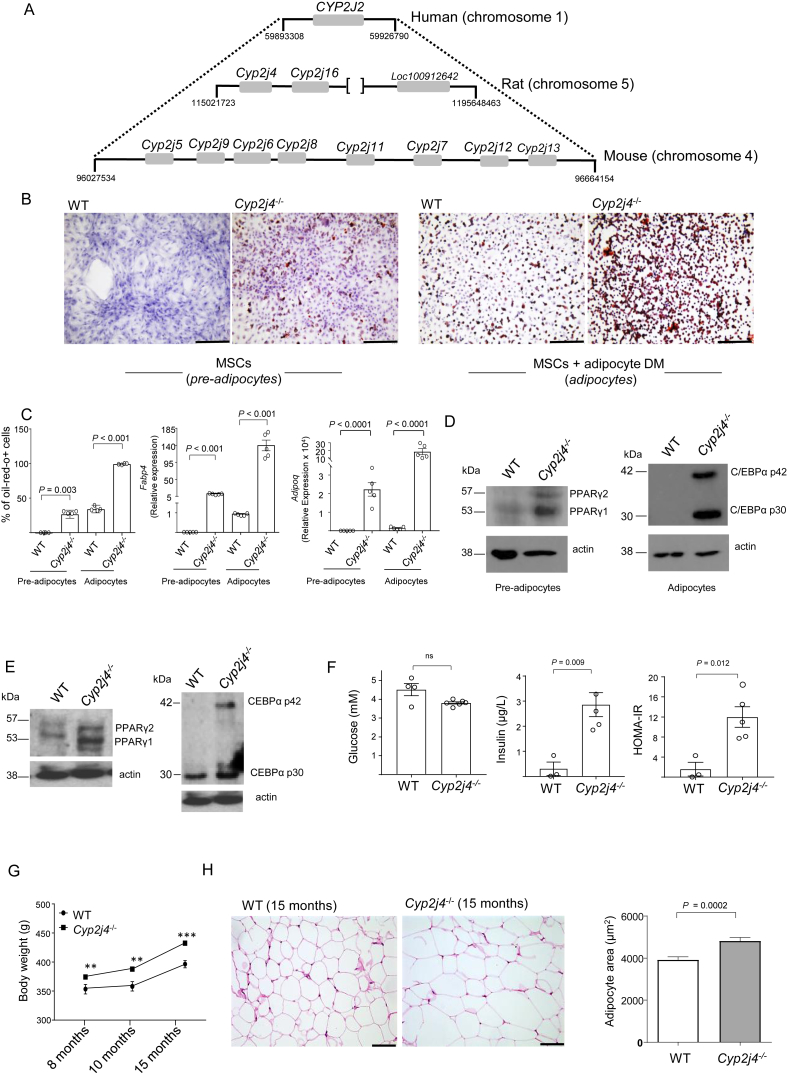
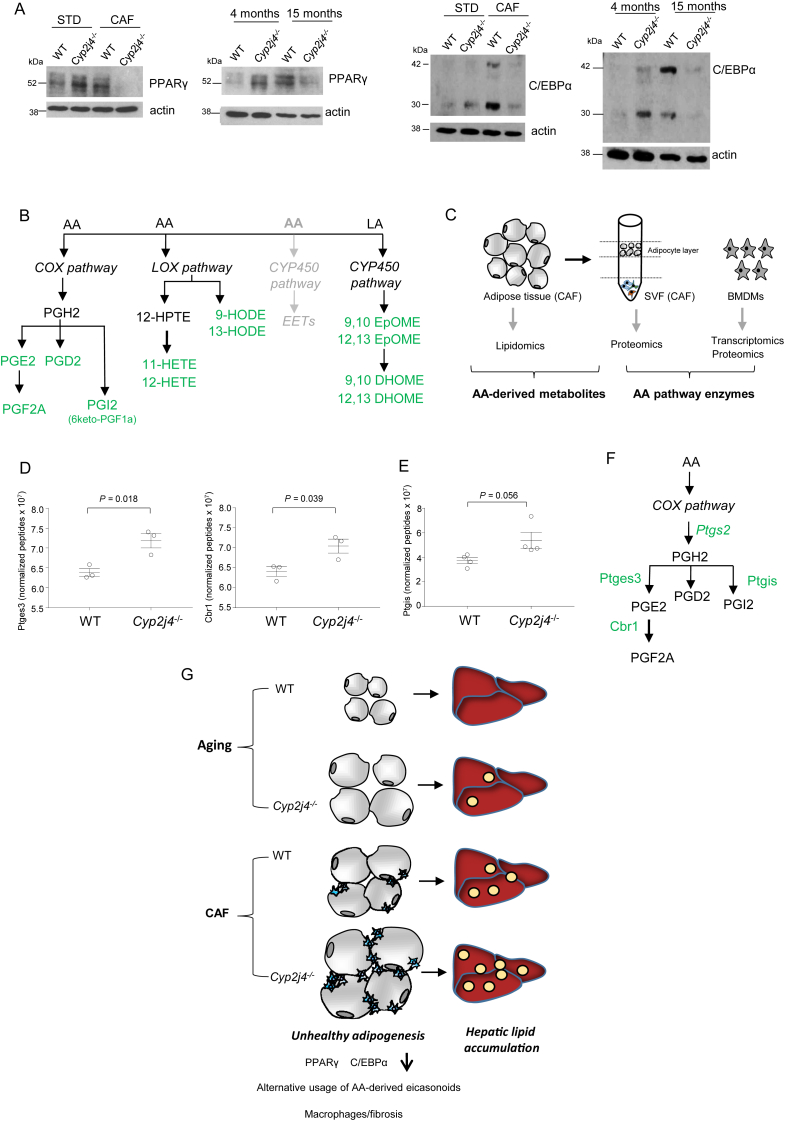
Objective: When molecular drivers of healthy adipogenesis are perturbed, this can cause hepatic steatosis. The role of arachidonic acid (AA) and its downstream enzymatic cascades, such as cyclooxygenase, in adipogenesis is well established. The exact contribution of the P450 epoxygenase pathway, however, remains to be established. Enzymes belonging to this pathway are mainly encoded by the CYP2J locus which shows extensive allelic expansion in mice. Here we aimed to establish the role of endogenous epoxygenase during adipogenesis under homeostatic and metabolic stress conditions.
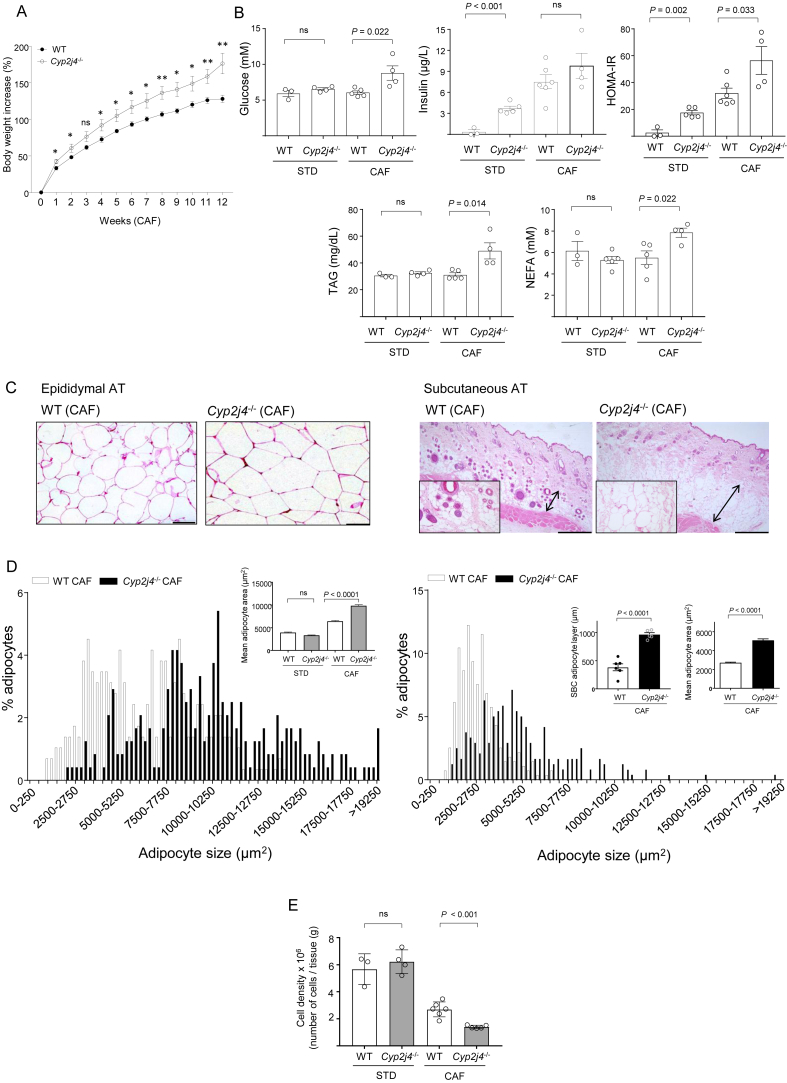
Methods: We took advantage of the simpler genetic architecture of the Cyp2j locus in the rat and used a Cyp2j4 (orthologue of human CYP2J2) knockout rat in two models of metabolic dysfunction: physiological aging and cafeteria diet (CAF). The phenotyping of Cyp2j4-/- rats under CAF was integrated with proteomics (LC-MS/MS) and lipidomics (LC-MS) analyses in the liver and the adipose tissue.
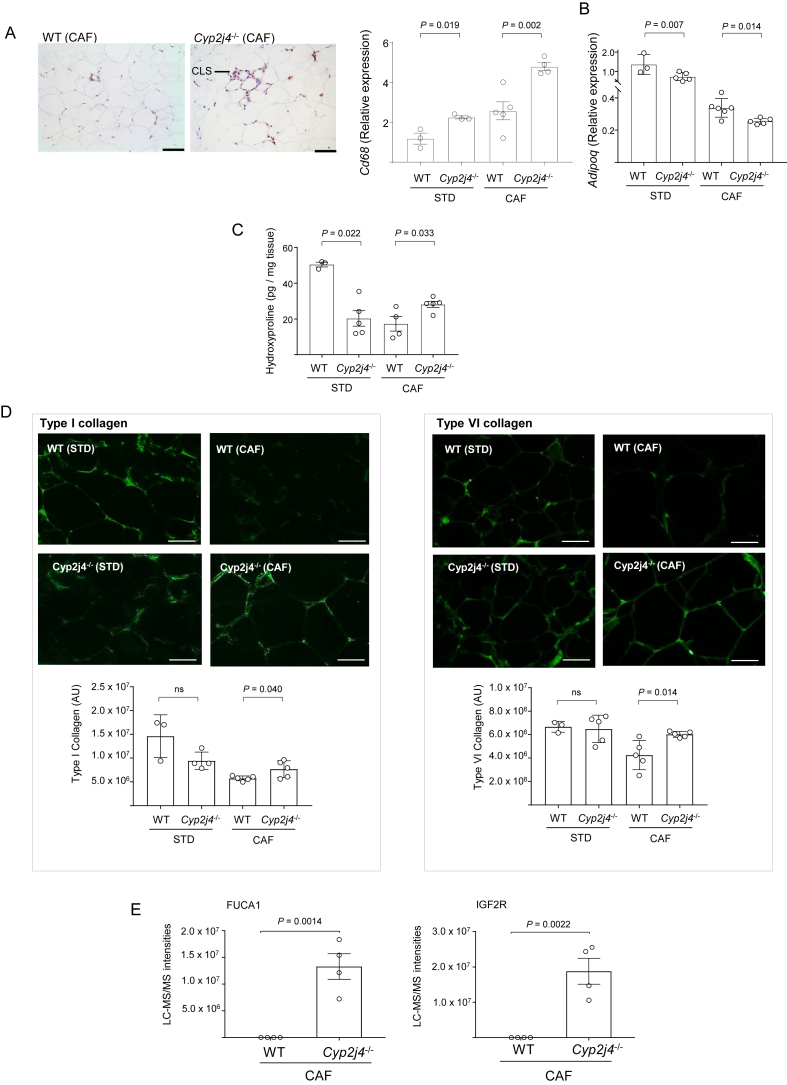
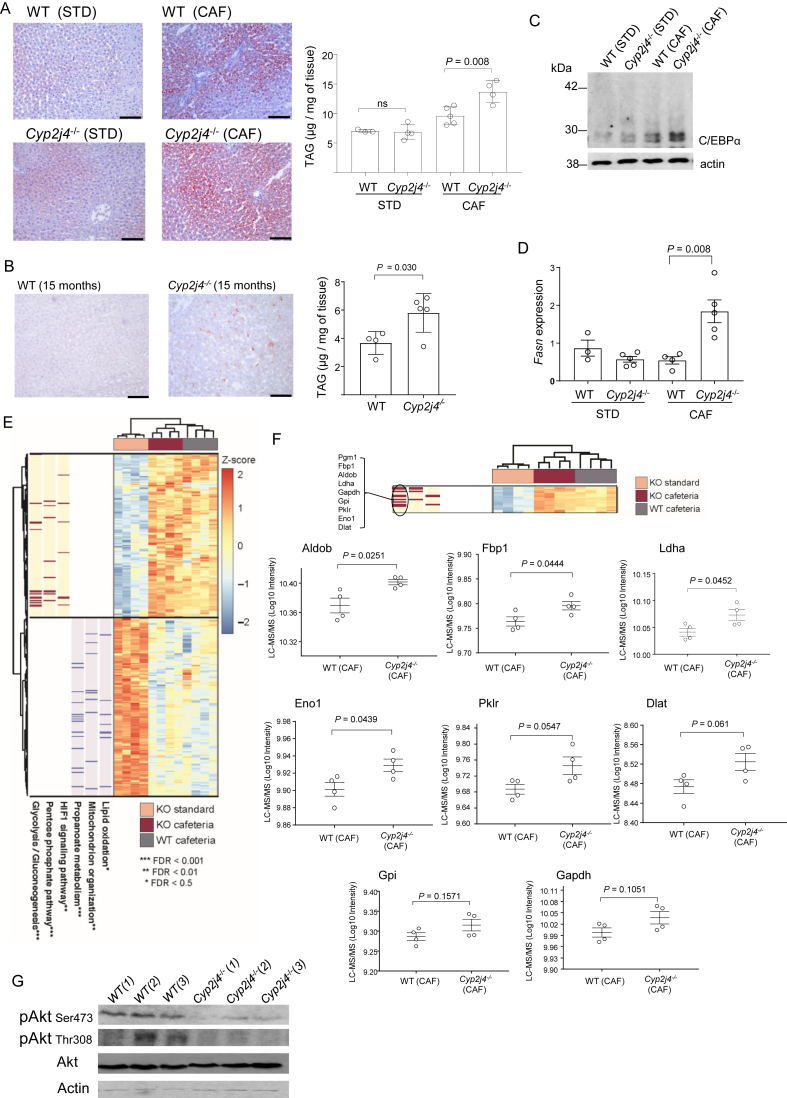
Results: We report that Cyp2j4 deletion causes adipocyte dysfunction under metabolic challenges. This is characterized by (i) down-regulation of white adipose tissue (WAT) PPARγ and C/EBPα, (ii) adipocyte hypertrophy, (iii) extracellular matrix remodeling, and (iv) alternative usage of AA pathway. Specifically, in Cyp2j4-/- rats treated with a cafeteria diet, the dysfunctional adipogenesis is accompanied by exacerbated weight gain, hepatic lipid accumulation, and dysregulated gluconeogenesis.
Conclusion: These results suggest that AA epoxygenases are essential regulators of healthy adipogenesis. Our results uncover their synergistic role in fine-tuning AA pathway in obesity-mediated hepatic steatosis.
Keywords: Adipogenesis; Aging; Arachidonic acid; Cafeteria diet; Cytochrome P450 2j4; Steatosis.
Copyright © 2018 The Authors. Published by Elsevier GmbH.. All rights reserved.
Figures
Similar articles
-
Quercetin and its derivative Q2 modulate chromatin dynamics in adipogenesis and Q2 prevents obesity and metabolic disorders in rats.J Nutr Biochem. 2019 Jul;69:151-162. doi: 10.1016/j.jnutbio.2019.03.019. Epub 2019 Apr 8. J Nutr Biochem. 2019. PMID: 31096072
-
Adipocyte Septin-7 attenuates obesogenic adipogenesis and promotes lipolysis to prevent obesity.Mol Metab. 2025 May;95:102114. doi: 10.1016/j.molmet.2025.102114. Epub 2025 Feb 25. Mol Metab. 2025. PMID: 40015624 Free PMC article.
-
Quercetin attenuates adipose hypertrophy, in part through activation of adipogenesis in rats fed a high-fat diet.J Nutr Biochem. 2020 May;79:108352. doi: 10.1016/j.jnutbio.2020.108352. Epub 2020 Feb 4. J Nutr Biochem. 2020. PMID: 32145471
-
The contribution of vitamin A to autocrine regulation of fat depots.Biochim Biophys Acta. 2012 Jan;1821(1):190-7. doi: 10.1016/j.bbalip.2011.06.004. Epub 2011 Jun 13. Biochim Biophys Acta. 2012. PMID: 21704731 Free PMC article. Review.
-
Impaired Remodeling of White Adipose Tissue in Obesity and Aging: From Defective Adipogenesis to Adipose Organ Dysfunction.Cells. 2024 Apr 30;13(9):763. doi: 10.3390/cells13090763. Cells. 2024. PMID: 38727299 Free PMC article. Review.
Cited by
-
Arachidonic acid in aging: New roles for old players.J Adv Res. 2025 Apr;70:79-101. doi: 10.1016/j.jare.2024.05.003. Epub 2024 May 4. J Adv Res. 2025. PMID: 38710468 Free PMC article. Review.
-
Rat models of human diseases and related phenotypes: a systematic inventory of the causative genes.J Biomed Sci. 2020 Aug 2;27(1):84. doi: 10.1186/s12929-020-00673-8. J Biomed Sci. 2020. PMID: 32741357 Free PMC article. Review.
-
Quantitative proteomics to study aging in rabbit liver.Mech Ageing Dev. 2020 Apr;187:111227. doi: 10.1016/j.mad.2020.111227. Epub 2020 Feb 29. Mech Ageing Dev. 2020. PMID: 32126221 Free PMC article.
-
Adipoclast: a multinucleated fat-eating macrophage.BMC Biol. 2021 Nov 19;19(1):246. doi: 10.1186/s12915-021-01181-3. BMC Biol. 2021. PMID: 34794433 Free PMC article. Review.
-
New perspectives on polycystic ovary syndrome: hypothalamic-sympathetic-adipose tissue interaction.J Ovarian Res. 2025 Jul 4;18(1):145. doi: 10.1186/s13048-025-01724-0. J Ovarian Res. 2025. PMID: 40615863 Free PMC article. Review.
References
-
- Kusminski C.M., Bickel P.E., Scherer P.E. Targeting adipose tissue in the treatment of obesity-associated diabetes. Nature Reviews Drug Discovery. 2016;15:639–660. - PubMed
-
- Scherer P.E. Adipose tissue: from lipid storage compartment to endocrine organ. Diabetes. 2006;55:1537–1545. - PubMed
-
- Tontonoz P., Hu E., Spiegelman B.M. Stimulation of adipogenesis in fibroblasts by PPAR gamma 2, a lipid-activated transcription factor. Cell. 1994;79:1147–1156. - PubMed
Publication types
MeSH terms
Substances
Grants and funding
LinkOut - more resources
Full Text Sources
Other Literature Sources
Medical
