

Synergistic action of dual IGF1/R and MEK inhibition sensitizes childhood acute lymphoblastic leukemia (ALL) cells to cytotoxic agents and involves downregulation of STAT6 and PDAP1
- PMID: 29656114
- PMCID: PMC6371922
- DOI: 10.1016/j.exphem.2018.04.002
Synergistic action of dual IGF1/R and MEK inhibition sensitizes childhood acute lymphoblastic leukemia (ALL) cells to cytotoxic agents and involves downregulation of STAT6 and PDAP1
Abstract
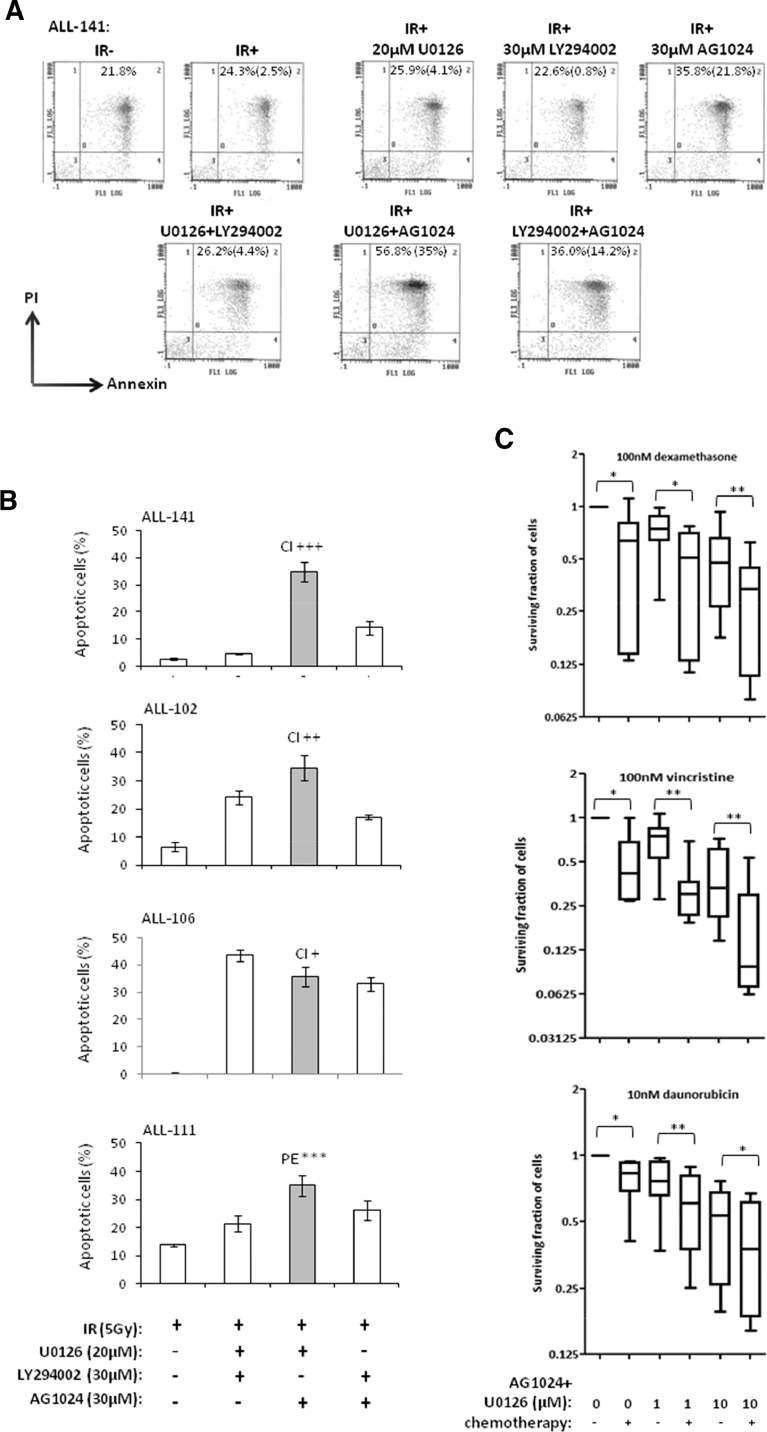
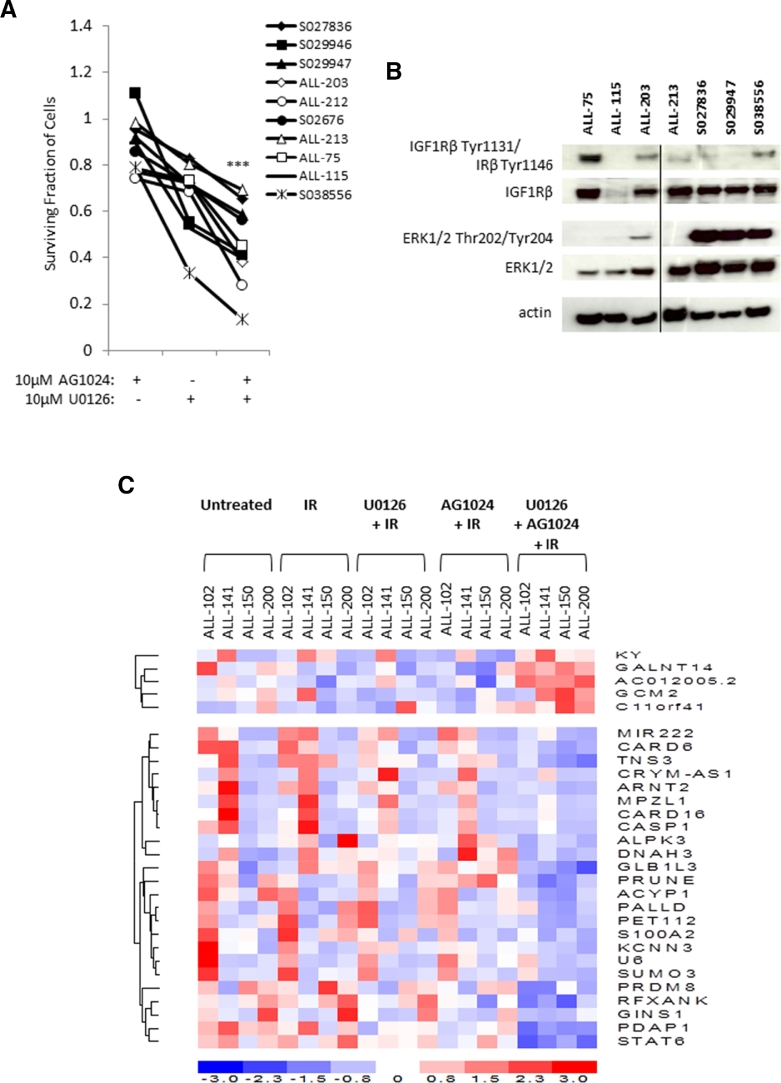
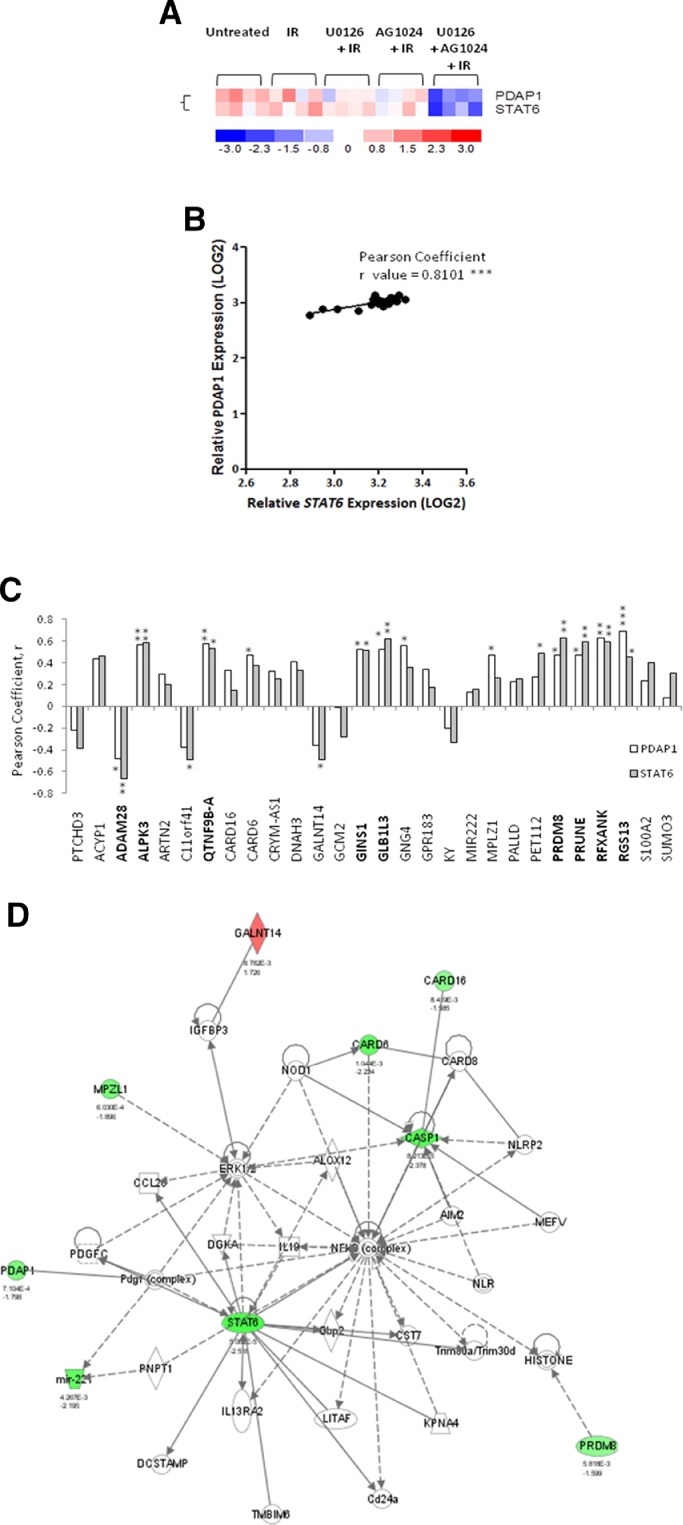
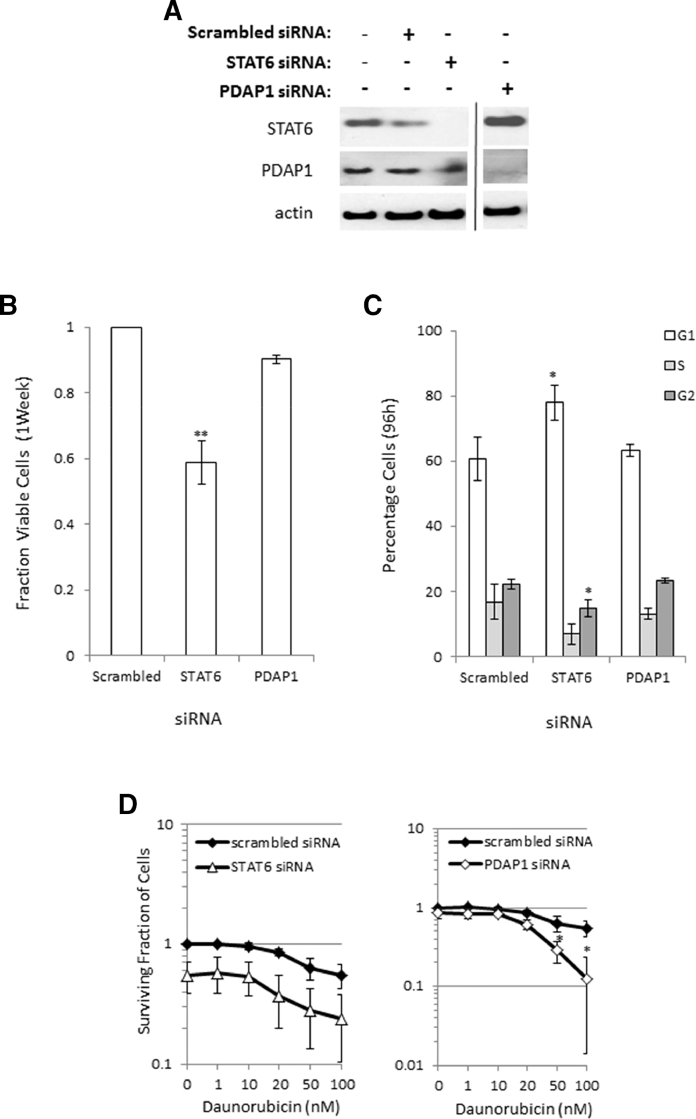
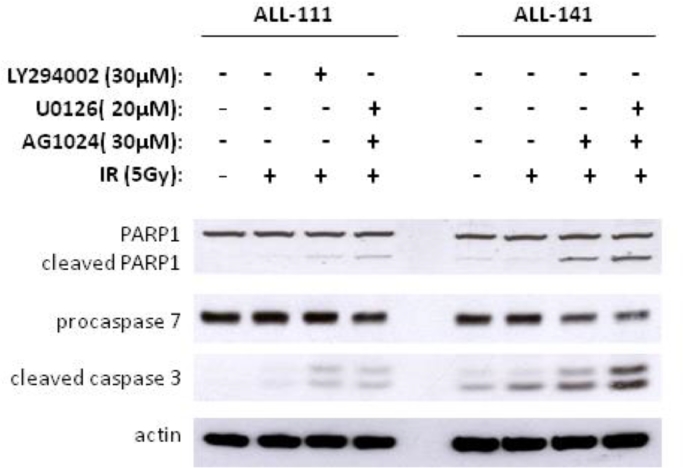
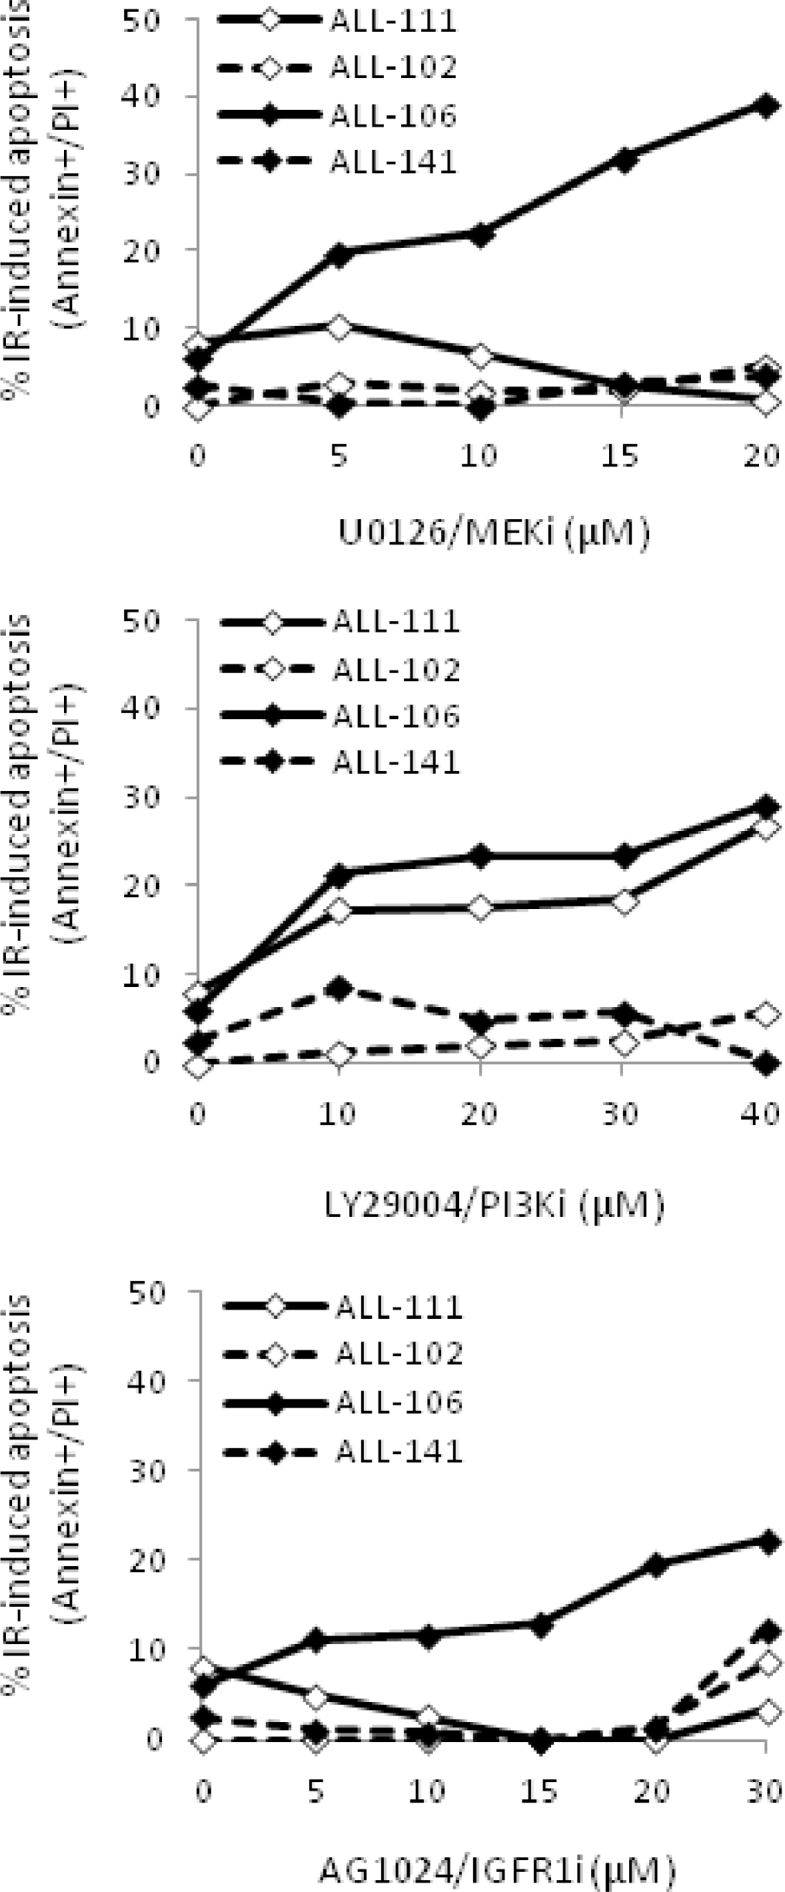
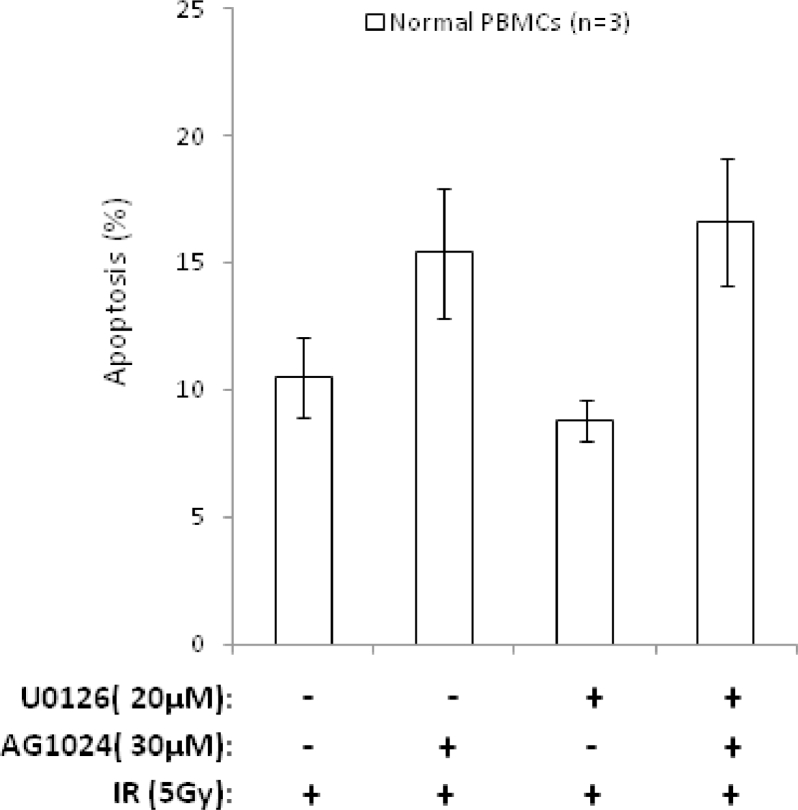
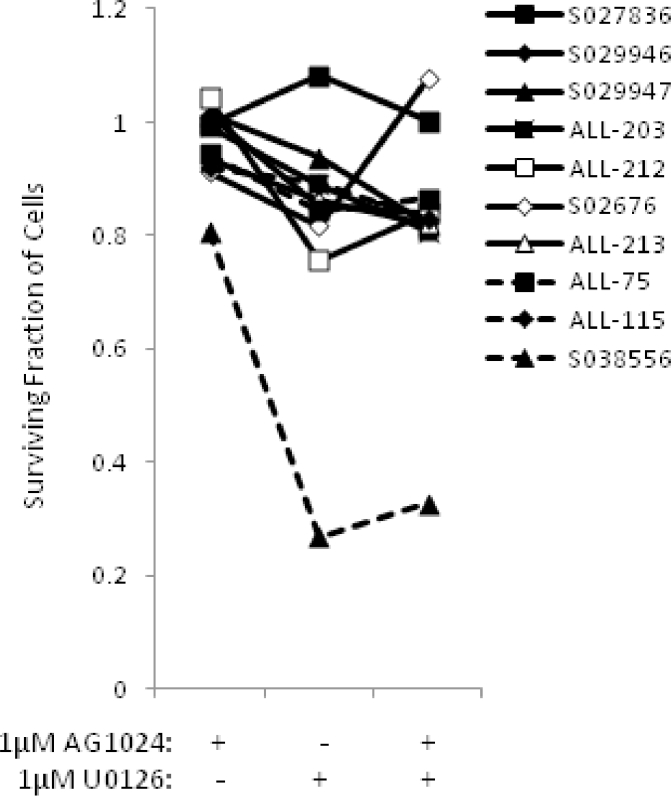
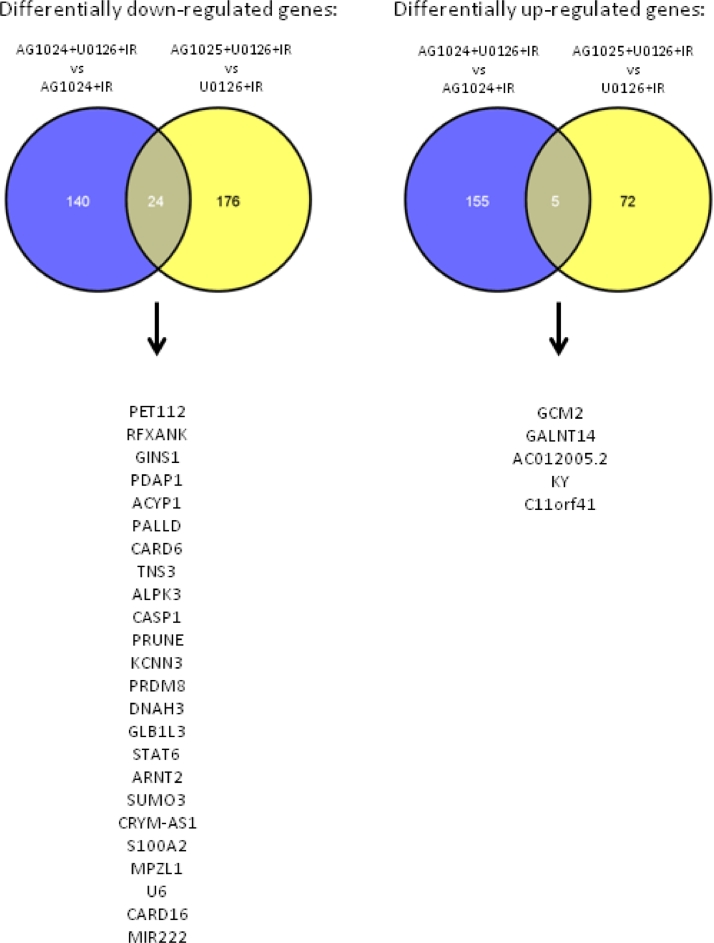
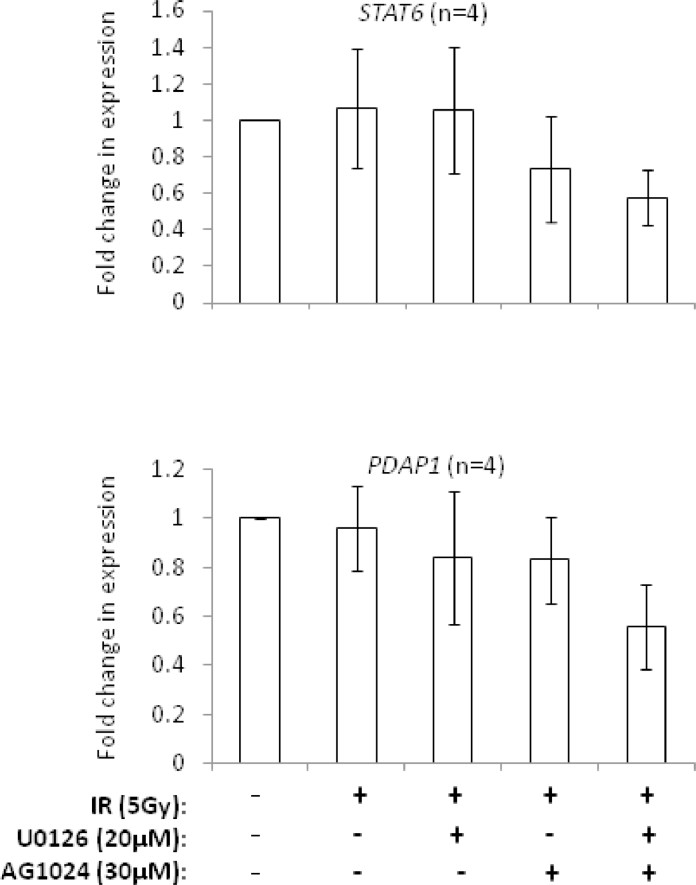
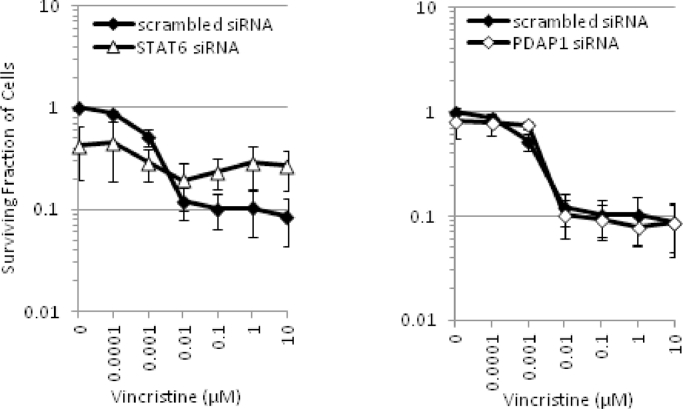
Heterogeneous upregulation of multiple prosurvival pathways underlies resistance to damage-induced apoptosis in acute lymphoblastic leukemia (ALL) cells despite normal p53 responses. Here, we show that the dual combination of insulin-like growth factor 1 (IGF1)/IGF1 receptor (IGF1/R) and mitogen-activated protein kinase/extracellular signal-regulated kinase (ERK) kinase (MEK) inhibition using AG1024 + U0126 can sensitize apoptosis-resistant ALL cells to ionizing radiation-induced DNA damage irrespective of effect of single pathway inhibition in vitro. This AG1024 + U0126 combination also significantly potentiates the ability of the core chemotherapy compounds vincristine, dexamethasone, and daunorubicin to kill ALL cells in vitro. Evidence of the synergistic action of AG1024 + U0126 in samples with variable basal levels of phosphorylated IGF1/Rβ and ERK1/2 suggested additional targets of this drug combination. Consistent with this, gene expression profiling identified 32 "synergy genes" differentially targeted by IGF1/R + MEK inhibition and, among these, Signal transducer and activator of transcription 6 (STAT6) and platelet-derived growth factor-associated protein 1 (PDAP1) were the most differentially downregulated cluster. Pearson correlation analysesrevealed that STAT6 and PDAP1 display significant expression codependency and a common expression pattern linked with other key "synergy" genes, supporting their predicted role in an STAT6-ERK-nuclear factor kappa beta (NF-κB) network. Knockdown studies revealed that loss of STAT6, but not PDAP1, impinges on the cell cycle, causing reduced numbers of viable cells. In combination with daunorubicin, STAT6 loss has an additive effect on cell killing, whereas PDAP1 loss is synergistic, indicating an important role of PDAP1 in the cellular response to this anthracycline. Inhibition of STAT6 or PDAP1 may therefore represent a potential novel therapeutic strategy for resistant ALL by enhancing sensitivity to chemotherapy.
Copyright © 2018. Published by Elsevier Inc.
Figures
Similar articles
-
Upstream and downstream mechanisms for the promoting effects of IGF-1 on differentiation of spermatogonia to primary spermatocytes.Life Sci. 2014 Apr 17;101(1-2):49-55. doi: 10.1016/j.lfs.2014.02.016. Epub 2014 Feb 26. Life Sci. 2014. PMID: 24582811
-
Overcoming IGF1R/IR resistance through inhibition of MEK signaling in colorectal cancer models.Clin Cancer Res. 2013 Nov 15;19(22):6219-29. doi: 10.1158/1078-0432.CCR-13-0145. Epub 2013 Sep 17. Clin Cancer Res. 2013. PMID: 24045180 Free PMC article.
-
Cytotoxicity induced by manipulation of signal transduction pathways is associated with down-regulation of Bcl-2 but not Mcl-1 in MCF-7 human breast cancer.Breast Cancer Res Treat. 2001 Nov;70(1):11-20. doi: 10.1023/a:1012564620853. Breast Cancer Res Treat. 2001. PMID: 11767000
-
Inhibition of DNA damage response pathway using combination of DDR pathway inhibitors and radiation in treatment of acute lymphoblastic leukemia cells.Future Oncol. 2021 Jul;17(21):2803-2816. doi: 10.2217/fon-2020-1072. Epub 2021 May 7. Future Oncol. 2021. PMID: 33960207 Review.
-
Signaling pathways activated by daunorubicin.Blood. 2001 Aug 15;98(4):913-24. doi: 10.1182/blood.v98.4.913. Blood. 2001. PMID: 11493433 Review.
Cited by
-
Nuclear Lipid Microdomains Regulate Daunorubicin Resistance in Hepatoma Cells.Int J Mol Sci. 2018 Nov 1;19(11):3424. doi: 10.3390/ijms19113424. Int J Mol Sci. 2018. PMID: 30388783 Free PMC article.
-
Molecular Secrets Revealed: How Diabetes may be Paving the Way for Leukemia.Curr Treat Options Oncol. 2024 Dec;25(12):1563-1579. doi: 10.1007/s11864-024-01281-6. Curr Treat Options Oncol. 2024. PMID: 39585587 Review.
-
PDGFA-associated protein 1 protects mature B lymphocytes from stress-induced cell death and promotes antibody gene diversification.J Exp Med. 2020 Oct 5;217(10):e20200137. doi: 10.1084/jem.20200137. J Exp Med. 2020. PMID: 32609329 Free PMC article.
References
-
- Campana D. Molecular determinants of treatment response in acute lymphoblastic leukemia. Hematology Am Soc Hematol Educ Program. 2008:366–373. - PubMed
-
- Mitchell C, Payne J, Wade R, Vora A, Kinsey S, Richards S, Eden T. The impact of risk stratification by early bone-marrow response in childhood lymphoblastic leukaemia: results from the United Kingdom Medical Research Council trial ALL97 and ALL97/99. Br J Haematol. 2009;146:424–436. - PubMed
-
- Roy A, Cargill A, Love S. Outcome after first relapse in childhood acute lymphoblastic leukaemia: lessons from the United Kingdom R2 trial. Br J Haematol. 2005;130:67–75. - PubMed
Publication types
MeSH terms
Substances
Grants and funding
LinkOut - more resources
Full Text Sources
Other Literature Sources
Molecular Biology Databases
Research Materials
Miscellaneous
