Helicobacter pylori infection-induced H3Ser10 phosphorylation in stepwise gastric carcinogenesis and its clinical implications
- PMID: 29656498
- PMCID: PMC6001454
- DOI: 10.1111/hel.12486
Helicobacter pylori infection-induced H3Ser10 phosphorylation in stepwise gastric carcinogenesis and its clinical implications
Abstract
Background: Our previous works have demonstrated that Helicobacter pylori (Hp) infection can alter histone H3 serine 10 phosphorylation status in gastric epithelial cells. However, whether Helicobacter pylori-induced histone H3 serine 10 phosphorylation participates in gastric carcinogenesis is unknown. We investigate the expression of histone H3 serine 10 phosphorylation in various stages of gastric disease and explore its clinical implication.
Materials and methods: Stomach biopsy samples from 129 patients were collected and stained with histone H3 serine 10 phosphorylation, Ki67, and Helicobacter pylori by immunohistochemistry staining, expressed as labeling index. They were categorized into nonatrophic gastritis, chronic atrophic gastritis, intestinal metaplasia, low-grade intraepithelial neoplasia, high-grade intraepithelial neoplasia, and intestinal-type gastric cancer groups. Helicobacter pylori infection was determined by either 13 C-urea breath test or immunohistochemistry staining.
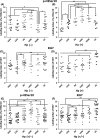
Results: In Helicobacter pylori-negative patients, labeling index of histone H3 serine 10 phosphorylation was gradually increased in nonatrophic gastritis, chronic atrophic gastritis, intestinal metaplasia groups, peaked at low-grade intraepithelial neoplasia, and declined in high-grade intraepithelial neoplasia and gastric cancer groups. In Helicobacter pylori-infected patients, labeling index of histone H3 serine 10 phosphorylation followed the similar pattern as above, with increased expression over the corresponding Helicobacter pylori-negative controls except in nonatrophic gastritis patient whose labeling index was decreased when compared with Helicobacter pylori-negative control. Labeling index of Ki67 in Helicobacter pylori-negative groups was higher in gastric cancer than chronic atrophic gastritis and low-grade intraepithelial neoplasia groups, and higher in intestinal metaplasia group compared with chronic atrophic gastritis group. In Helicobacter pylori-positive groups, Ki67 labeling index was increased stepwise from nonatrophic gastritis to gastric cancer except slightly decrease in chronic atrophic gastritis group. In addition, we noted that histone H3 serine 10 phosphorylation staining is accompanied with its location changes from gastric gland bottom expanded to whole gland as disease stage progress.
Conclusions: These results indicate that stepwise gastric carcinogenesis is associated with altered histone H3 serine 10 phosphorylation, Helicobacter pylori infection enhances histone H3 serine 10 phosphorylation expression in these processes; it is also accompanied with histone H3 serine 10 phosphorylation location change from gland bottom staining expand to whole gland expression. The results suggest that epigenetic dysregulation may play important roles in Helicobacter pylori-induced gastric cancer.
Keywords: Helicobacter pylori; H3 serine 10 phosphorylation; epigenetic; gastric cancer; histone modification.
© 2018 The Authors. Helicobacter Published by John Wiley & Sons Ltd.
Figures


Similar articles
-
Oxidative damage of the gastric mucosa in Helicobacter pylori positive chronic atrophic and nonatrophic gastritis, before and after eradication.Helicobacter. 2003;8(5):503-12. doi: 10.1046/j.1523-5378.2003.00172.x. Helicobacter. 2003. PMID: 14535997
-
[The conditions of Helicobacter pylori colonization in different gastric diseases].Zhonghua Yi Xue Za Zhi. 2008 Jan 22;88(4):230-2. Zhonghua Yi Xue Za Zhi. 2008. PMID: 18361831 Chinese.
-
Role of Helicobacter pylori in gastric carcinoma.Natl Med J India. 1995 Mar-Apr;8(2):58-60. Natl Med J India. 1995. PMID: 7735060
-
Impact of the Microbiota and Gastric Disease Development by Helicobacter pylori.Curr Top Microbiol Immunol. 2017;400:253-275. doi: 10.1007/978-3-319-50520-6_11. Curr Top Microbiol Immunol. 2017. PMID: 28124157 Review.
-
Chronic gastritis, intestinal metaplasia, dysplasia and Helicobacter pylori in gastric cancer: putting the pieces together.Ital J Gastroenterol. 1994 Dec;26(9):449-58. Ital J Gastroenterol. 1994. PMID: 7599347 Review.
Cited by
-
Risk Factors of Prolonged Nausea and Vomiting During Pregnancy.Risk Manag Healthc Policy. 2020 Nov 19;13:2645-2654. doi: 10.2147/RMHP.S273791. eCollection 2020. Risk Manag Healthc Policy. 2020. PMID: 33239926 Free PMC article.
-
Jian-Pi-Yi-Qi-Fang ameliorates chronic atrophic gastritis in rats through promoting the proliferation and differentiation of gastric stem cells.Ann Transl Med. 2022 Sep;10(17):932. doi: 10.21037/atm-22-3749. Ann Transl Med. 2022. PMID: 36172111 Free PMC article.
-
The global prevalence of gastric cancer in Helicobacter pylori-infected individuals: a systematic review and meta-analysis.BMC Infect Dis. 2023 Aug 19;23(1):543. doi: 10.1186/s12879-023-08504-5. BMC Infect Dis. 2023. PMID: 37598157 Free PMC article.
-
Post-translational modifications of histones: Mechanisms, biological functions, and therapeutic targets.MedComm (2020). 2023 May 20;4(3):e292. doi: 10.1002/mco2.292. eCollection 2023 Jun. MedComm (2020). 2023. PMID: 37220590 Free PMC article. Review.
-
Molecular Landscapes of Gastric Pre-Neoplastic and Pre-Invasive Lesions.Int J Mol Sci. 2021 Sep 14;22(18):9950. doi: 10.3390/ijms22189950. Int J Mol Sci. 2021. PMID: 34576114 Free PMC article. Review.
References
-
- Ferlay J, Soerjomataram I, Dikshit R, et al. Cancer incidence and mortality worldwide: sources, methods and major patterns in GLOBOCAN 2012. Int J Cancer. 2015;136:E359‐E386. - PubMed
-
- Lauren P. The two histological main types of gastric carcinoma: diffuse and so‐called intestinal‐type carcinoma. An attempt at a histo‐clinical classification. Acta Pathol Microbiol Scand. 1965;64:31‐49. - PubMed
-
- Yashima K, Sasaki S, Koda M, et al. Premalignant lesions in gastric cancer. Clin J Gastroenterol. 2010;3:6‐12. - PubMed
-
- Tan P, Yeoh KG. Genetics and molecular pathogenesis of gastric adenocarcinoma. Gastroenterology. 2015;149:1153‐1162. e3 - PubMed
Publication types
MeSH terms
Substances
LinkOut - more resources
Full Text Sources
Other Literature Sources
Medical
Research Materials
Miscellaneous

