. 2018 Mar;15(1):66-76.
doi: 10.14245/ns.1836038.019. Epub 2018 Mar 28.

Health Care Burden of Spinal Diseases in the Republic of Korea: Analysis of a Nationwide Database From 2012 Through 2016

Affiliations

Health Care Burden of Spinal Diseases in the Republic of Korea: Analysis of a Nationwide Database From 2012 Through 2016

Chang-Hyun Lee et al. Neurospine. 2018 Mar.

Abstract

Objective: This study aimed to determine the incidence and analyze trends related to spinal diseases based on a national database in the Republic of Korea (ROK) and to elucidate the healthcare burden that will serve as a useful resource for researchers, clinicians, and patients.

Methods: This study was a retrospective analysis of data obtained from Healthcare Bigdata Hub, the Korean Statistical Information Service, and Open Data Portal from 2012 through 2016. The main disease codes for spinal diseases (M40-M54) were used for identification of these conditions.

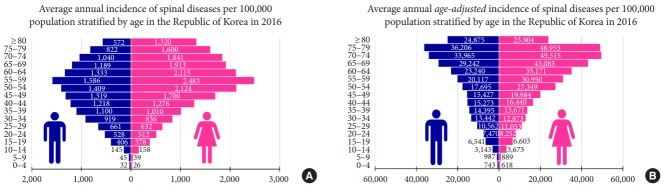
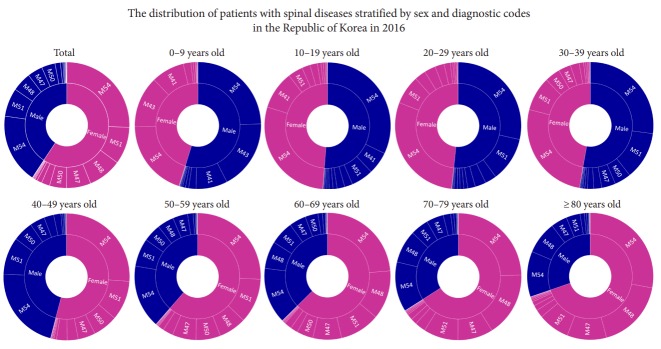
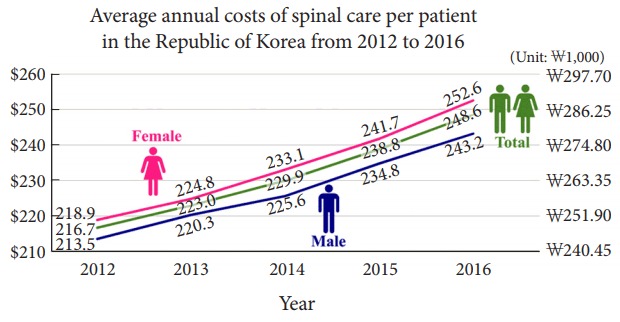
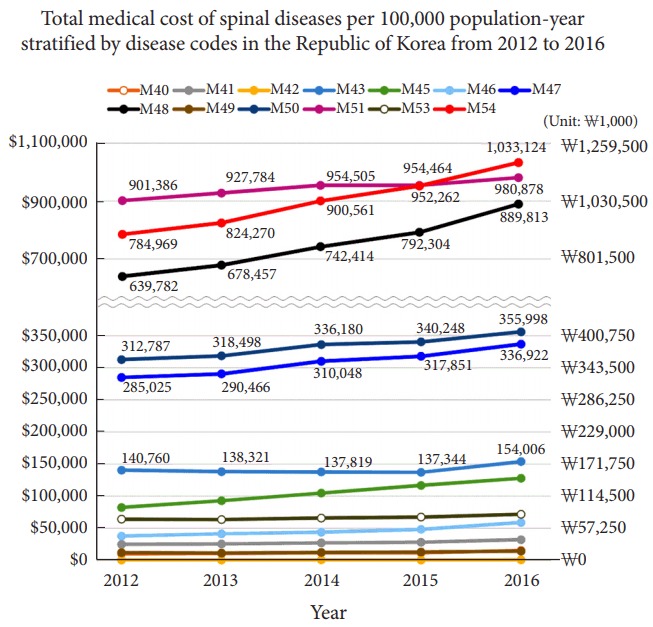
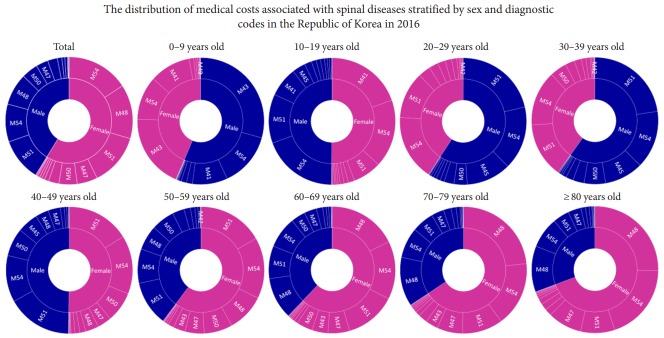
Results: The overall annual incidence rates for spinal disease in the ROK was median 15,877 (men, 13,181; women, 18,588) per 100,000 population, and sex ratio was 1:1.41 (p<0.01). The incidence rate and annual costs per patient increased by 7.6% and 14.7% over 5 years continuously, respectively. The age-adjusted incidence rate increased with age; the highest rates were 42.6% in the 75-79 years group. Patients older than 65 years old accounted for median 31.0% of number of patients and 40.1% of medical expenses over 5 years. Lumbar disc herniation (M51) and spinal stenosis (M48) might accounted for both the highest incidence and medical expenses in patients under the age of 60 and over 60 years, respectively.

Conclusion: The incidence and medical expenditures of spinal disease increased continuously. As the population of ROK in aging, the incidence and medical expenditures due to spondylosis and stenosis (M48) for the old are also increasing. The social burden of spinal diseases in elder patients needs to be prudently considered in health policy makers.

Keywords: Cost; Epidemiology; Nationwide; Socioeconomic status; Spine.


Conflict of interest statement

The authors have nothing to disclose.

Figures

Fig. 1.
Fig. 1.
Average annual incidence of spinal diseases per 100,000 in the Republic of Korea from 2012 to 2016. The incidence increased in both male and female patients by 11.2% and 5.1%, respectively; the overall increase over the 5-year study period was 7.6%.
Fig. 2.
Fig. 2.
The incidence of spinal diseases per 100,000 population in 2016. (A) The overall incidence was the highest among those aged 55–59 years; the age-group shows 1,586 male and 2,483 female patients per 100,000 population. (B) The age-adjusted incidences (age-adjusted to the age distribution of the entire population in the Republic of Korea in 2016) increased with increasing age. In the population aged 70–79 years, the average number of patients was 36,206 (36.2%) in men and 48,953 (49.0%) in women. Approximately 42.6% of the age-group population experienced spinal diseases.
Fig. 3.
Fig. 3.
The average incidence of spinal diseases per 100,000 population stratified by disease code in the Republic of Korea from 2012 to 2016. The most common spinal disease code was dorsalgia (M54, red line), followed by thoracic, thoracolumbar, and lumbosacral intervertebral disc disorders (M51, pink line), other spondylosis including spinal stenosis and ankylosing hyperostosis (M48, black line), spondylosis (M47, blue line), cervical disc disorders (M50, navy line), other dorsopathy, not elsewhere classified (M53, brown line), and other deforming dorsopathies including spondylolisthesis and recurrent atlantoaxial subluxation (M43, light blue line). There were no substantial changes in the ranking of disease over the study period.
Fig. 4.
Fig. 4.
Distribution of patients with spinal diseases stratified by sex and diagnostic codes in the Republic of Korea in 2016. There were more male patients than female patients among those younger than 39 years; however, there were more female patients older than 40 years. Deformity (M41) was common among patients aged 0–19 years. Among those younger than 59 years, diagnostic codes M54 and M51, mainly diseases with disc herniation, were the most common regardless of sex. Among those older than 60 years, M54 and M48 including spinal stenosis was the most common code for both sexes.
Fig. 5.
Fig. 5.
The average annual medical costs of spinal disease per patient in the Republic of Korea from 2012 to 2016. The cost increased from $216.66 (₩248,080) in 2012 to $248.62 (₩284,660) in 2016. Over the 5-year study period, the expenditure increased by a total of 14.7%; it increased by 13.9% and 15.4% for male and female patients, respectively. ₩, Korean Won.
Fig. 6.
Fig. 6.
M51 (purple) accounted for the largest medical expenses, followed by M54 (red), M48 (black), M50 (navy), and M47 (blue). M48 (black) showed rapid increment and medical cost of M48 was close to that of M51 (purple) in 2016. M54 (red) also showed rapid increase similar to M48 (black), and surpassed M51 (purple) in 2016. ₩, Korean Won.
Fig. 7.
Fig. 7.
The distribution of medical costs associated with spinal diseases stratified by sex and diagnostic codes in the Republic of Korea in 2016. In total, the largest medical expenditure was on dorsalgia (M54), followed by other spondylosis including spinal stenosis and ankylosing hyperostosis (M48), and thoracic, thoracolumbar, and lumbosacral intervertebral disc disorders (M51). The ranking of medical expenditure did not exactly match the ranking of the number of patients. In patients aged 0–19 years, M43 and M41 including deformity accounted for the largest expenditure. Among those older than 60 years of age, M48, including spinal stenosis, it accounted for the highest expenditure for both sexes.

References

    1. Andersson G. The epidemiology of spinal disorders. In: Frymoyer J, editor. The adult spine: principles and practice. 2nd ed. Philadelphia: Lippincott-Raven; 1997. pp. 93–141.
    1. Deyo RA, Weinstein JN. Low back pain. N Engl J Med. 2001;344:363–70. - PubMed
    1. Vassilaki M, Hurwitz EL. Insights in public health: perspectives on pain in the low back and neck: global burden, epidemiology, and management. Hawaii J Med Public Health. 2014;73:122–6. - PMC - PubMed
    1. Healthcare Bigdata Hub Frequent disease statistics of inpatients in 2014 [Internet] Available at: http://opendata.hira.or.kr/op/opc/olapHifrqSickInfo.do. Accessed Feb 14, 2018.
    1. Kim CH, Chung CK, Kim MJ, et al. Increased volume of lumbar surgeries for herniated intervertebral disc disease and cost-effectiveness analysis: a nationwide cohort study. Spine (Phila Pa 1976) 2017 Oct 31 [Epub]. https://doi.org/10.1097/BRS.0000000000002473. - DOI - PubMed

LinkOut - more resources