. 2018 Apr 19;173(3):611-623.e17.
doi: 10.1016/j.cell.2018.02.020. Epub 2018 Apr 12.

Timing the Landmark Events in the Evolution of Clear Cell Renal Cell Cancer: TRACERx Renal

Affiliations

Timing the Landmark Events in the Evolution of Clear Cell Renal Cell Cancer: TRACERx Renal

Thomas J Mitchell et al. Cell. .

Abstract

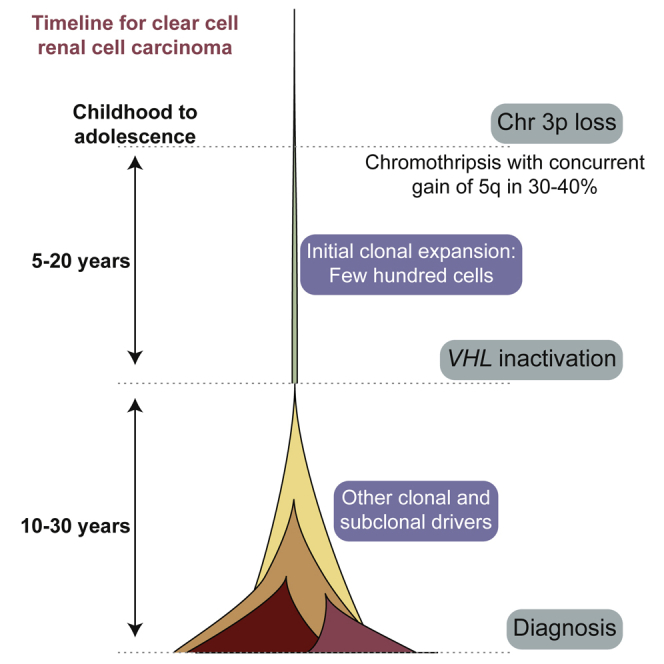
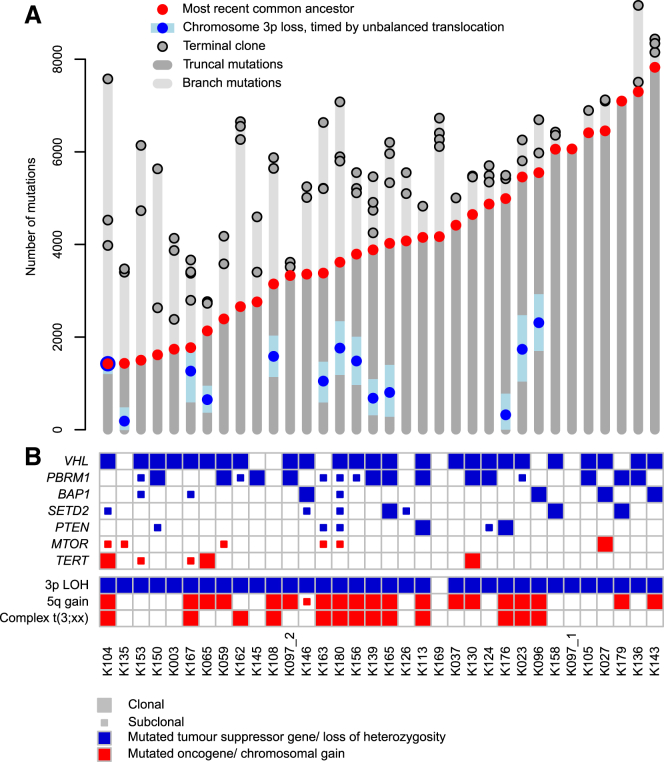
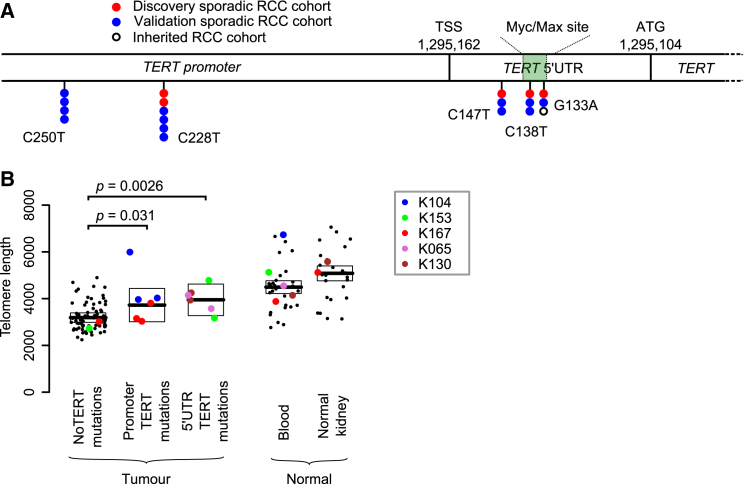
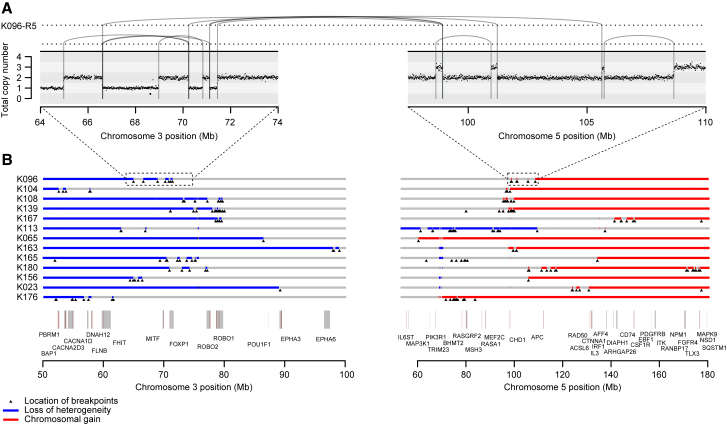
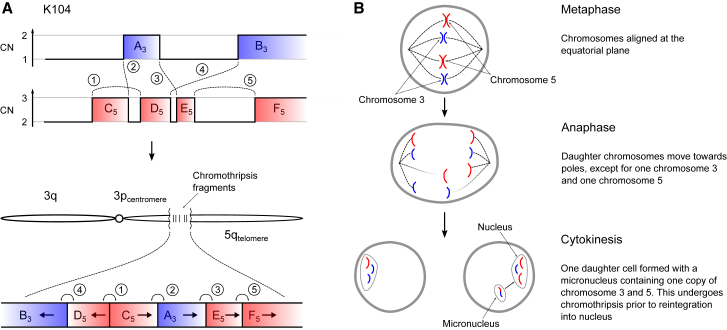
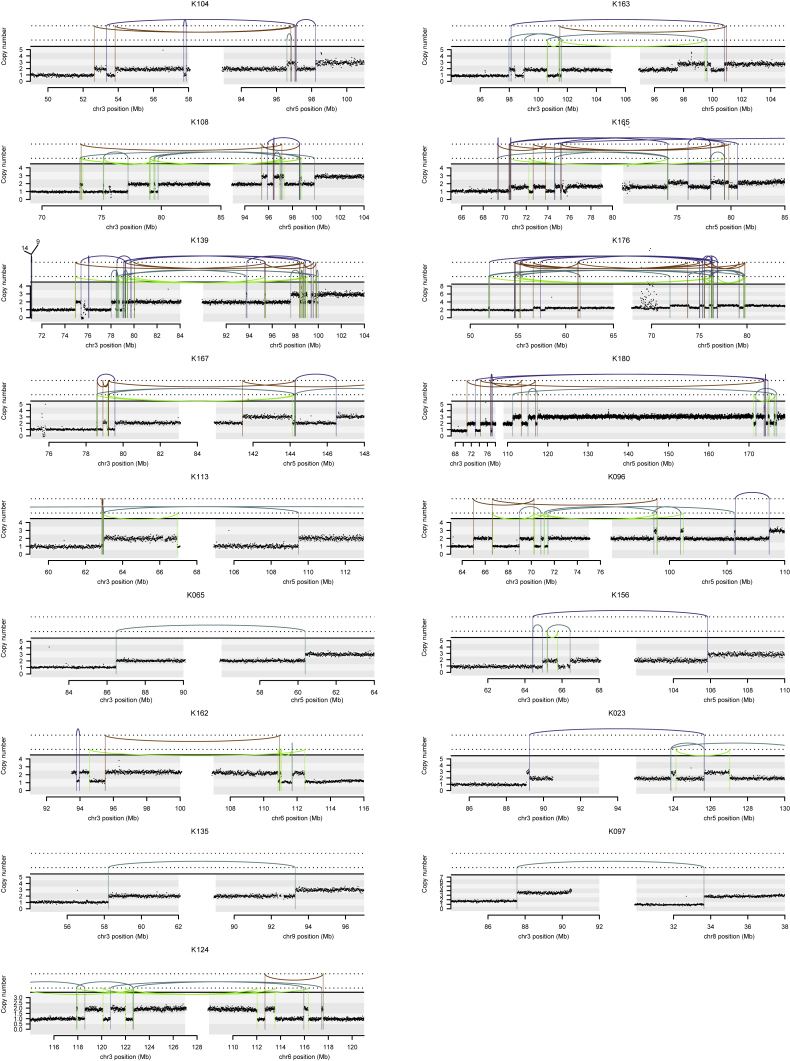
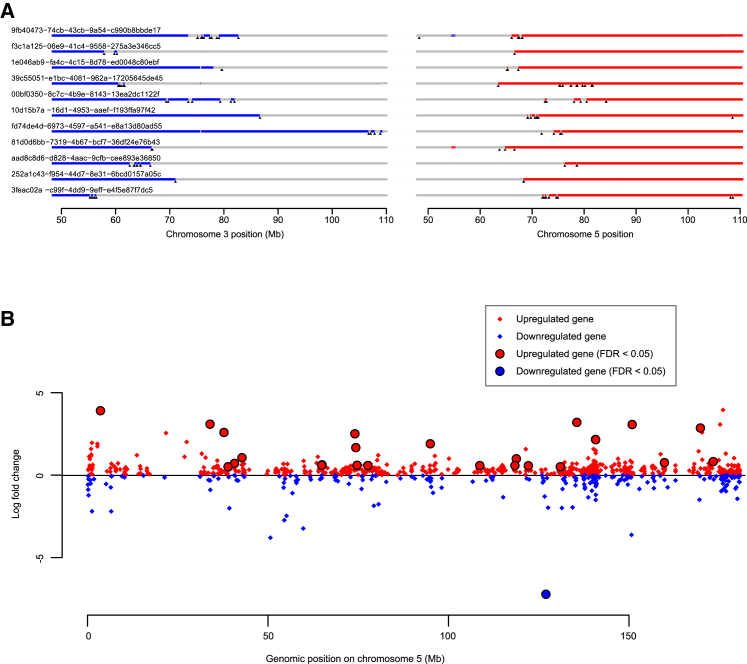
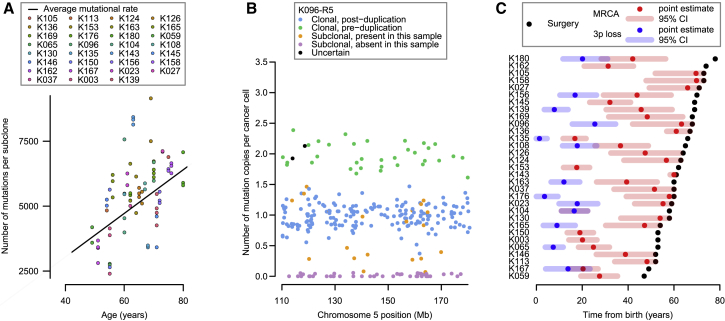
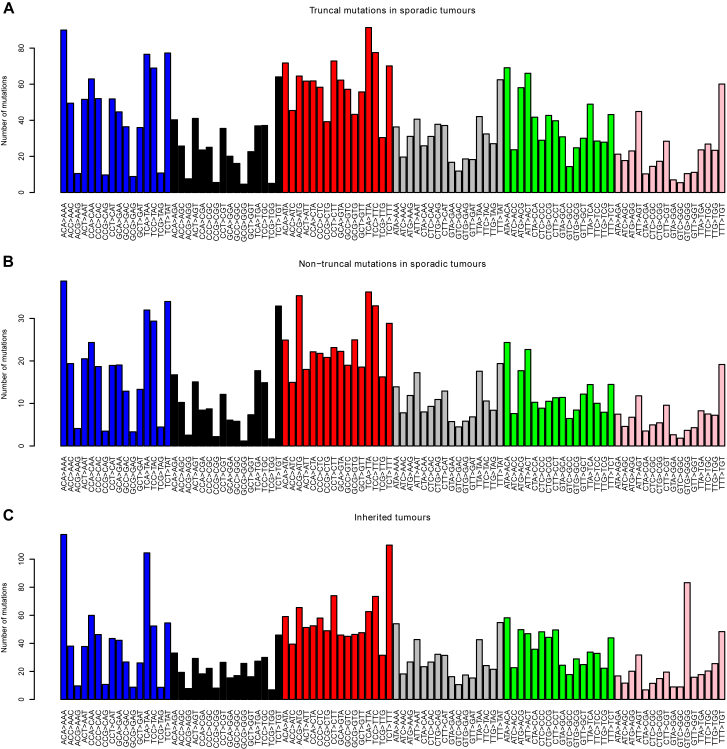
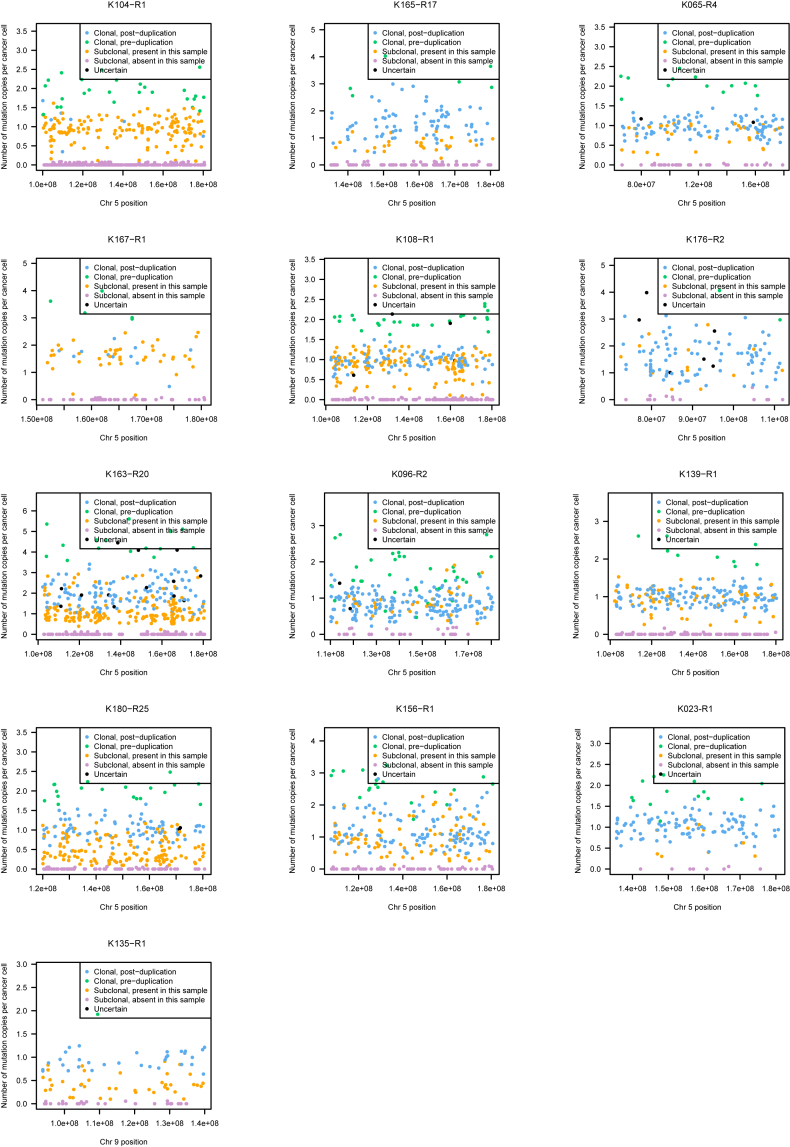
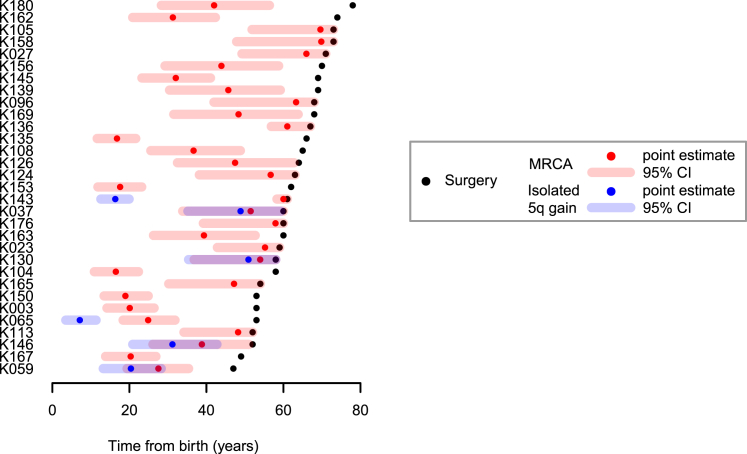
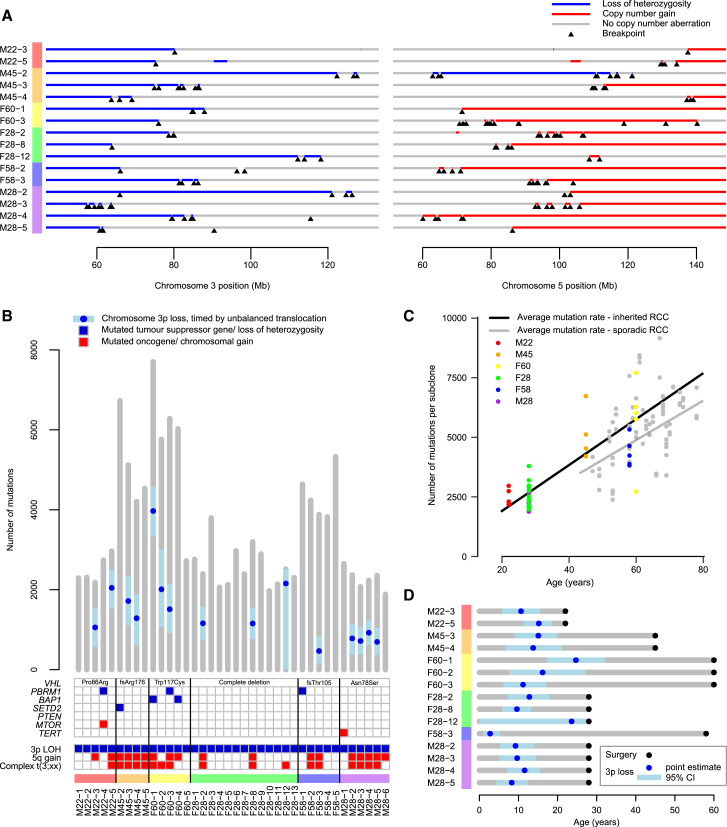
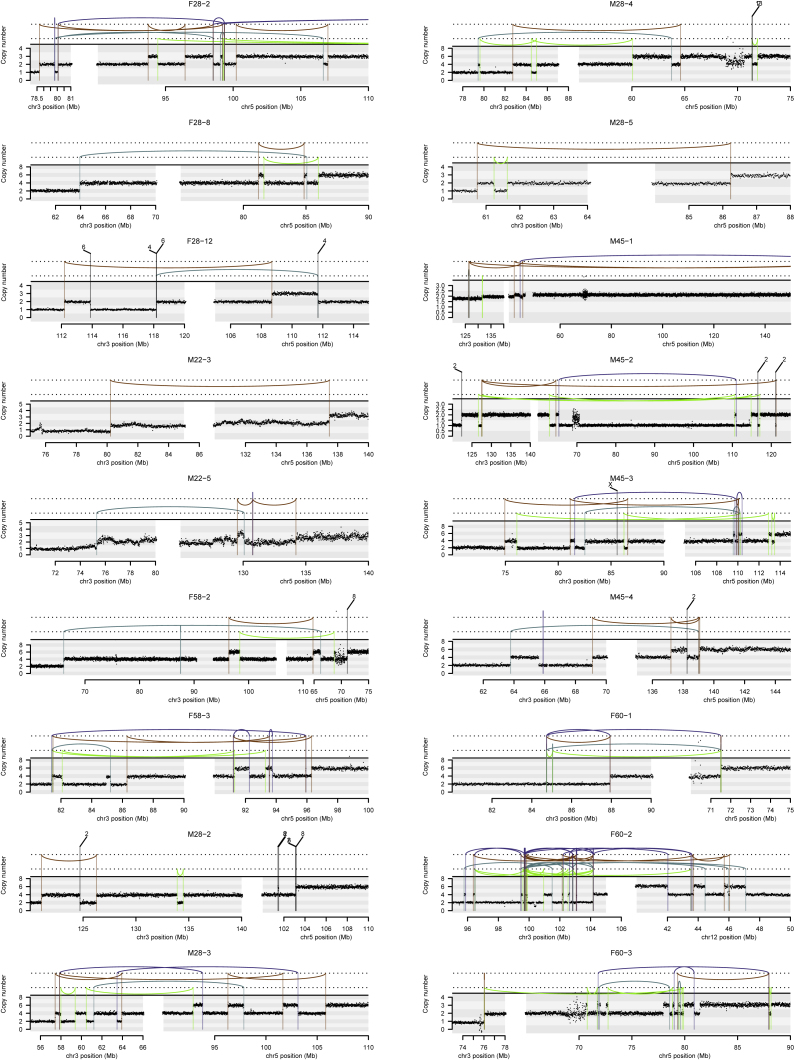
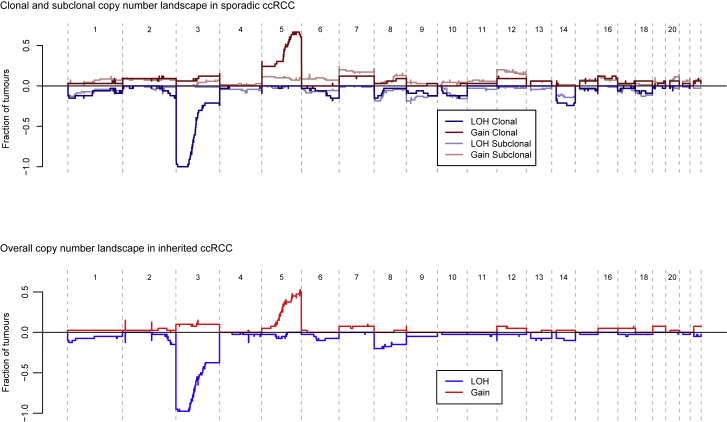
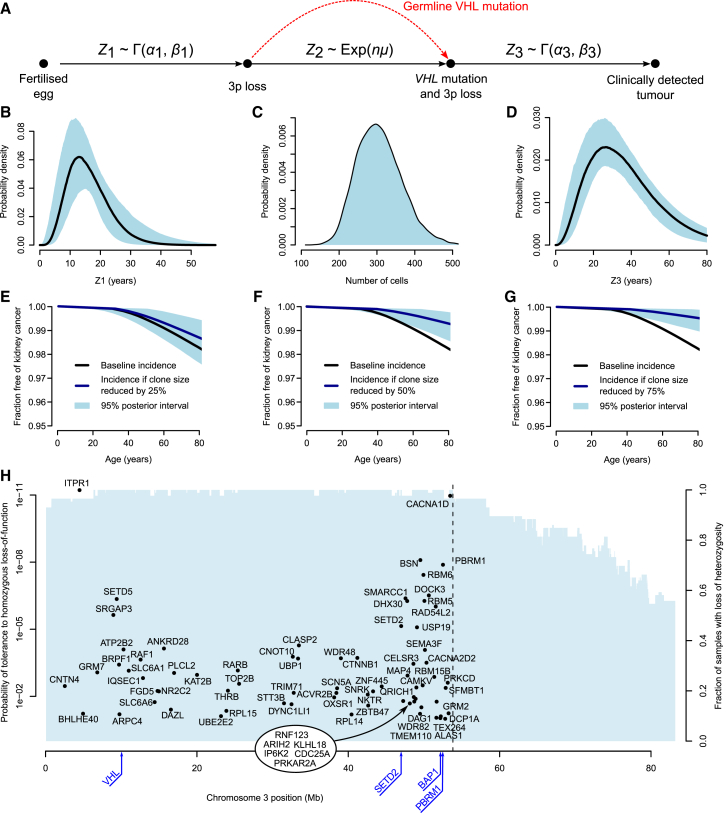
Clear cell renal cell carcinoma (ccRCC) is characterized by near-universal loss of the short arm of chromosome 3, deleting several tumor suppressor genes. We analyzed whole genomes from 95 biopsies across 33 patients with clear cell renal cell carcinoma. We find hotspots of point mutations in the 5' UTR of TERT, targeting a MYC-MAX-MAD1 repressor associated with telomere lengthening. The most common structural abnormality generates simultaneous 3p loss and 5q gain (36% patients), typically through chromothripsis. This event occurs in childhood or adolescence, generally as the initiating event that precedes emergence of the tumor's most recent common ancestor by years to decades. Similar genomic changes drive inherited ccRCC. Modeling differences in age incidence between inherited and sporadic cancers suggests that the number of cells with 3p loss capable of initiating sporadic tumors is no more than a few hundred. Early development of ccRCC follows well-defined evolutionary trajectories, offering opportunity for early intervention.

Keywords: cancer evolution; chromothripsis; clear cell renal cell carcinoma.


Figures

None
Graphical abstract
Figure 1
Figure 1
The Clonality of Driver Events and the Relative Timing of 3p Loss in Clear Cell Renal Cell Carcinoma (A) Mutation burden for 34 independent tumors derived from 33 patients. For each tumor, the number of mutations present in the most recent common ancestor and each of the terminal subclones are annotated. The estimated mutational time at which chromosome 3p is lost with 95% CIs has been annotated for those tumors harboring unbalanced translocations with 3p. One patient (K097) developed two independent tumors denoted K097_1 and K097_2. (B) Presence and clonality of driver mutations and copy number aberrations. Driver mutations include those previously reported and that are present in at least 3 independent tumors from this cohort. For cases where a clonal mutation in the WGS data has been detected as subclonal in the more spatially detailed panel data (Turajlic et al., 2018a, Turajlic et al., 2018b), the mutation has been amended in this figure as subclonal. See also Tables S1 and S2.
Figure 2
Figure 2
Recurrent Canonical and 5′ UTR TERT Mutations Increase Telomere Length (A) The genomic location of the canonical promoter and 5′ UTR mutations in this discovery cohort, a validation cohort (Table S5) and an inherited clear cell renal cell carcinoma cohort. (B) Estimated telomere lengths for all samples sequenced. The colored points correspond to samples that contained TERT mutations in some or all of the biopsies. The boxes indicate median and interquartile range. See also Tables S3 and S4.
Figure 3
Figure 3
Recurrent Complex Unbalanced Translocations between Chromosomes 3 and 5 (A) Intra and inter-chromosomal re-arrangements and their effect on the copy number profile from an indicative tumor sample. All tumor samples containing these events are shown in Figure S1. (B) The genomic location of all breakpoints from all tumors that harbored translocations between chromosomes 3 and 5. Regions that had undergone loss of heterozygosity are shown in blue; those that have undergone gains are shown in red. See also Figure S2 and Table S6.
Figure 4
Figure 4
Schematic Illustrating How Chromothripsis Generates a Derivative t(3;5) Chromosome (A) In one of the simpler clusters of rearrangements observed, breakpoints, and copy number (CN) aberrations on chromosomes 3 and 5 allow unequivocal reconstruction of the orientation and localization of regions retained after chromothripsis. The derivative chromosome contains chromosome 3q, a centromeric region of 3p, the chromothripsis fragments, and the telomeric portion of chromosome 5q. (B) Schematic showing one possible mechanism whereby chromothripsis may result in the unbalanced translocation between chromosomes 3 and 5.
Figure S1
Figure S1
Intra and Inter-chromosomal Rearrangements Affecting Chromosome 3, Related to Figure 3 Copy number is plotted as number of reads in a given genomic window, corrected for ploidy of the tumor and aberrant cell fraction. Somatic structural variants are shown as arcs joining the two sides of the breakpoint, colored by orientation of the two segments. Blue lines, deletion orientation; brown lines, tandem duplication orientation; blue-green lines, head-to-head inverted orientation; bright green lines, tail-to-tail inverted orientation.
Figure S2
Figure S2
Analysis of TCGA Data, Related to Figure 3 (A) The genomic location of all breakpoints from all tumors that harbored translocations between chromosomes 3 and 5. Regions with loss of heterozygosity are shown in blue; those with copy number gain in red. Positions of breakpoints are marked with black triangles. (B) Fold-change in expression of all genes on chromosome 5 for those tumors that had a gain of 5q compared to those with wild-type chromosome 5. Significantly differentially expressed genes (FDR < 0.05) are highlighted.
Figure 5
Figure 5
Mutational Burden and the Chronological Loss of Chromosome 3p (A) Mutational burden of subclones compared to age at surgery (points), annotated with the patient-specific and cohort average mutational rate (black line). (B) The estimated number of copies per cancer cell of each mutation in the duplicated region of 5q for an indicative sample. Mutations may be assigned as clonal and pre-duplication (green) or post-duplication (blue), subclonal and present (orange) or absent (purple) in this sample, or uncertain (black). (C) Estimated age of 3p loss (blue points), the most common recent ancestor (red) and surgical excision (black) with 95% CIs (shaded bars). See also Figures S3, S4, and S5 and Data S1.
Figure S3
Figure S3
The Average Number of Mutations by Mutational Context, Related to Figure 5 (A) Truncal mutations in sporadic tumors. (B) Non-truncal mutations in sporadic tumors. (C) Mutations in inherited ccRCCs in von Hippel-Lindau disease. Bars represent average number of mutations per tumor of the six different types (C > A, C > G, C > T, T > A, T > C, T > G) with each of the 16 different combinations of base before and after the mutated base.
Figure S4
Figure S4
Number of Copies of Each Mutation per Cancer Cell for Regions of Chromosome 5q Gain, Related to Figure 5 All patients with 5q gain in the setting of t(3;5) unbalanced translocations are shown. The estimated number of copies per cancer cell of each mutation in the duplicated region of 5q is plotted. Mutations may be assigned as clonal and pre-duplication (green) or post-duplication (blue); subclonal and present (orange) or absent (purple) in this sample; or uncertain (black).
Figure S5
Figure S5
Age at which Isolated Chromosome 5 Gains Occurred, Related to Figure 5 Shown are the estimated ages at which patients acquired a clonal 5q gain (blue), not occurring with 3p loss, relative to the age of diagnosis (black) and estimated age at which the most recent common ancestor (MRCA) emerged (red). Shading indicates 95% confidence intervals for the estimated age.
Figure 6
Figure 6
Similar Genomic Landscape of Inherited Clear Cell Renal Cell Carcinoma (A) Breakpoints and copy number aberrations for samples with von Hippel-Lindau disease that had translocations between 3p and 5q. (B) Driver events and molecular timing of 3p loss with 95% CIs. (C) Mutational burden versus age. (D) Estimated age of 3p loss and surgical excision with 95% CIs. See also Figures S6 and S7.
Figure S6
Figure S6
Intra- and Inter-chromosomal Rearrangements Affecting Chromosome 3 in the Inherited von Hippel-Lindau Disease Dataset, Related to Figure 6 Copy number is plotted as number of reads in a given genomic window, corrected for ploidy of the tumor and aberrant cell fraction. Somatic structural variants are shown as arcs joining the two sides of the breakpoint, colored by orientation of the two segments. Blue lines, deletion orientation; brown lines, tandem duplication orientation; blue-green lines, head-to-head inverted orientation; bright green lines, tail-to-tail inverted orientation.
Figure S7
Figure S7
Comparison of the Copy Number Landscape in Sporadic and Inherited (vHL) Datasets, Related to Figure 6
Figure 7
Figure 7
Mathematical Modeling of Clear Cell Renal Cell Carcinoma Evolution (A) Schematic depicting how the age of incidence of renal cell carcinoma may be modeled as the sum of waiting times; Z1 representing the time to 3p loss, Z2 representing the time to VHL inactivation, and Z3 representing the time from bi-allelic loss of VHL to clinically detected tumor. Z1 and Z3 are modeled by gamma distributions and Z2 by an exponential distribution of the product of n, the number of cells with 3p loss and μ, the calculated VHL mutational rate. (B–D) The posterior distribution of the waiting times for Z1 (B), the number of cells with 3p loss (C), and the waiting time for Z3 (D) with 95% posterior intervals. (E–G) The effect on age-incidence curves for sporadic kidney cancer with reduction of the 3p loss clone size by 25 (E), 50 (F), and 75% (G), with 95% posterior intervals shaded. (H) Location of genes with loss of function intolerance >90% (Lek et al., 2016) that lie within the region of ubiquitous loss in clear cell renal cell carcinoma. The locations of the canonical clear cell tumor suppressor genes are annotated in blue below the x axis.

Comment in

References

    1. Alexandrov L.B., Nik-Zainal S., Wedge D.C., Aparicio S.A., Behjati S., Biankin A.V., Bignell G.R., Bolli N., Borg A., Børresen-Dale A.L., Australian Pancreatic Cancer Genome Initiative. ICGC Breast Cancer Consortium. ICGC MMML-Seq Consortium. ICGC PedBrain Signatures of mutational processes in human cancer. Nature. 2013;500:415–421. - PMC - PubMed
    1. Alexandrov L.B., Jones P.H., Wedge D.C., Sale J.E., Campbell P.J., Nik-Zainal S., Stratton M.R. Clock-like mutational processes in human somatic cells. Nat. Genet. 2015;47:1402–1407. - PMC - PubMed
    1. Ali H., Daser A., Dear P., Wood H., Rabbitts P., Rabbitts T. Nonreciprocal chromosomal translocations in renal cancer involve multiple DSBs and NHEJ associated with breakpoint inversion but not necessarily with transcription. Genes Chromosomes Cancer. 2013;52:402–409. - PubMed
    1. Barthel F.P., Wei W., Tang M., Martinez-Ledesma E., Hu X., Amin S.B., Akdemir K.C., Seth S., Song X., Wang Q. Systematic analysis of telomere length and somatic alterations in 31 cancer types. Nat. Genet. 2017;49:349–357. - PMC - PubMed
    1. Beroukhim R., Mermel C.H., Porter D., Wei G., Raychaudhuri S., Donovan J., Barretina J., Boehm J.S., Dobson J., Urashima M. The landscape of somatic copy-number alteration across human cancers. Nature. 2010;463:899–905. - PMC - PubMed

Publication types

MeSH terms