. 2018 Apr 19;173(3):581-594.e12.
doi: 10.1016/j.cell.2018.03.057. Epub 2018 Apr 12.

Tracking Cancer Evolution Reveals Constrained Routes to Metastases: TRACERx Renal

Affiliations

Tracking Cancer Evolution Reveals Constrained Routes to Metastases: TRACERx Renal

Samra Turajlic et al. Cell. .

Abstract

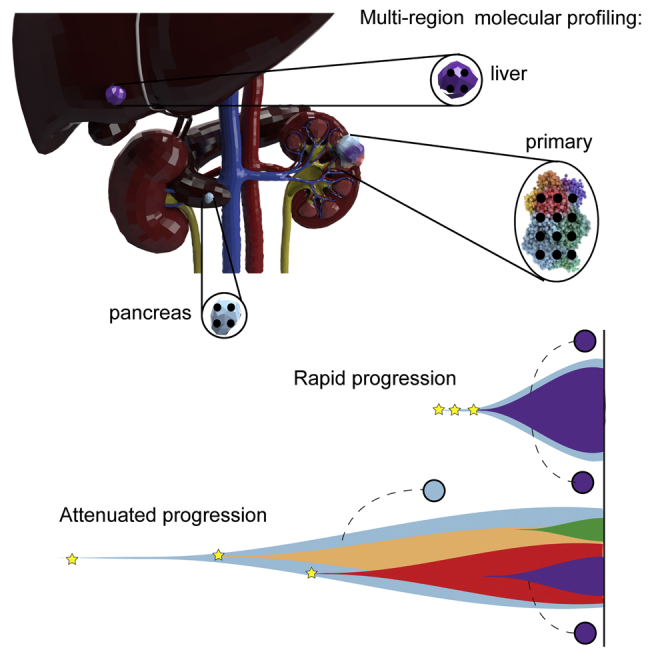
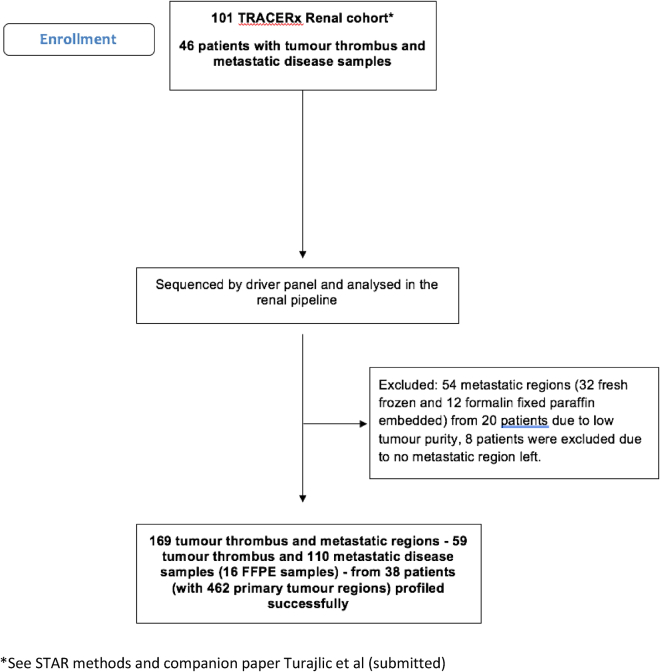
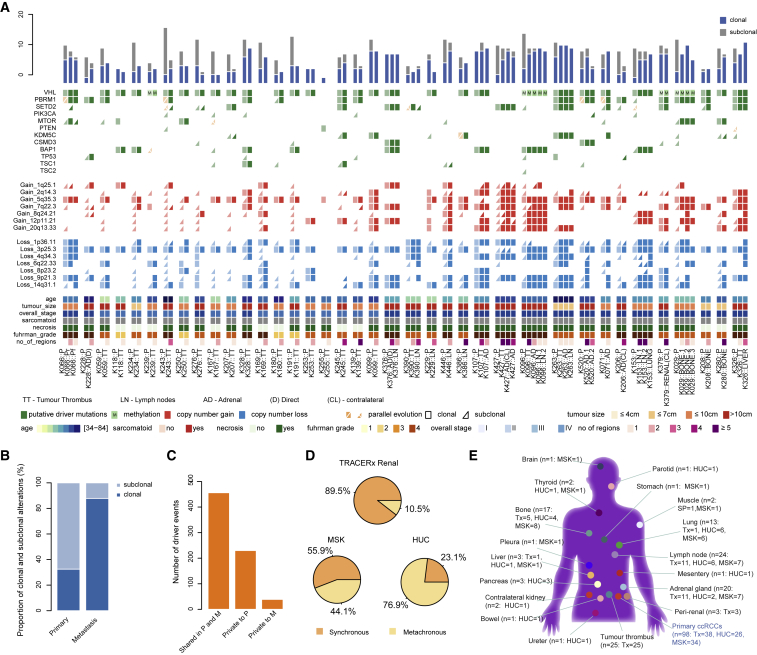
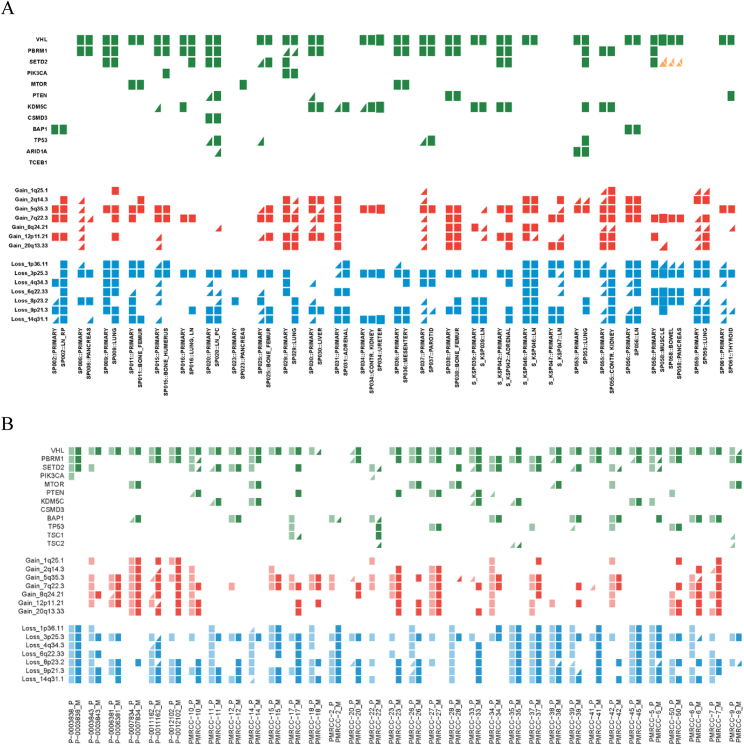
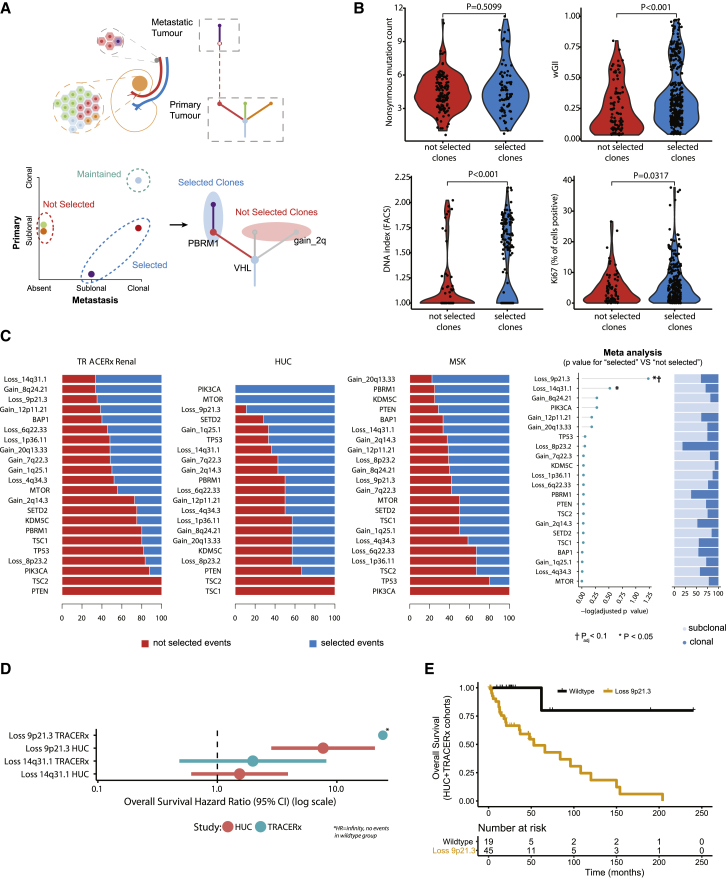
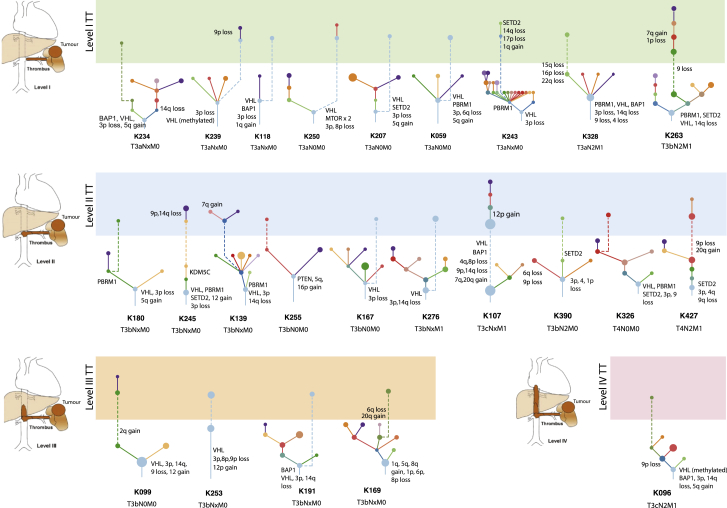
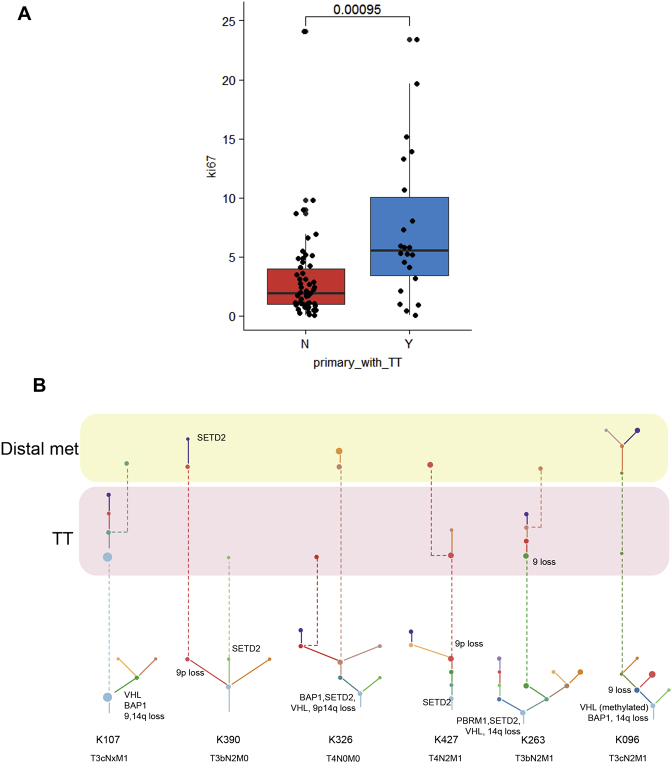
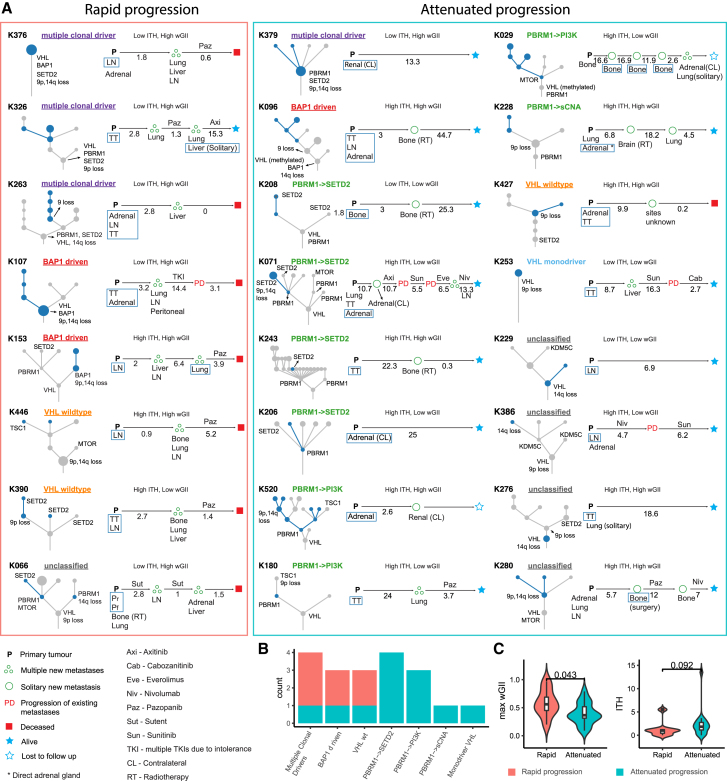
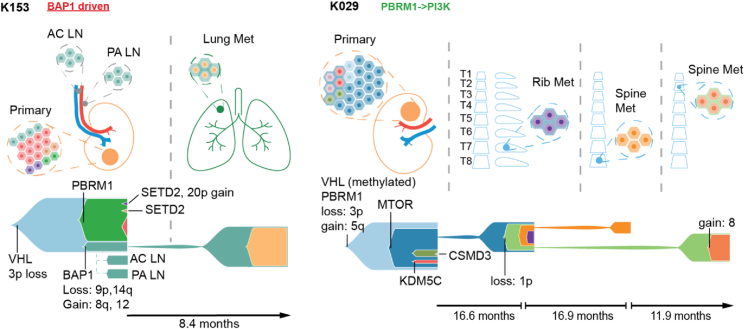
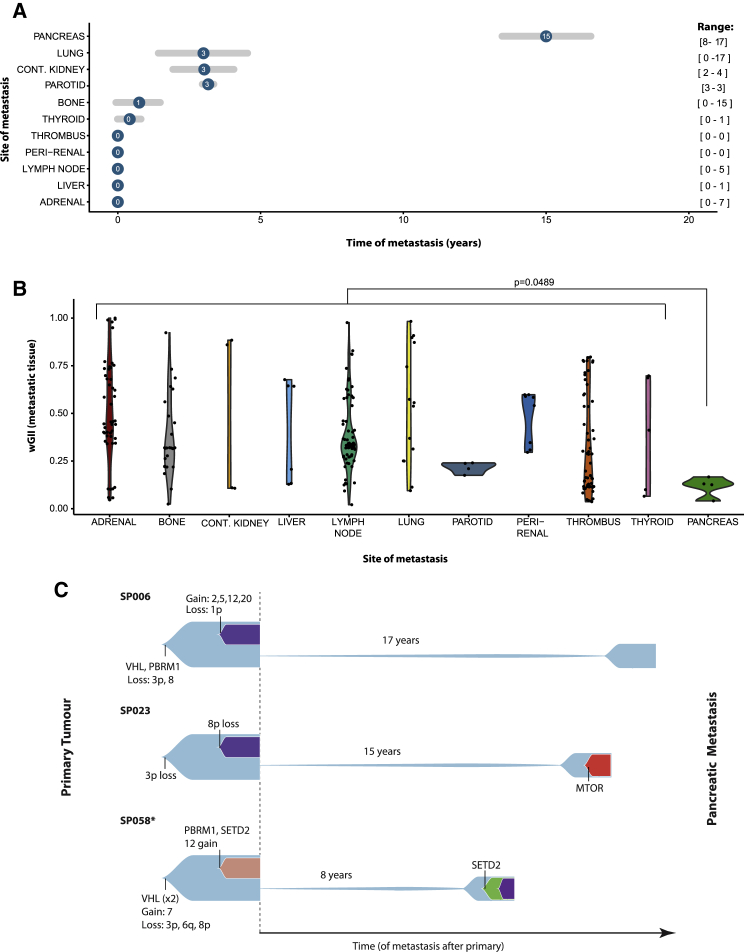
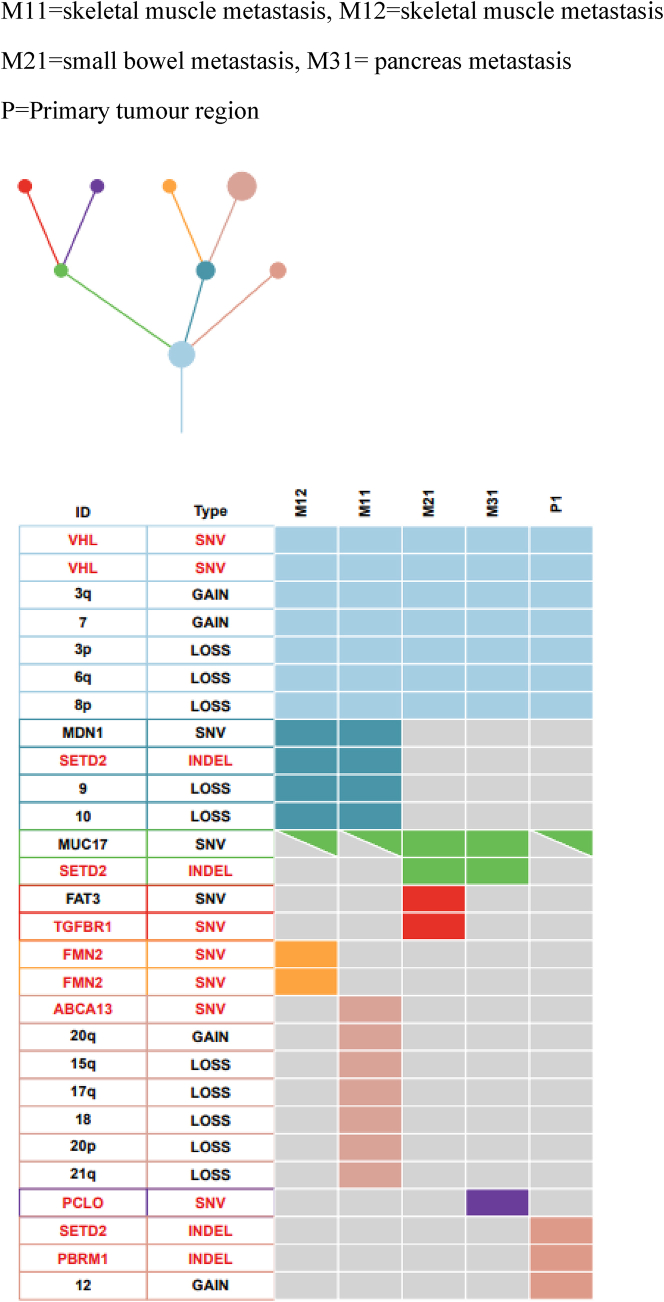
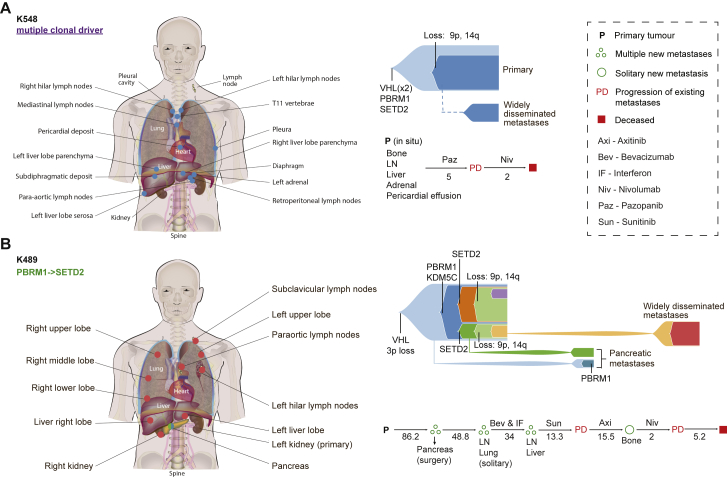
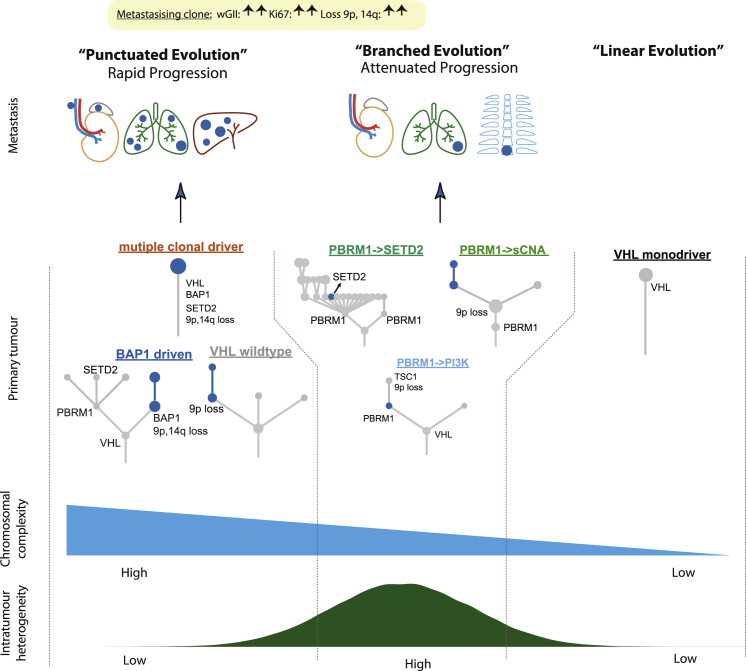
Clear-cell renal cell carcinoma (ccRCC) exhibits a broad range of metastatic phenotypes that have not been systematically studied to date. Here, we analyzed 575 primary and 335 metastatic biopsies across 100 patients with metastatic ccRCC, including two cases sampledat post-mortem. Metastatic competence was afforded by chromosome complexity, and we identify 9p loss as a highly selected event driving metastasis and ccRCC-related mortality (p = 0.0014). Distinct patterns of metastatic dissemination were observed, including rapid progression to multiple tissue sites seeded by primary tumors of monoclonal structure. By contrast, we observed attenuated progression in cases characterized by high primary tumor heterogeneity, with metastatic competence acquired gradually and initial progression to solitary metastasis. Finally, we observed early divergence of primitive ancestral clones and protracted latency of up to two decades as a feature of pancreatic metastases.

Trial registration: ClinicalTrials.gov NCT03226886 NCT03004755.

Keywords: chromosome instability; cytoreductive nephrectomy; evolution of metastasis; loss of 9p; metastasectomy; metastasis; oligometastasis; renal cell cancer; solitary metastasis.


Figures

None
Graphical abstract
Figure S1
Figure S1
The flow diagram illustrates the phases of selection of metastatic samples included in the TRACERx Renal Primary-Metastasis cohort
Figure 1
Figure 1
Overview (A) An overview of somatic alterations detected in matched primary and metastatic tumors across 38 TRACERx Renal patients. The top panel shows the proportion of clonal and subclonal alterations. In the middle panel alterations in primary tumors are indicated in a lighter shade and those detected in metastases in a darker shade. Clonal alterations are shown as rectangles and subclonal alterations as triangles. Parallel evolution is indicated in orange with a split indicating multiple events. Abbreviations for tumor sites: P, primary; TT, tumor thrombus; AD, adrenal gland, indirect metastasis; AD(D), direct invasion of adrenal gland; AD(CL), contralateral adrenal gland; Renal(CL), contralateral kidney; Pr, perirenal invasion; and Pf, peri-nephric fat and Gerota’s fascia invasion. (B) The number of clonal and subclonal somatic alterations in primary and metastatic tumors. (C) The number of somatic alterations (1) detected in both primary tumor (P) and the matched metastatic tumor (M), (2) detected in primary tumor but not the matched metastatic tumor, and (3) detected in the metastatic tumor but not the matched primary tumor. (D) The proportions of synchronous and metachronous metastatic tumors profiled in the TRACERx Renal, HUC, and MSK cohorts. (E) The range of the metastatic sites sampled across the TRACERx, HUC, and MSK cohorts. The total number of metastases sampled (n) and the number from each cohort are shown in brackets (Tx represents TRACERx Renal; HUC and MSK are extension cohorts). See also Tables S1 and S6 and Table S2.
Figure S2
Figure S2
Driver Events in HUC and MSK Cohorts, Related to Figure 1 (A and B) This figure shows driver mutations and driver SCNAs detected in matched primary and metastatic tumours in HUC (A) and MSK (B) cohorts. Clonal alterations are shown as rectangles and subclonal alterations as triangles. Parallel evolution is indicated in orange with a split indicating multiple events.
Figure 2
Figure 2
Characterization of a Metastasizing Clone(s) (A) Illustration of the method used to categorize tumor clones. (B) Four violin plots summarizing (starting at the top left and working clockwise): (1) non-synonymous mutation count, (2) wGII, (3) ploidy, and (4) Ki67. Values are compared between tumor clones “not selected” and “selected” in metastasis, with all region/clone values plotted per tumor (excluding MRCA “maintained” clones; see the STAR Methods). A linear mixed effects (LMEs) model was used to determine significance, to account for the non-independence of multiple observations from individual tumors. (C) For each driver event the proportion of times it was observed in “not selected” and “selected” clones for TRACERx, HUC, and MSK cohorts. The far-right panel shows the log10 p value for each event for enrichment in “selected” versus “not selected” clones. Testing was performed using a binomial test with meta-analysis conducted using Fisher’s method of combining p values from independent tests. p values are corrected for multiple testing using Benjamini-Hochberg procedure. (D) Overall survival hazard ratios for events with p < 0.05 in the analysis in (C). Data are shown for TRACERx and HUC cohorts separately, with the circle representing the hazard ratio value and the lines corresponding to the 95% confidence interval estimate. (E) Overall survival results for TRACERx and HUC cohorts (combined), split into two groups based on SCNA status at chr 9p21.3 (either copy-number loss at chr 9p21.3 or normal wild-type copy number) in the metastasizing clone. See also Figure S2 and Table S3.
Figure 3
Figure 3
Tumor Thrombus This figure shows tumor thrombus (TT) driver trees with primary clones in the lower panels and level I, level II, level III, and level IV TT clones in light green, blue, orange, and red, respectively, in the upper panels. Tumor TNM stage and driver events leading to TT are annotated. Length of branches connecting clones is not informative. See also Figure S3.
Figure S3
Figure S3
Analysis of Tumor Thrombus, Related to Figure 3 (A and B) (A) shows Ki67 proliferation index data (mean % of cells staining positive for Ki67 across all primary tumour regions) for cases presenting with and without TT. (B) shows cases with TT and distal metastases.
Figure 4
Figure 4
Evolution of Progressive Disease (A) Driver trees and the clinical course for cases with lymph node and distal metastases. Cases were grouped into those with “rapid progression” and “attenuated progression.” The primary tumor evolutionary subtype, primary tumor ITH/wGII classification, and select driver events on the tree (VHL, BAP1, PBRM1, MTOR, SETD2, TSC1, TSC2, chr 9p loss, and chr 14q loss) are annotated for each case. Metastasis seeding subclones and any subclones private to metastasis are highlighted in blue. Clinical course is shown from the time of nephrectomy to death or last follow-up. Pattern of disease progression is classified as multiple new metastases (multiple circles), solitary new metastasis (single circle), and progression of existing metastases (“PD”). Progression and follow-up times are shown in months. Systemic treatments are indicated. Synchronous and metachronous metastatic sites are listed under corresponding time points. Profiled metastases are highlighted in blue boxes. Abbreviation for tumor sites: P, primary; TT, tumor thrombus; AD, adrenal gland; AD(D), direct invasion of adrenal gland; AD(CL), contralateral adrenal gland; renal(CL), contralateral kidney; Pr, perirenal invasion; and Pf, peri-nephric fat and Gerota’s fascia invasion. (B) The number of cases with “rapid progression” or “attenuated progression” in each evolutionary subtype. (C) The maximum wGII and ITH in cases with “rapid progression” and “attenuated progression.” See also Figure S4 and Table S1.
Figure S4
Figure S4
Fishplot Summary of Selected Cases, Related to Figure 4 This figure shows 2 example cases with distal metastases. Diagrams of the primary tumour and the involved tissue sites are illustrated. Fishplots are used to show disease evolution. Driver events are annotated on each fishplot.
Figure 5
Figure 5
Latent Metastases (A) The distribution of times from nephrectomy to metastasis resection split by site of metastasis. The circle represents the median value, and the gray lines depict the median average deviation (MAD) value (i.e., plus/minus one MAD). The range (min to max) values are far right in brackets. (B) wGII values per region split by site of metastasis. All regions are shown per metastasis, and a linear mixed effects (LMEs) model was used to determine significance (for pancreas vs. all other), to account for the non-independence of multiple observations from individual tumors. (C) Fishplots for the three cases (SP006, SP023, and SP058) with latent pancreatic metastases. *Case SP058 had additional metastases to skeletal muscle (time = 0) and the small bowel (time = 7). See also Figure S5.
Figure S5
Figure S5
Shown is the driver mutation and SCNA phylogenetic tree and heatmap illustrating the clonal relationship between the primary and metastasis for case SP58
Figure 6
Figure 6
Spatial Resolution of Metastases through Post-Mortem Sampling (A and B) Shows cases K548 (A) and K489 (B), which were sampled at post-mortem with the extent of sampling. The clinical time course (in months) and therapuetic interventions are shown. Metastatic progression is illustrated using fish plots with the select driver events annotated (VHL, BAP1, PBRM1, MTOR, SETD2, TSC1, TSC2, 9p loss, and 14q loss). Metastasizing clone color matches that of the corresponding metastatic site. See also Table S1.
Figure 7
Figure 7
Summary of Key Conclusions from the Study

Comment in

References

    1. Adey N., Emery D., Bosh D., Callahan S., Schreiner J., Chen Y., Greig A., Geiersbach K., Parry R. A mill based instrument and software system for dissecting slide-mounted tissue that provides digital guidance and documentation. BMC Clin. Pathol. 2013;13:29. - PMC - PubMed
    1. Arai E., Sakamoto H., Ichikawa H., Totsuka H., Chiku S., Gotoh M., Mori T., Nakatani T., Ohnami S., Nakagawa T. Multilayer-omics analysis of renal cell carcinoma, including the whole exome, methylome and transcriptome. Int. J. Cancer. 2014;135:1330–1342. - PMC - PubMed
    1. Bashashati A., Ha G., Tone A., Ding J., Prentice L.M., Roth A., Rosner J., Shumansky K., Kalloger S., Senz J. Distinct evolutionary trajectories of primary high-grade serous ovarian cancers revealed through spatial mutational profiling. J. Pathol. 2013;231:21–34. - PMC - PubMed
    1. Becerra M.F., Reznik E., Redzematovic A., Tennenbaum D.M., Kashan M., Ghanaat M., Casuscelli J., Manley B., Jonsson P., DiNatale R.G. Comparative genomic profiling of matched primary and metastatic tumors in renal cell carcinoma. Eur. Urol. Focus. 2017 S2405-4569(17)30237-7. - PMC - PubMed
    1. Beroukhim R., Brunet J.P., Di Napoli A., Mertz K.D., Seeley A., Pires M.M., Linhart D., Worrell R.A., Moch H., Rubin M.A. Patterns of gene expression and copy-number alterations in von-hippel lindau disease-associated and sporadic clear cell carcinoma of the kidney. Cancer Res. 2009;69:4674–4681. - PMC - PubMed

Publication types

MeSH terms

Associated data