. 2018 May 7;45(3):347-361.e5.
doi: 10.1016/j.devcel.2018.03.013. Epub 2018 Apr 12.

Synaptotagmin 4 Regulates Pancreatic β Cell Maturation by Modulating the Ca2+ Sensitivity of Insulin Secretion Vesicles

Affiliations

Synaptotagmin 4 Regulates Pancreatic β Cell Maturation by Modulating the Ca2+ Sensitivity of Insulin Secretion Vesicles

Chen Huang et al. Dev Cell. .

Abstract

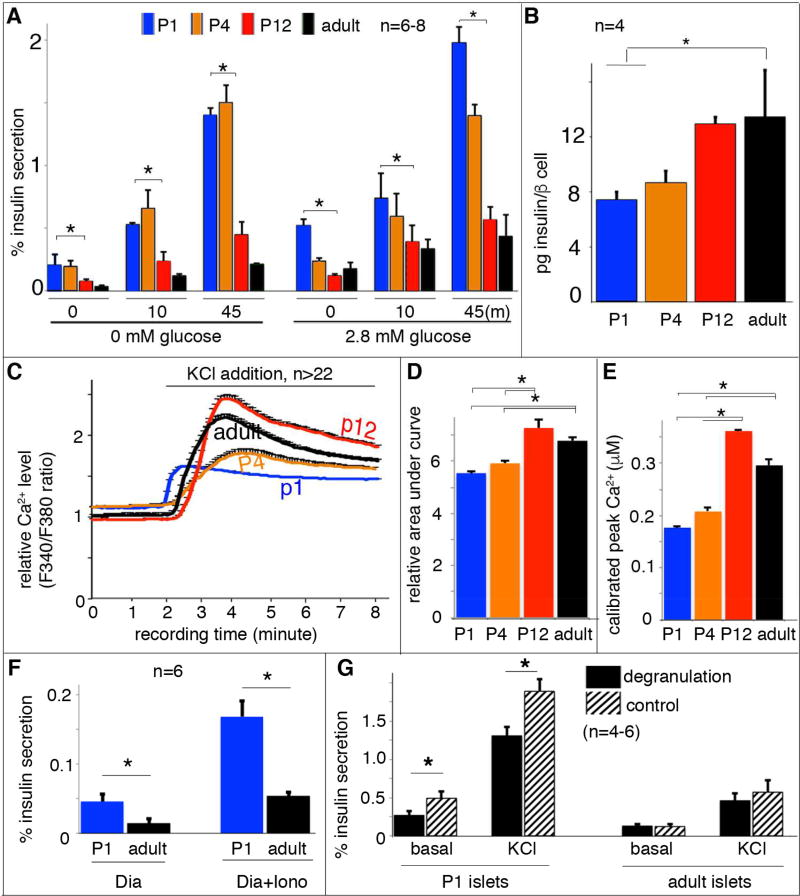
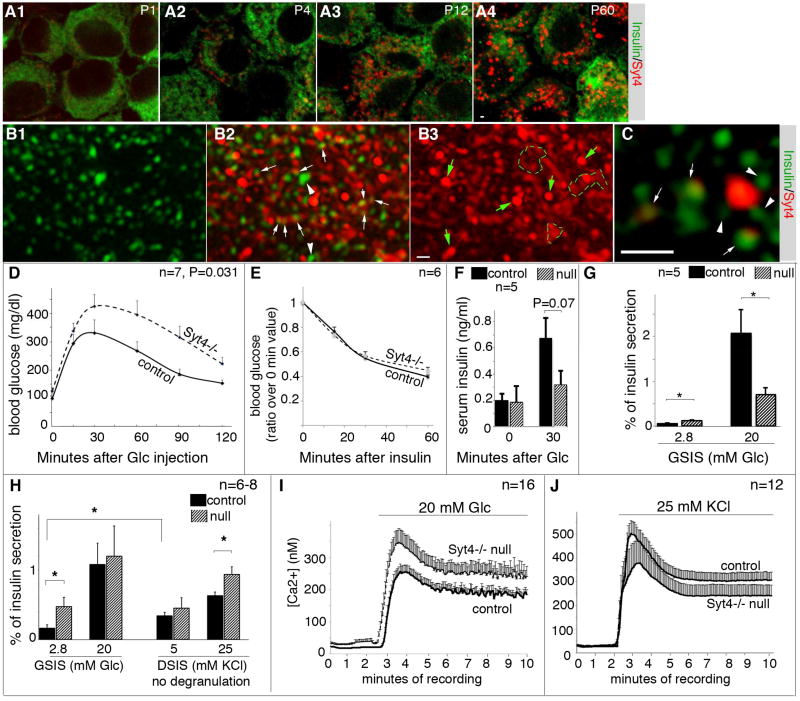
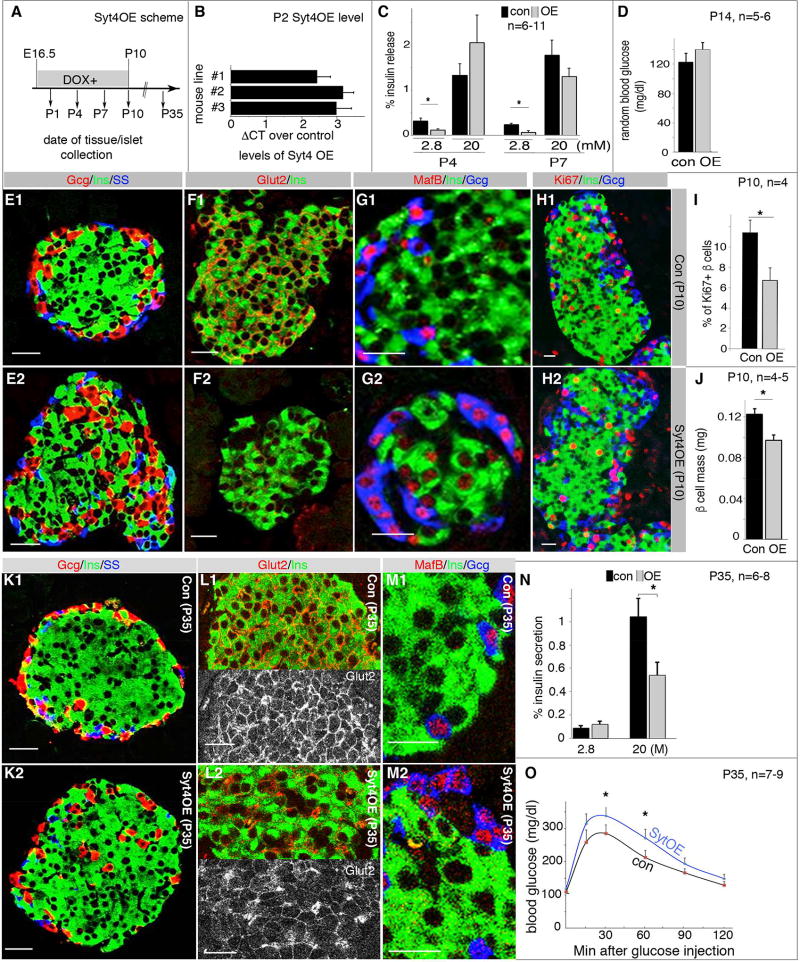
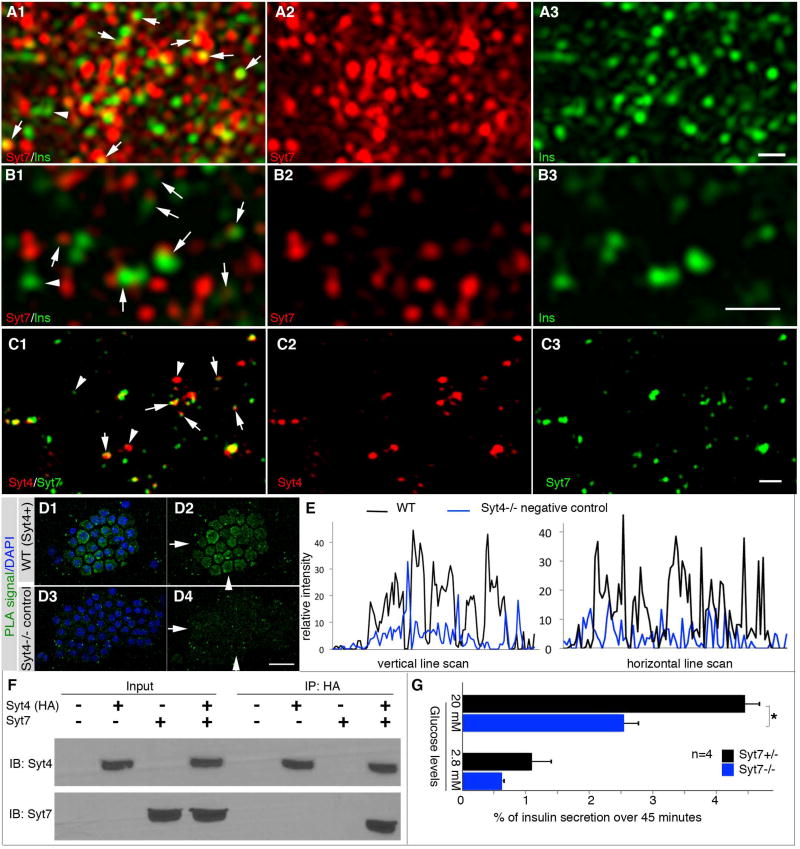
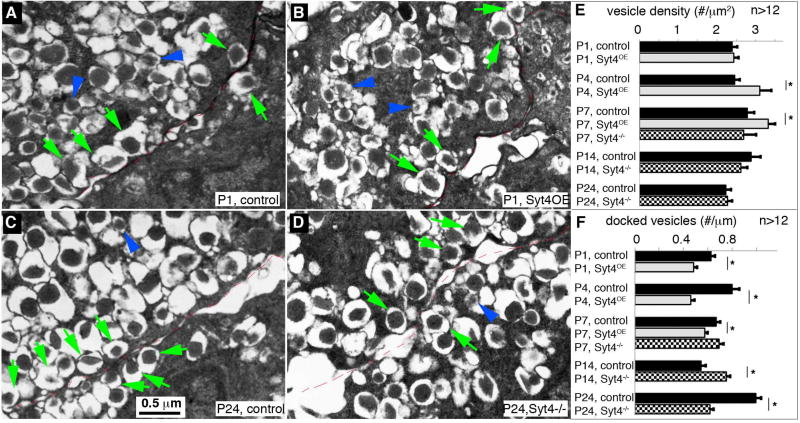
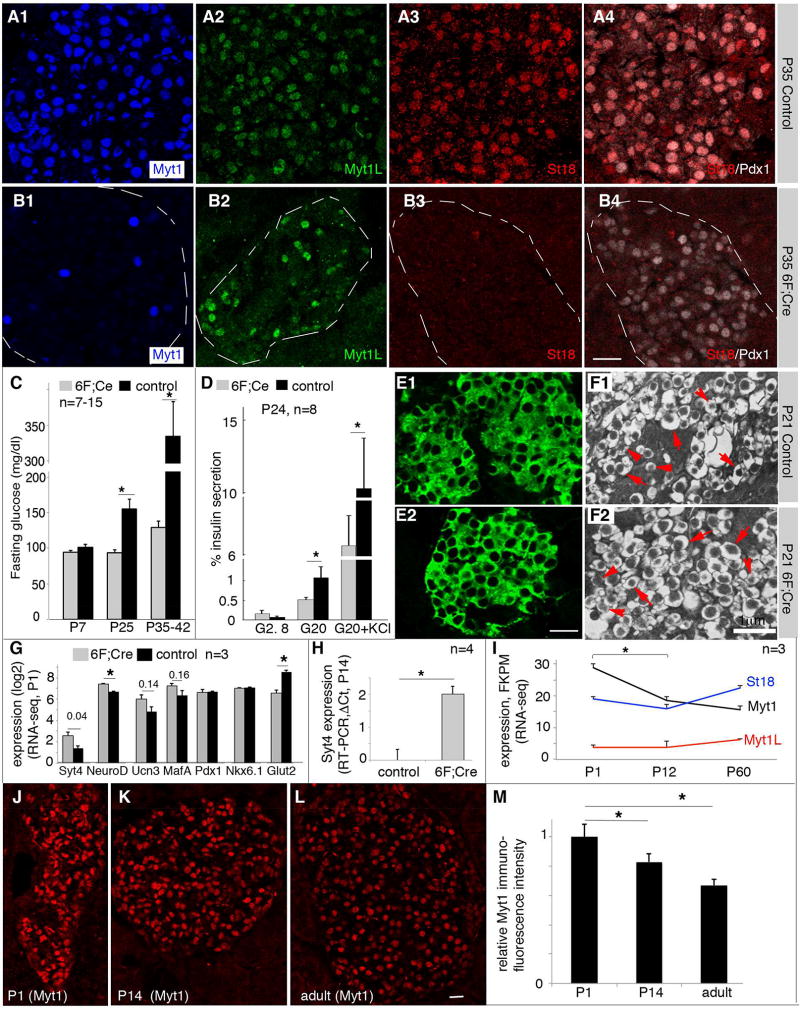
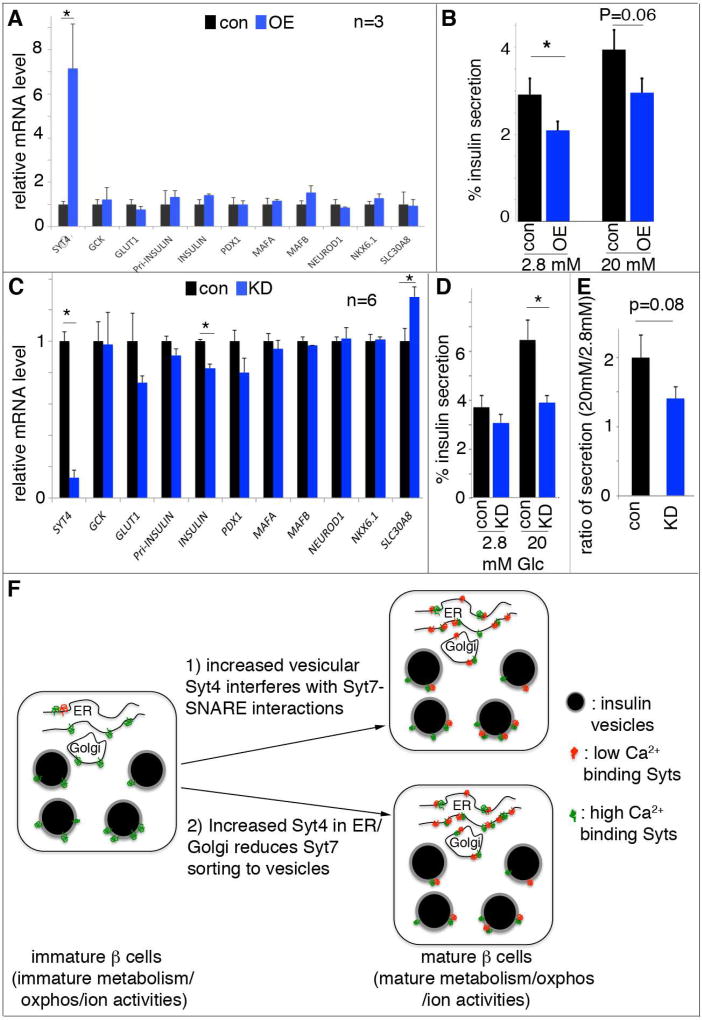
Islet β cells from newborn mammals exhibit high basal insulin secretion and poor glucose-stimulated insulin secretion (GSIS). Here we show that β cells of newborns secrete more insulin than adults in response to similar intracellular Ca2+ concentrations, suggesting differences in the Ca2+ sensitivity of insulin secretion. Synaptotagmin 4 (Syt4), a non-Ca2+ binding paralog of the β cell Ca2+ sensor Syt7, increased by ∼8-fold during β cell maturation. Syt4 ablation increased basal insulin secretion and compromised GSIS. Precocious Syt4 expression repressed basal insulin secretion but also impaired islet morphogenesis and GSIS. Syt4 was localized on insulin granules and Syt4 levels inversely related to the number of readily releasable vesicles. Thus, transcriptional regulation of Syt4 affects insulin secretion; Syt4 expression is regulated in part by Myt transcription factors, which repress Syt4 transcription. Finally, human SYT4 regulated GSIS in EndoC-βH1 cells, a human β cell line. These findings reveal the role that altered Ca2+ sensing plays in regulating β cell maturation.

Keywords: Ca(2+); Myt1; Syt4; diabetes; docking; insulin; maturation; membrane fusion; secretion; vesicle.


Figures

Figure 1
Figure 1. Equivalent Ca2+ influx results in more insulin secretion in immature β cells
Handpicked islets were used for secretion and Ca2+ assays. (A) The percentage of insulin secretion induced by 25 mM KCl in islets at 0 (left columns) or 2.8 mM (right columns) glucose. Data from three time points, before KCl stimulation (“0”), 10 minutes or 45 minutes (m) with KCl stimulation (“10” or “45”) were presented. The data at “0” minute represent insulin secretion within a 45 minutes time window without KCl stimulation. The indicated statistical analysis (top brackets) was calculated between P1 and P12 islets. (B) Insulin content per β cell, assayed with purified β cells of RipmCherry mice. (C) Average islet cytoplasmic Ca2+ responses to 25 mM KCl-induced depolarization in 2.8 mM basal glucose; these responses were assayed with Fura2AM. (D) Quantification of the KCl-induced islet Ca2+ response defined with area-under-curve after KCl addition (from 2–8 minute). (E) The greatest total Ca2+ levels reached in islets of different ages stimulated by 25mM KCl. (F) Insulin secretion induced by ionomycin (Iono) in P1 and adult islets. Diazoxide (Dia) was included in these assays. (G) Islet DSIS with or without glucose-induced degranulation, achieved by incubating islets in 5.6 mM glucose for one hour prior to DSIS. (*: P< 0.05. T-test).
Figure 2
Figure 2. Increased Syt4 expression is required for β-cell maturation
(A) LSM confocal images of Ins/Syt4 immunofluorescence in P1 to adult β cells. Single optical slices of merged images were shown, taken under identical confocal parameters. Note that isolated islets were partially dissociated and quickly attached onto slides with Cytospin methods, followed by fixation and staining. Under this condition, the islet vesicles appeared disrupted so that insulin immunofluorescence appeared as diffusive signals. (B) SIM images of Ins/Syt4 staining in a representative adult β cell. Shown are projections of 8 optical slices taken 125 nm apart, with insulin (B1), merged (B2), and Syt4 channel (B3) shown. Arrows and arrowheads in B2 showed examples of vesicles with or without co-localizing Syt4 signals. Green arrows and broken circles in B3 highlighted Syt4 patches devoid of Ins signals. (C) An enlarged single optical slice (~100 nm thickness) to highlight the co-localization of Ins and Syt4 in several vesicles (arrows). Arrowheads pointed to several vesicles that are close but not contacting the Syt4 signals. Scale bars=1 µm. (D) IPGTT in 8-week old control (WT) and Syt4 null mice. P value is calculated with Repeated Measure ANOVA. Glc, Glucose. (E) Insulin sensitivity assay in 8-week old mice after 4-hour fasting. Presented are the ratios of blood glucose levels over that before insulin injection. (F) Serum insulin levels detected during IPGTT test (8-week old mice). (G) GSIS of 8-week old Syt4−/− islets. (H) GSIS and DSIS of P14 islets. (I, J) P14 islet cytoplasmic Ca2+ induced by 20 mM glucose (I) or 25 mM KCl (J). *: P<0.05, T-test.
Figure 3
Figure 3. Syt4OE promotes β-cell maturation but impairs islet morphogenesis and GSIS
Control (“con”, including TetOSyt4 and RiprTTA mice) and Syt4OE littermates were used for all assays. Images were captured with identical parameters. (A) The time frame used for Dox administration and islet/mouse characterization. After intercrossing, Dox feeding started at E16.5 in plugged females and last to P10, or to the point of tissue collection before P10. (B) Real-time RT PCR showing Syt4 overexpression in isolated P2 islets of three independent mouse lines. (C) GSIS in P4 and P7 Syt4OE islets. Shown are the % of insulin secretion within a 45 minutes time window. (D) Random feeding blood glucose in control (con) and Syt4OE (OE) mice. (E–G) Immunoassays in P10 islets with/without Syt4OE, highlighting islet morphology (E), Glut2 (F), and MafB production (G). (H, I) β-cell proliferation assays and quantification with Ki67 labeling in P10 islets. (J) β-cell mass in P10 pancreata. (K–M) Gene expression in P35 islets in mice with/without transient Syt4OE between E16.5 to P10. Panels L1 and L2 were split, with a single Glut2 channel to highlight the change in Glut2 levels. (N, O) Islet GSIS and IPGTT assays in P35 control and Syt4OE mice. Scale bars=20 µm. *: P<0.05, T-tests.
Figure 4
Figure 4. Syt4 co-localizes with Syt7 in β cells
(A, B) SIM images showing the subcellular localization of Syt7 in a representative adult β cell. Panels A are projections of 8 optical slices taken 125 nm apart. Panel B are single SIM slices for better resolution of Ins/Syt7 localization. Note the large portions of vesicles with overlapping/close localization of Ins/Syt7 (arrows in A1, B1). Also note the vesicles without obvious contact with Syt7 (arrowheads). (C) Co-localization of Syt4 and Syt7 in β cells shown with SIM. Arrows, spots of Syt4-Syt7 co-localization. Arrowheads, spots of single Syt4 or Syt7 signal. The cell identity is confirmed by insulin expression, not included here. Bars=0.5 µm. (D) PLA assays verifying the close localization of Syt4 and Syt7, accepted as indication of direct association. Hand picked islets attached onto slides with cytospin method were used. Images were captured with LSM and Z-stack images were presented to show signals in the entire cell. Note that merged images (D1, D3) between DAPI and PLA signal and single PLA signal images (D2, D4) were shown. Syt4−/− islet cells (D3, D4) were included as negative controls. Arrows and arrowheads in D2 and D4 are the positions of line-scan to compare the relative PLA signal intensity presented in panel (E), in horizontal and vertical directions. Scale bar=20 µm. (F) Immunoprecipitation showing Syt4-Syt7 interactions. Lysates from HEK293 cells transfected with constructs that expressing HA-tagged Syt4 and Syt7 cytoplasmic domains were used. Proteins were immunoprecipitated by anti-HA, then immuno-blotted with anti-Syt7 antibodies. (G) GSIS of P4 Syt7−/− and control immature islets. *: P=0.02, T-tests.
Figure 5
Figure 5. Syt4 regulates insulin vesicle docking to the plasma membrane
(A–D) Representative TEM images of β cells with Syt4 overexpression or inactivation. (A, B) P1 control and Syt4OE β cells. (C, D) P24 control and Syt4−/− β cells. Green arrows point to several examples of docked mature vesicles. Blue arrowheads point to several immature vesicles, recognized by the low electron density of the insulin core. The cell-cell junctions were outlined with thin broken red lines. (E) Density of vesicles at different stage in islets of control, Syt4OE, or Syt4−/− null mouse β cells. (F) Quantification of docked vesicles in β cells. See Figure S5 for more images used for quantification. *: P<0.05
Figure 6
Figure 6. Myt factors repress Syt4 transcription
(A, B) Myt protein detection in P35 control (con, 6F in this case) and 6F; Cre mutant islets. Note that A4 and B4 showed examples of co-staining of St18 and Pdx1 of panels A3 and B3 to locate the islets, respectively. (C) Fasting glucose in 6F; Cre mutant mice. (D) Islet GSIS and DSIS of weaned mice (P24). (E) Immunofluorescence to show the relative insulin level in P21 control and 6F; Cre β cells. (F) TEM images of insulin secretory vesicles in P21 control and 6F; Cre β cells. Arrows, examples of mature insulin vesicles. Arrowheads, examples of immature vesicles. (G) RNA-seq data of several genes in P1 control and 6F; Cre β cells (n=3). The P-values (t-test) of several genes were marked on the top. (H) Real-time RT-PCR assays of Syt4 in hand-picked P14 islets in control and 6F; Cre islets (n=3). (I) Expression levels of Myt genes from purified β cells (via MipeGFP expression) at different postnatal stages via RNA-seq (n=3). (J–M) Immunofluorescence assays of Myt1 protein levels in β cells of different ages. Wild type (CD1) mice were used. For quantification in (M), ~200 cells were used from each stage.
Figure 7
Figure 7. SYT4 regulates human β-cell GSIS
Lentivirus was used to introduce human SYT4 overexpression, while siRNA were used for SYT4 knockdown. (A) Gene expression in EndoC-βH1 cells with SYT4OE (OE), normalized against empty virus-infected control (con) cells. (B) GSIS in EndoC-βH1 cells with SYT4OE. (C) Gene expression in EndoC-βH1 cells with SYT4KD (KD), normalized against cells treated with scrabbled siRNA (con). (D, E) Insulin secretion in EndoC-βH1 cells with SYT4KD, presented as the % of insulin secretion at different level of glucose (D), or as the ratio of insulin release at 20 mM over 2.8 mM glucose (E). *: P<0.05. (F) A model with two pathways that converge to regulate β-cell maturation: one aspect includes glucose metabolism/subsequent oxidative phosphorylation and membrane excitability, which ensure efficient glucose metabolism, ATP production, ionic activity, and Ca2+ entry. Another is the modulation of Ca2+ sensitivity of the vesicles. In this pathway, immature β cells have lower levels and mature β cells have higher levels of non-Ca2+ binding Syts. The Ca2+-binding Syts remain unchanged during maturation. The increased ratio between non-Ca2+ to Ca2+ binding Syts can desensitize the vesicles so that high secretion only occurs at high Ca2+ in the mature β cells. This desensitization can be achieved by 1) using Syt4 localized on vesicles to inhibit Syt7-SNARE interactions, 2) reducing Syt7 levels on vesicle surface, or both.

Comment in

References

    1. Aguayo-Mazzucato C, Zavacki AM, Marinelarena A, Hollister-Lock J, El Khattabi I, Marsili A, Weir GC, Sharma A, Larsen PR, Bonner-Weir S. Thyroid hormone promotes postnatal rat pancreatic beta-cell development and glucose-responsive insulin secretion through MAFA. Diabetes. 2013;62:1569–1580. - PMC - PubMed
    1. Ammala C, Ashcroft FM, Rorsman P. Calcium-independent potentiation of insulin release by cyclic AMP in single beta-cells. Nature. 1993;363:356–358. - PubMed
    1. Andersson SA, Olsson AH, Esguerra JL, Heimann E, Ladenvall C, Edlund A, Salehi A, Taneera J, Degerman E, Groop L, et al. Reduced insulin secretion correlates with decreased expression of exocytotic genes in pancreatic islets from patients with type 2 diabetes. Molecular and cellular endocrinology. 2012;364:36–45. - PubMed
    1. Arthur CP, Dean C, Pagratis M, Chapman ER, Stowell MH. Loss of synaptotagmin IV results in a reduction in synaptic vesicles and a distortion of the Golgi structure in cultured hippocampal neurons. Neuroscience. 2010;167:135–142. - PMC - PubMed
    1. Artner I, Hang Y, Mazur M, Yamamoto T, Guo M, Lindner J, Magnuson MA, Stein R. MafA and MafB regulate genes critical to beta-cells in a unique temporal manner. Diabetes. 2010;59:2530–2539. - PMC - PubMed

Publication types

MeSH terms