. 2018 May 1;27(5):1121-1137.e5.
doi: 10.1016/j.cmet.2018.03.005. Epub 2018 Apr 12.

Warming Induces Significant Reprogramming of Beige, but Not Brown, Adipocyte Cellular Identity

Affiliations

Warming Induces Significant Reprogramming of Beige, but Not Brown, Adipocyte Cellular Identity

Hyun Cheol Roh et al. Cell Metab. .

Abstract

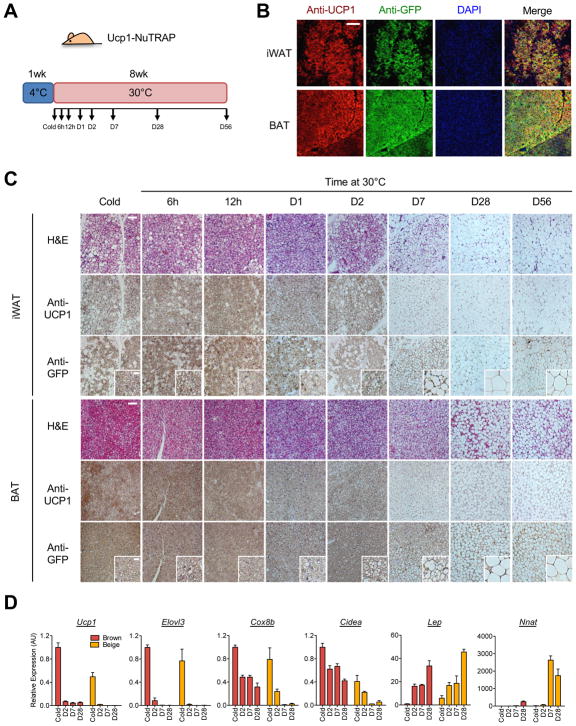
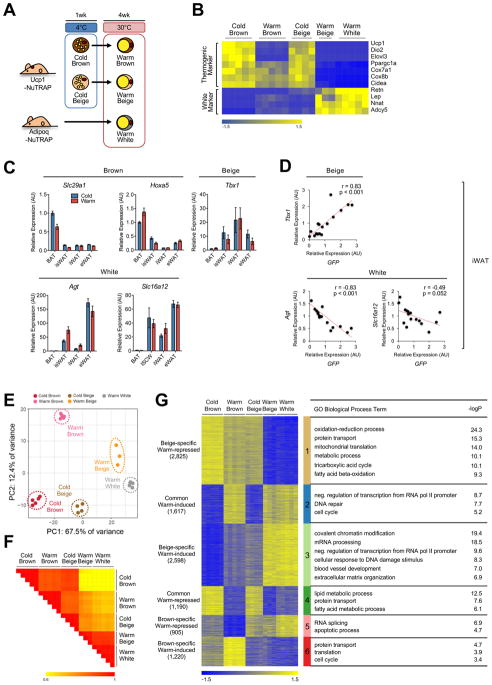
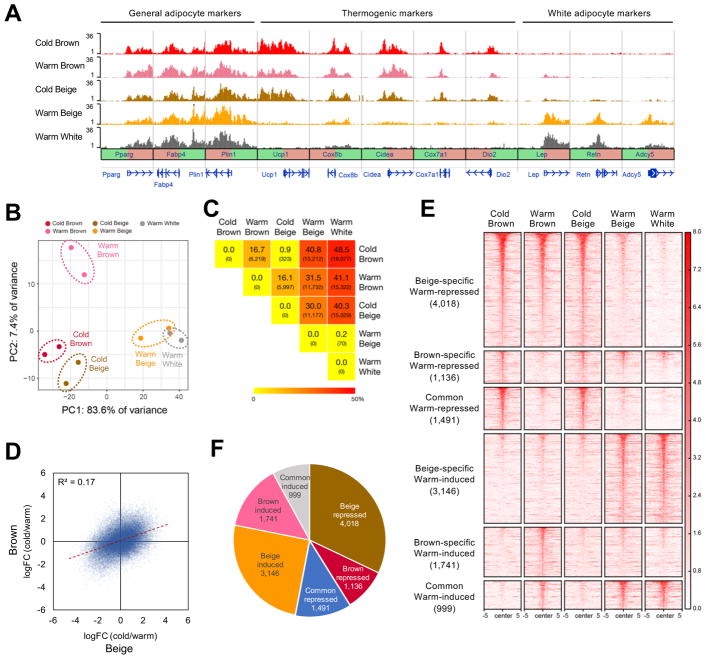
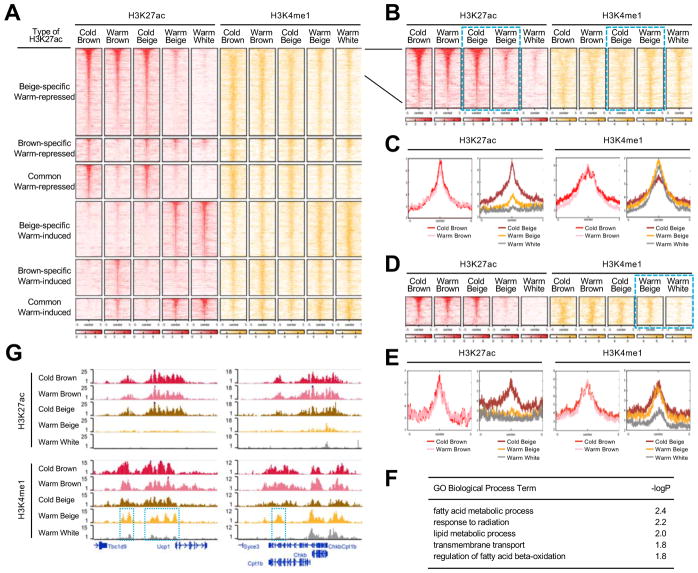
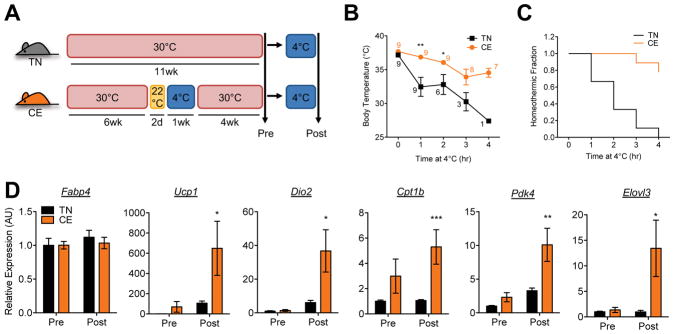
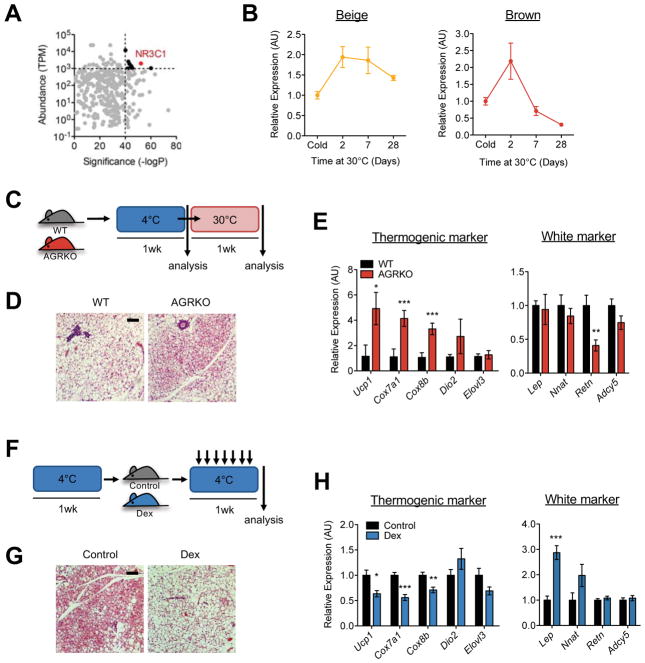
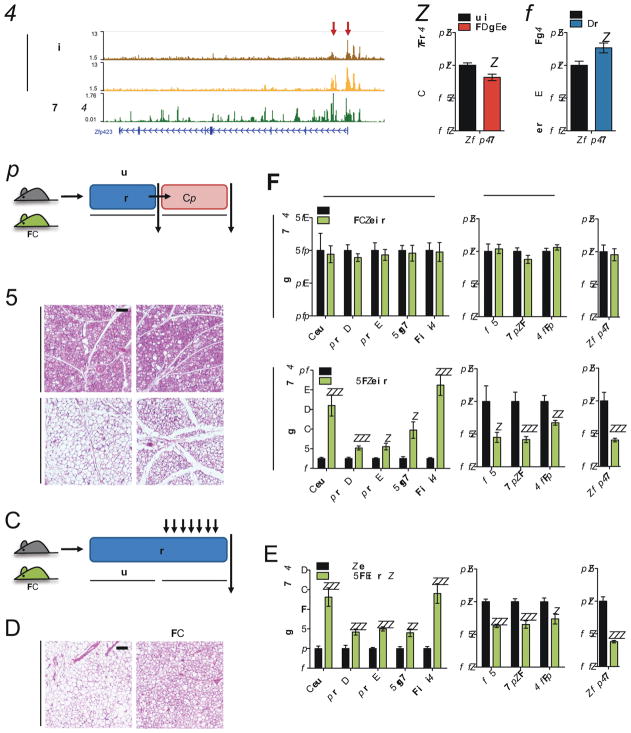
Beige and brown adipocytes generate heat in response to reductions in ambient temperature. When warmed, both beige and brown adipocytes exhibit morphological "whitening," but it is unknown whether or to what extent this represents a true shift in cellular identity. Using cell-type-specific profiling in vivo, we uncover a unique paradigm of temperature-dependent epigenomic plasticity of beige, but not brown, adipocytes, with conversion from a brown to a white chromatin state. Despite this profound shift in cellular identity, warm whitened beige adipocytes retain an epigenomic memory of prior cold exposure defined by an array of poised enhancers that prime thermogenic genes for rapid response during a second bout of cold exposure. We further show that a transcriptional cascade involving glucocorticoid receptor and Zfp423 can drive warm-induced whitening of beige adipocytes. These studies identify the epigenomic and transcriptional bases of an extraordinary example of cellular plasticity in response to environmental signals.

Keywords: Zfp423; adipocyte; beige; brown; epigenome; epigenomic memory; glucocorticoid receptor; reprogramming; transcriptome; white.


Conflict of interest statement

DECLARATION OF INTERESTS

These authors have no competing interests to declare.

Figures

Figure 1
Figure 1. Brown and beige adipocytes undergo morphologically whitening during warming
(a) Ucp1-NuTRAP mice were exposed to 4°C for 1 week, subsequently incubated at 30°C for 8wk and studied at the indicated time points during warming. (b) Whole mount immunofluorescence staining of iWAT and BAT of Ucp1-NuTRAP mice exposed to 4°C for 1wk. UCP1-positive brown and beige adipocytes are labeled by GFP. Scale bar: 100μm. (c) Immunohistochemistry of BAT and iWAT from Ucp1-NuTRAP mice at the indicated time points during warming. H&E, anti-UCP1 and anti-GFP stained images are shown. Insets show higher magnification of GFP-labeled beige/brown adipocyte morphology. Scale bar: 50μm and 10μm (insets). (d) Gene expression analysis by qRT-PCR with TRAP-isolated RNA from BAT and iWAT of Ucp1-NuTRAP mice at the indicated time points during warming. Bars indicate mean ± SEM (n=3 animals/group). See also Figure S1.
Figure 2
Figure 2. Beige and brown adipocytes exhibit distinct transcriptomic changes upon warming
(a) Experimental scheme showing how different types of adipocytes are collected. Brown and beige adipocytes (cold/warm) were collected from BAT and iWAT of Ucp1-NuTRAP mice, respectively, exposed to cold and after 4 weeks of warming at 30°C. White adipocytes were collected from iWAT of Adipo-NuTRAP mice housed at thermoneutrality from birth. (b) Heatmap of marker gene expression for different adipocyte types from cold and warm conditions as described in (a). Columns represent biological replicates. Expression values (Counts Per Million; CPM) of each mRNA are represented by z-scores. (c) Gene expression analysis by qRT-PCR of proposed brown, beige and white adipocyte markers in different fat depots (whole tissues) in response to cold (4°C, 1 week) and subsequent warming (30°C, 4 weeks). Bars indicate mean ± SEM (n=6 animals/group). BAT, interscapular brown adipose tissue; isWAT, interscapular white adipose tissue; iWAT, inguinal white adipose tissue; eWAT, epididymal white adipose tissue. (d) Correlation analysis between expression of beige/white adipocyte markers and GFP within iWAT. Each dot indicates an individual sample. (e) PCA of transcriptome of adipocyte types in cold and warm conditions. Each dot indicates an individual biological replicate (n=3–5 animals/replicate). (f) Similarity matrix showing pairwise Pearson correlations for RNA-seq profiles. Pearson correlation coefficient r is represented in color as indicated. (g) Heatmap of K-mean (K=6) clustering of transcriptomic profiles for differential genes. The number of genes in each cluster is in parentheses; each cluster is indicated by a different vertical color bar. Pathways (GO biological process) enriched in each cluster and their corresponding −log10 p-values are shown in the table at right. See also Figure S2 and Table S1.
Figure 3
Figure 3. Temperature-sensitive plasticity of beige adipocyte chromatin
(a) H3K27ac ChIP-seq data centered on the TSS (±5kb) of general adipocyte, thermogenic, and white adipocyte marker genes. (b) PCA of H3K27ac peaks from different adipocyte types in cold and warm conditions. Each dot indicates an individual biological replicate (a pool of 3–6 animals) analyzed in two independent experiments. (c) Heatmap of pairwise comparisons for the number of differentially-regulated H3K27ac peaks. Values indicate the percentage and number (in parentheses) of differentially-regulated peaks in each comparison. Total number of H3K27ac peaks is 37,254. (d) Scatter plot showing correlation of the changes of all individual H3K27ac peak signals upon warming between brown and beige adipocytes. The red dashed line is the trend line. (e) Heatmap showing H3K27ac peaks (rows) across samples (columns). Peaks are classified into 6 clusters based on their patterns as labeled. Amplitude of each peak center (±5kb) is represented in color as indicated. (f) Pie chart showing the number of H3K27ac peaks in each cluster. The number of H3K27ac peaks in each cluster is indicated. See also Figures S3 and S4.
Figure 4
Figure 4. Beige adipocytes retain an epigenomic memory of cold exposure
(a) Heatmap showing H3K27ac and H3K4me1 peaks, clustered as indicated. Each row represents an individual H3K27ac peak (red) and the co-localized H3K4me1 signal (orange) across different adipocyte types in cold and warm conditions. (b) Heatmap of enhancers in beige adipocytes that display reduced H3K27ac signal but increased or constant H3K4me1 signal after warming (highlighted in dotted blue boxes). (c) Distribution plots of poised enhancers in (b). H3K27ac and H3K4me1 are shown on the left and right, respectively. Brown adipocyte samples are shown separately from beige and white adipocytes. (d) Heatmap of poised enhancers in beige adipocytes that are stronger in warm beige than warm white adipocytes. (e) Distribution plots of poised peaks in (d). (f) GO biological pathway analysis of genes associated with peaks in (d). (g) H3K27ac and H3K4me1 signals at the Ucp1 (left) and Cpt1b (right) loci in different adipocyte types in cold and warm conditions. Warm beige adipocytes have H3K4me1 peaks that are higher than in white adipocytes (highlighted in dotted blue boxes). See also Figure S5.
Figure 5
Figure 5. Poised enhancers prime thermogenic gene expression after repeat cold exposure
(a) Experimental scheme. Wild-type mice were either housed at thermoneutrality for 11 weeks (TN) or were exposed to cold for 1 week after a 2-day transition period at RT (22°C), and then moved back to thermoneutrality for 4 weeks (CE). Both groups were then subjected to a short period of cold exposure as indicated in (b) and (c). (b) Core body temperature during cold exposure. Animals with temperature below 30°C were removed to room temperature and excluded from further study. Numbers indicate the number of animals analyzed at the time points. Dots indicate mean ± SEM (n=9 animals/group) (*p<0.05; **p<0.01). (c) Fraction of animals maintaining body temperature above 30°C during cold exposure at 4°C (n=9 animals/group). (d) Gene expression analysis by qRT-PCR. iWAT from TN and CE groups were assessed pre- and post-cold exposure (1h) at 4°C. Bars indicate mean ± SEM (n=4–7 animals/group) (*p<0.05; **p<0.01; ***p<0.005). Fabp4 is included as a general adipocyte marker.
Figure 6
Figure 6. The glucocorticoid receptor mediates beige adipocyte whitening
(a) Motif enrichment analysis showing significance (−log10 p-value) of motifs plotted against the abundance (Transcripts Per Kilobase Million; TPM) of the corresponding transcription factor. Motifs that meet both significance and abundance cutoffs are shown in black. NR3C1 is highlighted in red. (b) Hsd11b1 expression analyzed by qRT-PCR with TRAP-isolated RNA from BAT and iWAT of Ucp1-NuTRAP mice at the indicated different time points during warming after cold exposure. (c) Experimental scheme of AGRKO experiment. WT (floxed) and AGRKO mice were exposed to cold (4°C) for 1 week and then moved to thermone utrality (30°C) for 1 week. Both groups are analyzed after cold exposure and after warming. (d) H&E stained sections of iWAT from WT and AGRKO mice after warming. Scale bar: 20μm. (e) Expression of thermogenic and white adipocyte genes in iWAT of WT and AGRKO mice after warming. Bars indicate mean ± SEM (n=6–7 animals/group) (*p<0.05; **p<0.01; ***p<0.005). (f) Experimental scheme of Dex injection experiment. WT mice exposed to cold (4°C) for 1 week are divided into two groups; one injected daily with Dex (10mg/kg) for 1 week and the other injected with saline control; both groups were maintained at 4°C. (g) H&E stained sections of iWAT from saline and Dex-injected mice. Scale bar: 20μm. (h) Gene expression analysis of iWAT from saline and Dex-injected mice. Bars indicate mean ± SEM (n=5 animals/group) (*p<0.05; **p<0.01; ***p<0.005). See also Figure S6.
Figure 7
Figure 7. Zfp423, a downstream target of GR, mediates beige adipocyte whitening
(a) H3K27ac and GR ChIP-seq peaks at the Zfp423 locus. Warm-induced H3K27ac peaks in beige adipocytes that overlap with GR binding sites are indicated by red arrows. GR ChIP-seq data is from Soccio et al. (2015). (b) Zfp423 expression analyzed by qRT-PCR in iWAT of WT and AGRKO mice after warming. Bars indicate mean ± SEM (n=6–7 animals/group) (*p<0.05). (c) Zfp423 expression analyzed by qRT-PCR in iWAT of cold-exposed control and Dex-injected mice. Bars indicate mean ± SEM (n=5 animals/group) (*p<0.05). (d) Experimental scheme. WT (Adioponectin-rtTA; Zfp423 floxed) and Zfp423-iAKO (Adioponectin-rtTA; TRE-Cre; Zfp423 floxed) mice are exposed to cold at 6°C for 1 week and then maintained at thermoneutrality (30°C) for 1 week with Dox treatment (to induce loss of Zfp423). Both groups were studied before and after warming/Dox. (e) H&E stained sections of iWAT from WT and Zfp423-iAKO mice before and after warming/Dox. Scale bar: 20μm. (f) Expression of thermogenic and white adipocyte markers in iWAT of WT and Zfp423-iAKO mice before and after warming/Dox. Bars indicate mean ± SEM (n=5–6 animals/group) (*p<0.05; **p<0.01; ***p<0.005). (g) Experimental scheme. WT and Zfp423-iAKO mice were exposed to cold at 6°C for 1 week and then injected daily with Dex (10mg/kg) for 1 week with Dox treatment. Both groups were maintained at 4°C. (h) H&E stained sections of iWAT from WT and Zfp423-iAKO mice after Dex/Dox treatment. Scale bar: 20μm. (i) Expression of thermogenic and white adipocyte markers in iWAT of WT and Zfp423-iAKO mice after Dex/Dox treatment. Bars indicate mean ± SEM (n=5 animals/group) (*p<0.05; **p<0.01; ***p<0.005). See also Figure S7.

References

    1. Altshuler-Keylin S, Shinoda K, Hasegawa Y, Ikeda K, Hong H, Kang Q, Yang Y, Perera RM, Debnath J, Kajimura S. Beige Adipocyte Maintenance Is Regulated by Autophagy-Induced Mitochondrial Clearance. Cell Metab. 2016;24:402–419. - PMC - PubMed
    1. Berry DC, Jiang Y, Graff JM. Mouse strains to study cold-inducible beige progenitors and beige adipocyte formation and function. Nat Commun. 2016;7:10184. - PMC - PubMed
    1. Bose SK, Hutson I, Harris CA. Hepatic Glucocorticoid Receptor Plays a Greater Role Than Adipose GR in Metabolic Syndrome Despite Renal Compensation. Endocrinology. 2016;157:4943–4960. - PMC - PubMed
    1. Calo E, Wysocka J. Modification of enhancer chromatin: what, how, and why? Mol Cell. 2013;49:825–837. - PMC - PubMed
    1. Chapman K, Holmes M, Seckl J. 11beta-hydroxysteroid dehydrogenases: intracellular gate-keepers of tissue glucocorticoid action. Physiol Rev. 2013;93:1139–1206. - PMC - PubMed

MeSH terms