. 2018 May 8;10(5):1579-1595.
doi: 10.1016/j.stemcr.2018.03.013. Epub 2018 Apr 12.

Single-Cell Transcriptomic Profiling of Pluripotent Stem Cell-Derived SCGB3A2+ Airway Epithelium

Affiliations

Single-Cell Transcriptomic Profiling of Pluripotent Stem Cell-Derived SCGB3A2+ Airway Epithelium

Katherine B McCauley et al. Stem Cell Reports. .

Abstract

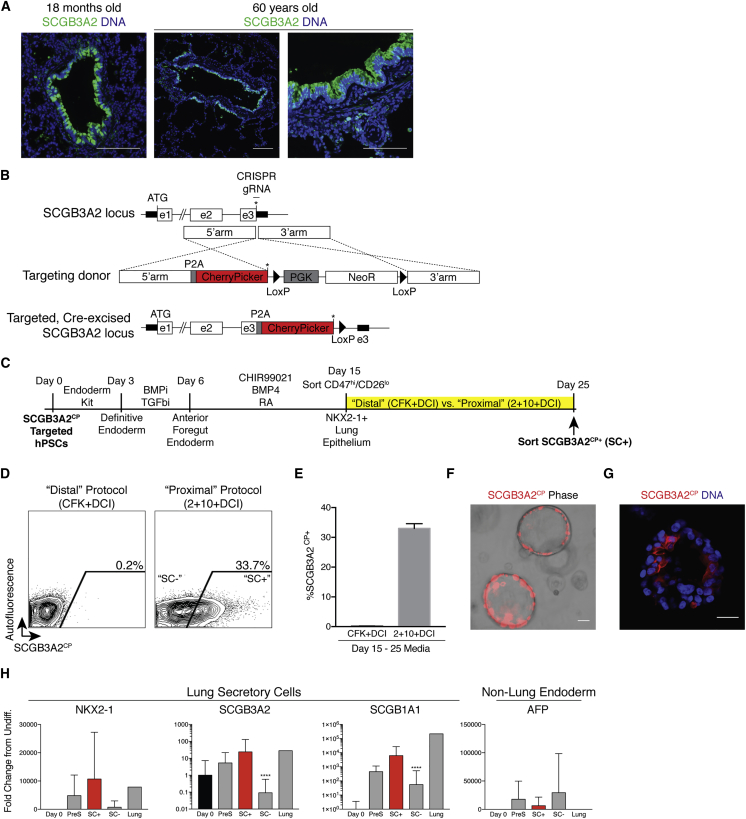
Lung epithelial lineages have been difficult to maintain in pure form in vitro, and lineage-specific reporters have proven invaluable for monitoring their emergence from cultured pluripotent stem cells (PSCs). However, reporter constructs for tracking proximal airway lineages generated from PSCs have not been previously available, limiting the characterization of these cells. Here, we engineer mouse and human PSC lines carrying airway secretory lineage reporters that facilitate the tracking, purification, and profiling of this lung subtype. Through bulk and single-cell-based global transcriptomic profiling, we find PSC-derived airway secretory cells are susceptible to phenotypic plasticity exemplified by the tendency to co-express both a proximal airway secretory program as well as an alveolar type 2 cell program, which can be minimized by inhibiting endogenous Wnt signaling. Our results provide global profiles of engineered lung cell fates, a guide for improving their directed differentiation, and a human model of the developing airway.

Keywords: airway; alveoli; directed differentiation; lung epithelium; pluripotent stem cells; single-cell RNA sequencing.


Figures

None
Graphical abstract
Figure 1
Figure 1
Generation and Directed Differentiation of Nkx2-1GFP;Scgb1a1tdTomatoTrace (Tr) Mouse and iPSC Lines (A) Schematic of targeted alleles. (B) Nkx2-1GFP;Scgb1a1tdTomatoTr adult mouse lung post-tamoxifen exposure. The arrowheads indicate an Scgb1a1tdTomatoTr-labeled cell in the alveolar compartment. Scale bars, 50 μm. (C) Immunofluorescence stains of Nkx2-1GFP;Scgb1a1tdTomatoTr adult mouse lungs for SCGB1A1, GFP, tdTomato, or NKX2-1 proteins. The arrowheads indicate SCGB1A1− cells. Scale bars, 50 μm. (D) Schematic of directed differentiation of miPSCs to lung lineages. DE, definitive endoderm; AFE, anterior foregut endoderm. (E) Nkx2-1GFP;Scgb1a1tdTomatoTr miPSC-derived sphere at day 28 of differentiation to airway epithelium. Scale bar, 50 μm. (F) Flow cytometry and quantification of Nkx2-1GFP;Scgb1a1tdTomatoTr expression on day 33 of differentiation. (G) qRT-PCR of fold change of gene expression compared with day 0 miPSCs (2−ΔΔCt) in day 33 cells sorted for expression of Nkx2-1GFP and Scgb1a1tdTomatoTr. Bars represent mean ± SD (n = 3 replicates separated at day 5 of differentiation). (H and I) Representative immunofluorescence of embedded spheres for (H) anti-SFTPC (green) and DNA (Hoechst, blue) and (I) anti-SCGB1A1 (green), tdTomato (red), and DNA (Hoechst, blue). The arrowheads in (I) indicate a tdTomato+ SCGB1A1− cluster. Scale bars, 25 μm. See also Figure S1.
Figure 2
Figure 2
Generation and Characterization of hPSC SCGB3A2CherryPicker Reporter Line (A) Human distal lung sections from 18-month- and 60-year-old donors, respectively, stained with anti-SCGB3A2 (green). Scale bars, 100 μm. (B) CRISPR/Cas9 targeting strategy for human SCGB3A2 locus. CP, CherryPicker; , stop codon. (C) Schematic of directed differentiation of hPSCs to lung epithelial cell types. (D) Representative flow cytometry of SCGB3A2CP expression in cells differentiated in CFK+DCI (left) or 2+10+DCI (right). (E) Quantification of flow cytometry results from (D). n = 3 biological replicates from cells separated at day 15; similarly validated in 5 repeated differentiations. (F) Fluorescence image of SCGB3A2CP expression in airway spheres. Scale bar, 50 μm. (G) Confocal microscopy of CherryPicker (SCGB3A2CP) cytoplasmic protein (red) in airway spheres (DNA, Hoechst; blue). Scale bar, 25 μm. (H) qRT-PCR of fold change of gene expression compared with day 0 hPSCs (2−ΔΔCt) in cells differentiated in each indicated condition and sorted based on expression of SCGB3A2CP (SC+ versus SC−). PreS, presorted/unsorted cells. Bars represent mean ± SD; p ≤ 0.01, ∗∗∗∗p ≤ 0.0001. Adjusted p values obtained by ordinary one-way ANOVA with Tukey's multiple comparisons test. Asterisks indicate comparison between SC+ and other conditions (SC+, SC−, n = 9 biological replicates of independent wells from 3 independent differentiations for SCGB3A2 and SCGB1A1 and n = 6 biological replicates of independent wells from 2 independent differentiations for AFP and NKX2-1. PreS values are from n = 3 replicates of independent wells from 1 differentiation). See also Figure S2.
Figure 3
Figure 3
Kinetic Microarray Analysis Reveals Progression of Cells to an SCGB3A2+ Secretory Lineage (A) Flow cytometry of SCGB3A2CP expression over time with fluorescence microscopy of SCGB3A2CP expression in live airway spheres shown for the indicated time points. Scale bars, 50 μm. The arrow indicates emerging CherryPicker+ sphere. (B) Kinetic of gene expression (qRT-PCR; 2−ΔΔCt). Bars represent mean ± SD (day 29: n = 1; day 36: n = 3; day 44: n = 3; day 52: n = 2 replicates from wells separated after day 15 sort and then sorted for SC+ versus SC− at each indicated time point for qRT-PCR). (C) Schematic of microarray experiment for (D–F). (D) Principle component analysis of global transcriptomes from n = 3 independent differentiations (biological replicates) of microarray samples indicated in (C). (E) Volcano plot of differential gene expression between day 36 SC+ and SC− cells. Indicated genes are a selected subset of those meeting indicated cutoff criteria by pairwise Student's t test. (F) Heatmap representing relative gene expression over time of selected transcripts related to lung development (FDR ≤ 0.01). See also Figure S3.
Figure 4
Figure 4
Expression of Proximal and Distal Lung Epithelial Marker Genes in the hPSC-Derived Airway Epithelial Cell Population (A) Heatmap of AEC2 cell marker genes from microarray analysis across indicated time points (FDR ≤ 0.01). (B) Gene expression (qRT-PCR; 2−ΔΔCt) in cells differentiated toward airway epitheilum and sorted for expression of SCGB3A2CP (SC+) or differentiated toward alveolar epithelium and sorted for expression of SFTPCtdTomato (iAEC2s). D, time of differentiation in days. Bars represent mean ± SD, n = 3 biological replicates from independent differentiations. p ≤ 0.05, ∗∗p ≤ 0.01, ∗∗∗p ≤ 0.001, ∗∗∗∗p ≤ 0.0001. Adjusted p values obtained by ordinary one-way ANOVA with Tukey's multiple comparisons test. Asterisks indicate comparison between iAEC2s and all other conditions.
Figure 5
Figure 5
Single-Cell RNA-Seq of hPSC-Derived Airway Epithelial Spheres Reveals Subsets of Secretory and Basal-like Cells Expressing Distinct Markers (A) Experiment schematic. (B) Dimensionality reduction plot (ZINB-WaVE) of global transcriptomes of the top 1,000 most variable genes across 66 individual cells. Indicated cell groups were identified by k-means clustering analysis. (C) Row-normalized heatmap of global gene expression using unsupervised hierarchical clustering of all 66 cells based on the 560 genes that passed the thresholds (variance > 3 and ANOVA FDR < 0.05) indicated in (B). (D) Correlation analysis between the log-expression of SCGB3A2 and CherryPicker mRNA in all 66 cells. (E) Violin plots showing normalized expression for indicated genes across cell clusters. Colored points indicate sort markers used (red, SC+; green, SC−); violin color indicates assigned cell cluster (red, C1; green, C2; blue, C3). See also Figure S4.
Figure 6
Figure 6
Single-Cell Transcriptomic Comparison of hPSC-Derived Airway and Alveolar Epithelial Cells (A) Experimental schematic. (B–D) tSNE plots of 1,392 cells with (B) culture medium indicated; (C) lineage names assigned to 7 clusters identified by k-means; or (D) overlayed normalized expression of indicated marker genes. (E) Heatmap of the top 50 differentially expressed genes in each of 7 cell clusters compared with all cells by negative binomial exact test (ranked by FC; FDR < 5 × 10−4). See also Figures S5 and S6.
Figure 7
Figure 7
Co-expression of Distal Programs in hPSC-Derived Airway Cells Is Reduced by Wnt Inhibition (A) Representative electron micrograph of ultra-thin sections of epithelial spheres differentiated in proximal medium with characteristic lamellar body structures. gl, glycogen; lb, lamellar bodies; mv, microvilli; n, nucleus; g, Golgi apparatus. (B) Schematic of surfactant protein B processing in functional lamellar bodies. (C) Western blots of hPSC-derived airway (bronchospheres) and alveolar spheres (iAEC2s), generated in proximal versus distal medium, respectively; immunostained for total SFTPB (left) and precursor SFTPB protein with retained N-flank (right). (D) Schematic of experiment testing Wnt inhibition during airway sphere formation. (E and F) Representative flow cytometry and quantification (E) of day 33 airway spheres treated with vehicle, CHIR, or XAV939 from day 15–33 of differentiation (F). Mean ± SD; n = 3 replicates of independent wells separated at day 15. (G) Gene expression (qRT-PCR; 2−ΔΔCt) in cells differentiated under indicated conditions and sorted based on expression of SCGB3A2CP (SC+ versus SC−). (F and G) Bars represent mean ± SD (n = 3 replicates of independent wells separated at day 15, representative of 2 repeated differentiations on independent PSC lines). ∗∗p ≤ 0.01, ∗∗∗p ≤ 0.001, ∗∗∗∗p ≤ 0.0001. Adjusted p values obtained by ordinary one-way ANOVA with Tukey's multiple comparisons test. Asterisks indicate comparison between vehicle-treated SC+ and all other conditions. (H) Schematic of cell fate decisions in directed differentiation of lung epithelium. See also Figure S7.

References

    1. Boers J.E., Ambergen A.W., Thunnissen F.B. Number and proliferation of Clara cells in normal human airway epithelium. Am. J. Respir. Crit. Care Med. 1999;159(5 Pt 1):1585–1591. - PubMed
    1. Brasch F., Johnen G., Winn-Brasch A., Guttentag S.H., Schmiedl A., Kapp N., Suzuki Y., Müller K.M., Richter J., Hawgood S. Surfactant protein B in type II pneumocytes and intra-alveolar surfactant forms of human lungs. Am. J. Respir. Cell Mol. Biol. 2004;30:449–458. - PubMed
    1. Goss A.M., Tian Y., Tsukiyama T., Cohen E.D., Zhou D., Lu M.M., Yamaguchi T.P., Morrisey E.E. Wnt2/2b and beta-catenin signaling are necessary and sufficient to specify lung progenitors in the foregut. Dev. Cell. 2009;17:290–298. - PMC - PubMed
    1. Guha A., Vasconcelos M., Cai Y., Yoneda M., Hinds A., Qian J., Li G., Dickel L., Johnson J.E., Kimura S. Neuroepithelial body microenvironment is a niche for a distinct subset of Clara-like precursors in the developing airways. Proc. Natl. Acad. Sci. USA. 2012;109:12592–12597. - PMC - PubMed
    1. Guha A., Vasconcelos M., Zhao R., Gower A.C., Rajagopal J., Cardoso W.V. Analysis of notch signaling-dependent gene expression in developing airways reveals diversity of Clara cells. PLoS One. 2014;9:e88848. - PMC - PubMed

Publication types

MeSH terms