. 2018 Apr 10;3(3):e00198-17.
doi: 10.1128/mSystems.00198-17. eCollection 2018 May-Jun.

Inferring the Minimal Genome of Mesoplasma florum by Comparative Genomics and Transposon Mutagenesis

Affiliations

Inferring the Minimal Genome of Mesoplasma florum by Comparative Genomics and Transposon Mutagenesis

Vincent Baby et al. mSystems. .

Abstract

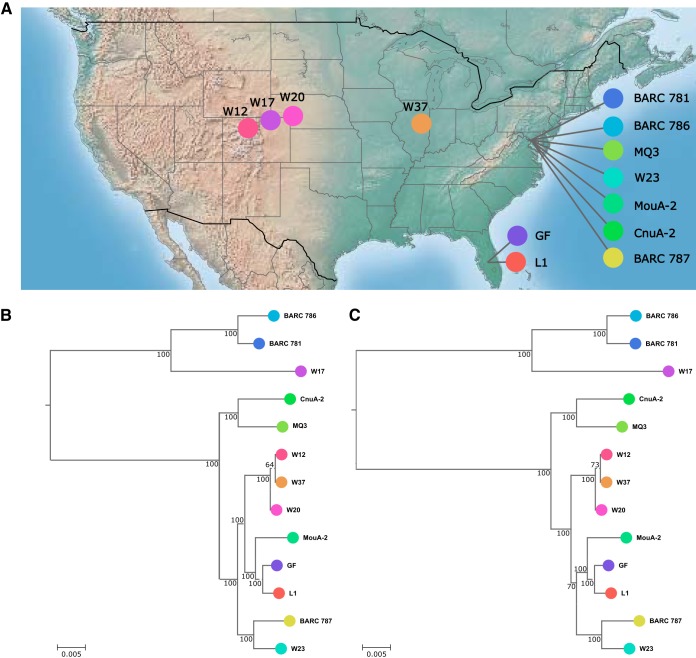
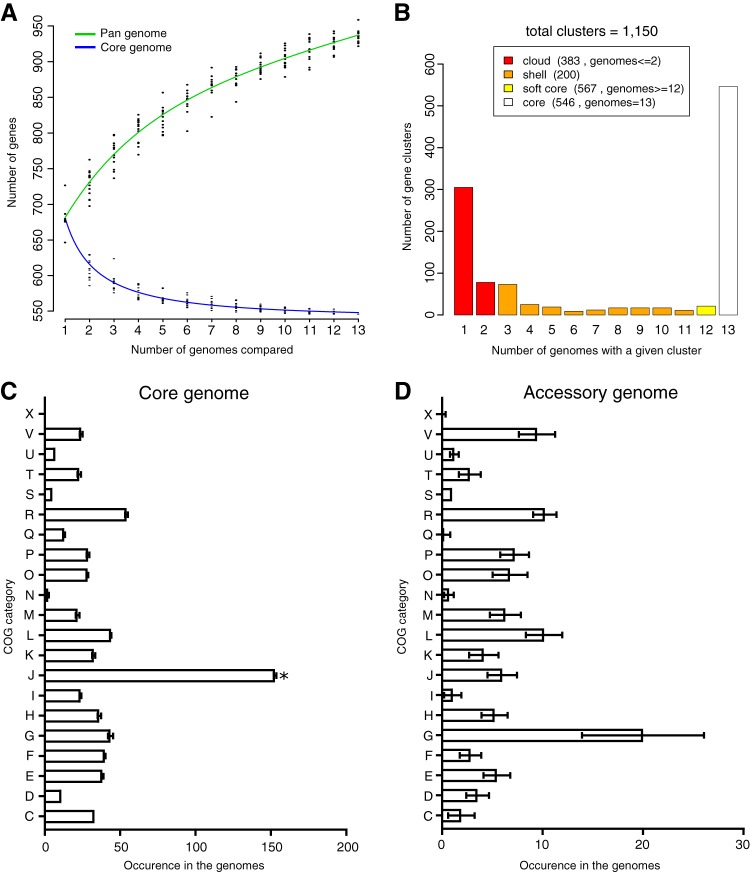
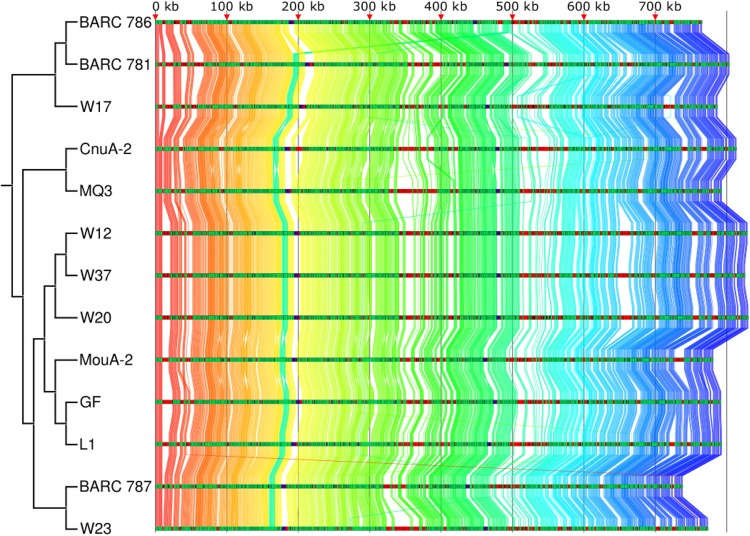
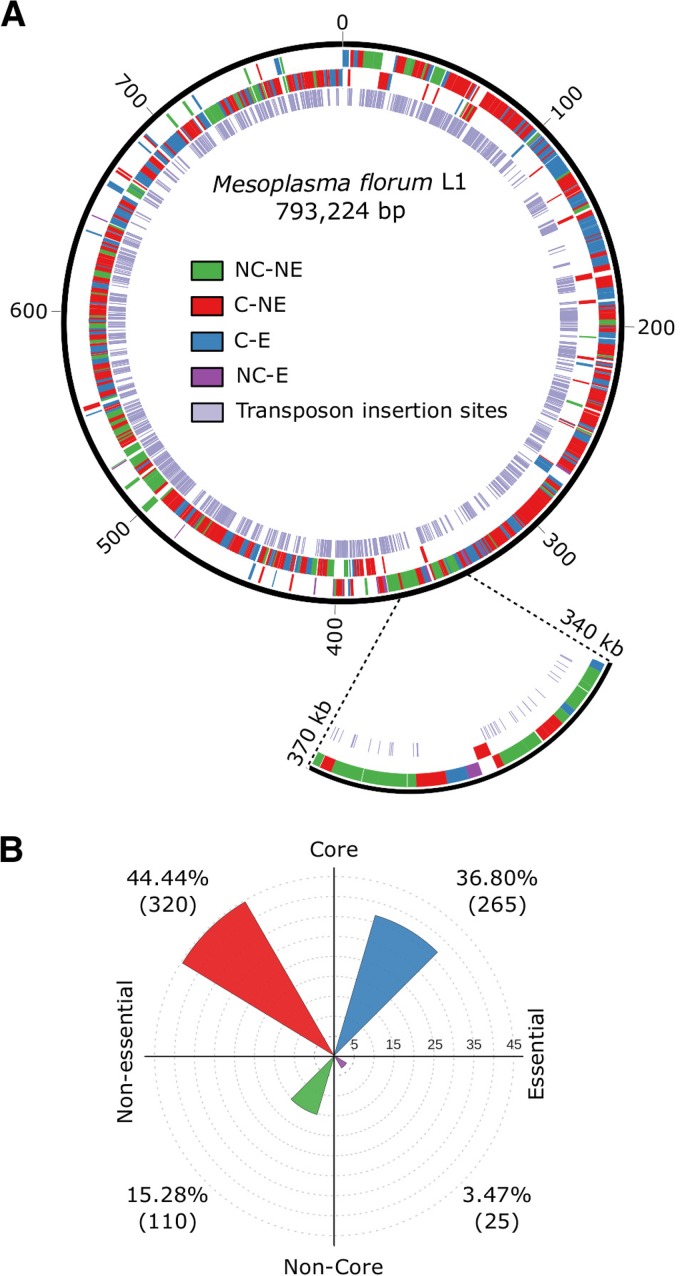
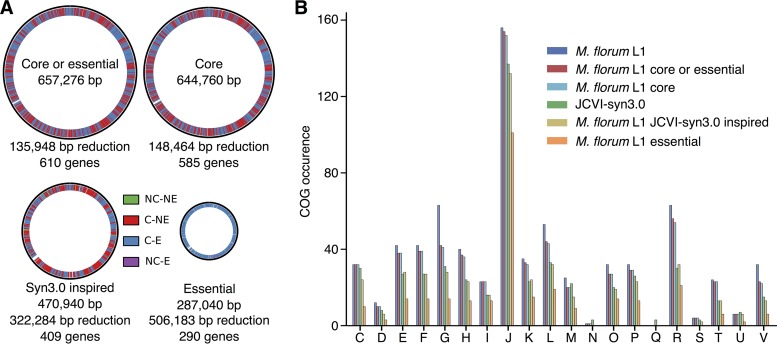
The creation and comparison of minimal genomes will help better define the most fundamental mechanisms supporting life. Mesoplasma florum is a near-minimal, fast-growing, nonpathogenic bacterium potentially amenable to genome reduction efforts. In a comparative genomic study of 13 M. florum strains, including 11 newly sequenced genomes, we have identified the core genome and open pangenome of this species. Our results show that all of the strains have approximately 80% of their gene content in common. Of the remaining 20%, 17% of the genes were found in multiple strains and 3% were unique to any given strain. On the basis of random transposon mutagenesis, we also estimated that ~290 out of 720 genes are essential for M. florum L1 in rich medium. We next evaluated different genome reduction scenarios for M. florum L1 by using gene conservation and essentiality data, as well as comparisons with the first working approximation of a minimal organism, Mycoplasma mycoides JCVI-syn3.0. Our results suggest that 409 of the 473 M. mycoides JCVI-syn3.0 genes have orthologs in M. florum L1. Conversely, 57 putatively essential M. florum L1 genes have no homolog in M. mycoides JCVI-syn3.0. This suggests differences in minimal genome compositions, even for these evolutionarily closely related bacteria. IMPORTANCE The last years have witnessed the development of whole-genome cloning and transplantation methods and the complete synthesis of entire chromosomes. Recently, the first minimal cell, Mycoplasma mycoides JCVI-syn3.0, was created. Despite these milestone achievements, several questions remain to be answered. For example, is the composition of minimal genomes virtually identical in phylogenetically related species? On the basis of comparative genomics and transposon mutagenesis, we investigated this question by using an alternative model, Mesoplasma florum, that is also amenable to genome reduction efforts. Our results suggest that the creation of additional minimal genomes could help reveal different gene compositions and strategies that can support life, even within closely related species.

Keywords: Mesoplasma florum; comparative genomics; minimal genome; transposon mutagenesis.


Figures

FIG 1
FIG 1
M. florum strain sampling and phylogeny. (A) Isolation sites of the 13 M. florum strains analyzed in this study. (B, C) M. florum phylogenetic trees constructed by using concatenated alignments of 412 conserved proteins and the Kimura distance model (B) or maximum likelihood (C). M. capricolum was used as the outgroup for both trees and is not shown because of the long branch length. Bootstrap values correspond to 100 repetitions. In both trees, branch length represents the substitution rate per site per unit of alignment length.
FIG 2
FIG 2
Pangenomes and core genomes of 13 M. florum strains. (A) Gene number estimation curves for the core genomes (blue, bottom curve) and pangenomes (green, top curve) were generated by the methods of Willenbrock et al. (60) and Tettelin et al. (61), respectively. (B) Prevalence of the different protein clusters across 13 strains. (C, D) Average number of protein groups in COG categories found in the core (C) and accessory (D) genomes of each strain. The COG categories are as follows: C, energy production and conversion; D, cell cycle control, cell division, and chromosome partitioning; E, amino acid transport and metabolism; F, nucleotide transport and metabolism; G, carbohydrate transport and metabolism; H, coenzyme transport and metabolism; I, lipid transport and metabolism; J, translation, ribosomal structure, and biogenesis; K, transcription; L, replication, recombination, and repair; M, cell wall/membrane/envelope biogenesis; N, cell motility; O, posttranslational modification, protein turnover, chaperones; P, inorganic ion transport and metabolism; Q, secondary metabolite biosynthesis, transport, and catabolism; R, general function prediction only; S, function unknown; T, signal transduction mechanisms; U, intracellular trafficking, secretion, and vesicular transport; V, defense mechanisms; X, mobilome (prophages, transposons).
FIG 3
FIG 3
Core genome synteny of the 13 M. florum strains. Protein-encoding genes of the core genome are linked across all strains by using a color gradient based on the gene order observed in M. florum BARC 786. Each genome track is colored on the basis of core proteins (green), noncore proteins (red), and functional RNAs (purple). The topology of the distance tree is shown on the left.
FIG 4
FIG 4
Overview of M. florum L1 genomic landscape based on gene conservation and essentiality. (A) Classification of M. florum L1 genes shown by a color representing core (C), noncore (NC), essential (E), or nonessential (NE) genes with plus strand genes in the outermost layer and minus strand genes in the middle layer. Transposon insertion sites are also in the innermost layer. The 340- to 370-kbp region is enlarged to show an example of a locus containing all types of gene categories. (B) Gene distribution across the different categories.
FIG 5
FIG 5
Genome reduction designs for M. florum L1. (A) Representation of four different versions of reduced M. florum L1 genome based on gene conservation, function, and essentiality. Genes are shown by a color representing core (C), noncore (NC), essential (E), or nonessential (NE) genes. In each case, the number of deleted bases is shown and corresponds to the sum of the lengths of the CDSs of the deleted genes. (B) Number of protein-encoding genes in each COG categories found in the different designs. The COG categories are as described in the legend to Fig. 2.

Similar articles

Cited by

References

    1. Richardson SM, Mitchell LA, Stracquadanio G, Yang K, Dymond JS, DiCarlo JE, Lee D, Huang CLV, Chandrasegaran S, Cai Y, Boeke JD, Bader JS. 2017. Design of a synthetic yeast genome. Science 355:1040–1044. doi:10.1126/science.aaf4557. - DOI - PubMed
    1. Hutchison CA III, Chuang RY, Noskov VN, Assad-Garcia N, Deerinck TJ, Ellisman MH, Gill J, Kannan K, Karas BJ, Ma L, Pelletier JF, Qi ZQ, Richter RA, Strychalski EA, Sun L, Suzuki Y, Tsvetanova B, Wise KS, Smith HO, Glass JI, Merryman C, Gibson DG, Venter JC. 2016. Design and synthesis of a minimal bacterial genome. Science 351:aad6253. doi:10.1126/science.aad6253. - DOI - PubMed
    1. Annaluru N, Ramalingam S, Chandrasegaran S. 2015. Rewriting the blueprint of life by synthetic genomics and genome engineering. Genome Biol 16:125. doi:10.1186/s13059-015-0689-y. - DOI - PMC - PubMed
    1. Csörgő B, Nyerges Á, Pósfai G, Fehér T. 2016. System-level genome editing in microbes. Curr Opin Microbiol 33:113–122. doi:10.1016/j.mib.2016.07.005. - DOI - PubMed
    1. Koonin EV. 2003. Comparative genomics, minimal gene-sets and the last universal common ancestor. Nat Rev Microbiol 1:127–136. doi:10.1038/nrmicro751. - DOI - PubMed

LinkOut - more resources