

Nonpareil 3: Fast Estimation of Metagenomic Coverage and Sequence Diversity
- PMID: 29657970
- PMCID: PMC5893860
- DOI: 10.1128/mSystems.00039-18
Nonpareil 3: Fast Estimation of Metagenomic Coverage and Sequence Diversity
Abstract
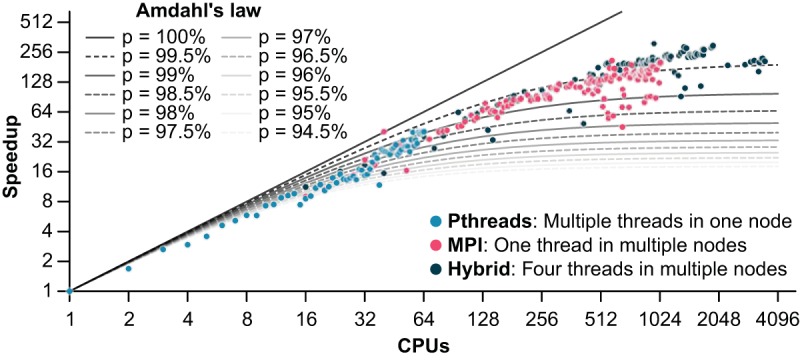
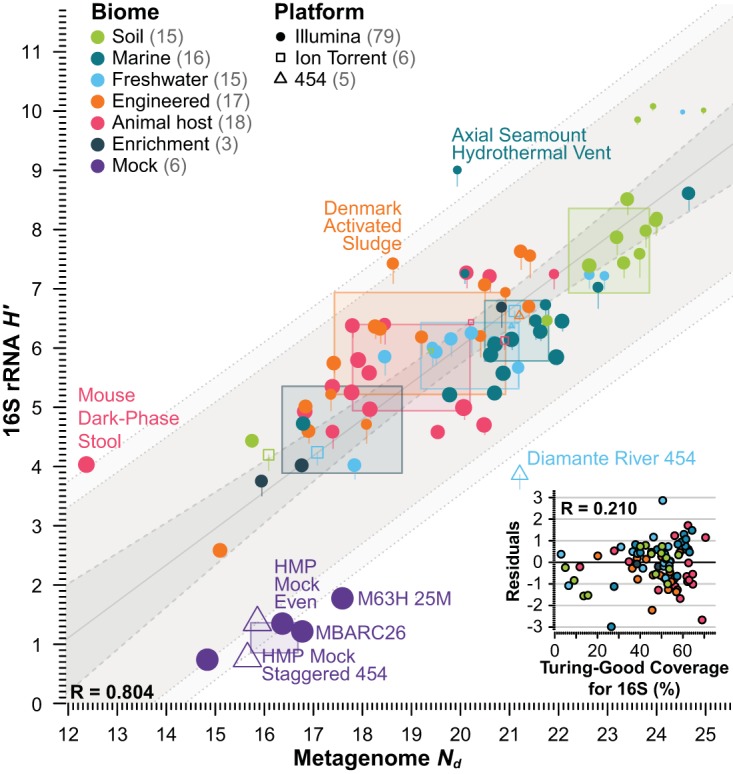
Estimations of microbial community diversity based on metagenomic data sets are affected, often to an unknown degree, by biases derived from insufficient coverage and reference database-dependent estimations of diversity. For instance, the completeness of reference databases cannot be generally estimated since it depends on the extant diversity sampled to date, which, with the exception of a few habitats such as the human gut, remains severely undersampled. Further, estimation of the degree of coverage of a microbial community by a metagenomic data set is prohibitively time-consuming for large data sets, and coverage values may not be directly comparable between data sets obtained with different sequencing technologies. Here, we extend Nonpareil, a database-independent tool for the estimation of coverage in metagenomic data sets, to a high-performance computing implementation that scales up to hundreds of cores and includes, in addition, a k-mer-based estimation as sensitive as the original alignment-based version but about three hundred times as fast. Further, we propose a metric of sequence diversity (Nd ) derived directly from Nonpareil curves that correlates well with alpha diversity assessed by traditional metrics. We use this metric in different experiments demonstrating the correlation with the Shannon index estimated on 16S rRNA gene profiles and show that Nd additionally reveals seasonal patterns in marine samples that are not captured by the Shannon index and more precise rankings of the magnitude of diversity of microbial communities in different habitats. Therefore, the new version of Nonpareil, called Nonpareil 3, advances the toolbox for metagenomic analyses of microbiomes. IMPORTANCE Estimation of the coverage provided by a metagenomic data set, i.e., what fraction of the microbial community was sampled by DNA sequencing, represents an essential first step of every culture-independent genomic study that aims to robustly assess the sequence diversity present in a sample. However, estimation of coverage remains elusive because of several technical limitations associated with high computational requirements and limiting statistical approaches to quantify diversity. Here we described Nonpareil 3, a new bioinformatics algorithm that circumvents several of these limitations and thus can facilitate culture-independent studies in clinical or environmental settings, independent of the sequencing platform employed. In addition, we present a new metric of sequence diversity based on rarefied coverage and demonstrate its use in communities from diverse ecosystems.
Keywords: bioinformatics; coverage; metagenomics; microbial ecology.
Figures
References
LinkOut - more resources
Full Text Sources
Other Literature Sources
Miscellaneous
