. 2018 May 23;118(10):4981-5079.
doi: 10.1021/acs.chemrev.7b00776. Epub 2018 Apr 16.

Metal Catalysts for Heterogeneous Catalysis: From Single Atoms to Nanoclusters and Nanoparticles

Affiliations

Metal Catalysts for Heterogeneous Catalysis: From Single Atoms to Nanoclusters and Nanoparticles

Lichen Liu et al. Chem Rev. .

Abstract

Metal species with different size (single atoms, nanoclusters, and nanoparticles) show different catalytic behavior for various heterogeneous catalytic reactions. It has been shown in the literature that many factors including the particle size, shape, chemical composition, metal-support interaction, and metal-reactant/solvent interaction can have significant influences on the catalytic properties of metal catalysts. The recent developments of well-controlled synthesis methodologies and advanced characterization tools allow one to correlate the relationships at the molecular level. In this Review, the electronic and geometric structures of single atoms, nanoclusters, and nanoparticles will be discussed. Furthermore, we will summarize the catalytic applications of single atoms, nanoclusters, and nanoparticles for different types of reactions, including CO oxidation, selective oxidation, selective hydrogenation, organic reactions, electrocatalytic, and photocatalytic reactions. We will compare the results obtained from different systems and try to give a picture on how different types of metal species work in different reactions and give perspectives on the future directions toward better understanding of the catalytic behavior of different metal entities (single atoms, nanoclusters, and nanoparticles) in a unifying manner.


Conflict of interest statement

The authors declare no competing financial interest.

Figures

Figure 1
Figure 1
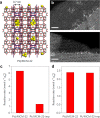
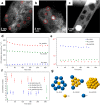
Geometric and electronic structures of single atom, clusters, and nanoparticles.
Figure 2
Figure 2
Work function obtained from ultraviolet photoelectron spectroscopy (UPS) of Au clusters with different atomicty. Adapted with permission from ref (15). Copyright 1992 AIP Publishing LLC.
Figure 3
Figure 3
Electronic structures of Au clusters according to theoretical calculations. Optimized structure (top) and calculated isosurfaces of the lowest unoccupied molecular orbital (LUMO, center) and highest occupied molecular orbital (HOMO, bottom) of Au3, Au4, Au5, Au6, Au7, Au13, and Au38 clusters, together with molecular orbital energy levels in blue. Obtained at the B3LYP/LANL2DZ level using the Gaussian 09 program. Adapted with permission from ref (16). Copyright 2014 American Chemical Society.
Figure 4
Figure 4
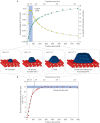
(a) STM image (6 nm × 6 nm) of the clean Fe3O4(001) surface. The bright double protrusions located on the Fe(B) rows correspond to hydroxyl species. (b) Top view of the Fe3O4(001) surface. Alternate pairs of surface Fe(B) cations (yellow) relax perpendicular to the Fe(B) row (relaxation indicated by blue arrows), creating two types of hollow sites within the reconstructed surface cell: wide (W) and narrow (N). (c) STM image (30 nm × 30 nm) of 0.12 ML Au deposited on Fe3O4(001) surface at room temperature. Au adatoms are located between the surface Fe(B) rows, in the center of the cell, that is, at the narrow sites. (d) Coverage of single Au adatoms after annealing 0.1 ML Au to various temperatures. The decrease of surface coverage of Au adatoms is caused by the sintering of single Au atoms into clusters. Adapted with permission from ref (26). Copyright 2012 American Physical Society.
Figure 5
Figure 5
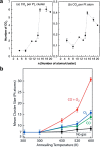
(a) Size-dependent adsorption heat of Ag atom when Ag is vapor deposited onto different metal oxide surfaces at 300 K for growing Ag nanoparticles on the surface. (b) Size-dependent partial molar enthalpy of Ag atoms in Ag nanoparticles on different oxide surfaces. Adapted with permission from ref (27). Copyright 2013 American Chemical Society.
Figure 6
Figure 6
Schematic illustration of Ostwald ripening and particle migration and coalescence during the sintering process. Adapted with permission from ref (31). Copyright 2013 American Chemical Society.
Figure 7
Figure 7
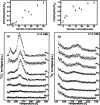
Evolution of Pt–Pt coordination parameters in supported Pt/γ-Al2O3 catalyst with 1 wt % of Pt and a Pt foil reference. (a) Temperature-dependent Pt–Pt first-neighbor distances of the Pt nanoclusters supported on γ-Al2O3 (ca. 0.9 nm), Pt nanoparticles (ca. 2.4 nm) supported on carbon black, and a Pt foil reference. (b) The mean-square relative displacement of the supported Pt clusters and Pt foil standard as a function of temperature. Adapted with permission from ref (35). Copyright 2006 American Chemical Society.
Figure 8
Figure 8
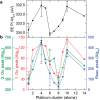
(a) The average charge on each Pt atom in Pt particles with different sizes measured by resonant photoemission spectroscopy. The partial charge on each Pt atom reaches a maximum for Pt nanoparticles with 30–70 atoms. (b) The relationship between electrons transferred per surface area and the size of Pt deposited on CeO2. At higher Pt coverage, the total amount of transferred electrons approaches a charge-transfer limit. Schematic models of Pt/CeO2 samples with different size of Pt species are also shown in this figure. Adapted with permission from ref (40). Copyright 2016 Macmillan Publishers Limited, part of Springer Nature.
Figure 9
Figure 9
Schematic illustration of charge transfer between ZnO nanoparticle and Au particles with different sizes. The kinetic curves of photocatalytic degradation of thionine (a model dye molecule) are also presented to show the kinetics of the recombination of photogenerated electrons and holes in ZnO nanoparticles. With a faster charge-transfer process between Au particles and ZnO nanoparticles, the photocatalytic degradation of thionine will be faster. Adapted with permission from ref (56). Copyright 2011 American Chemical Society.
Figure 10
Figure 10
Size-dependent CO adsorption energy on Pd species from subnanometric clusters to nanoparticles. Adapted with permission from ref (57). Copyright 2013 American Chemical Society.
Figure 11
Figure 11
Reversible transformation between single Pt atoms and Pt nanoclusters (∼1 nm) confined in CHA zeolite under reduction–oxidation treatments. Adapted with permission from ref (53). Copyright 2017 American Chemical Society.
Figure 12
Figure 12
(a–f) High-resolution TEM images on the disintegration of Ag nanoparticles on hollandite manganese oxide during the calcination in air. (g,h) High-resolution STEM image of the singly dispersed Ag atoms in the lattice of hollandite manganese oxide after the disintegration of Ag nanoparticles. Adapted with permission from ref (83). Copyright 2015 Wiley-VCH Verlag GmbH & Co. KGaA, Weinheim.
Figure 13
Figure 13
(a) High-resolution STEM image and the corresponding size distribution of Au species in Au–Na/[Si]MCM41 catalyst with 0.25 wt % of Au. (b) TOF values of atomically dispersed Au species on different supports. The TOF values are obtained under the same reaction conditions. Adapted with permission from ref (90). Copyright 2014 Association for the Advancement of Science. (c) High-resolution STEM image and the corresponding size distribution of Pt species in Pt–Na/TiO2 catalyst with 0.5 wt % of Pt. (d) TOF values of atomically dispersed Pt species on different supports. The TOF values are obtained under the same reaction conditions. Adapted with permission from ref (91). Copyright 2015 American Chemical Society.
Figure 14
Figure 14
(a–c) High-resolution STEM images of singly dispersed Pt atoms on Co3O4 nanorods. Pt atoms are indicated by red circles. (d,e) High-resolution STEM images of PtmCon/CoO sample after WGS reaction at 350 °C. PtmCom clusters are indicated by red circles. Adapted with permission from ref (95). Copyright 2013 American Chemical Society.
Figure 15
Figure 15
(a) High-resolution STEM image of Pd/Al2O3 sample containing 0.03 wt % of Pd. (b) Relationships between the TOFs of surface Pd species for aerobic oxidation of crotyl alcohol and the particle size and chemical states of Pd in various Pd/Al2O3 catalysts. Adapted with permission from ref (100). Copyright 2007 Wiley-VCH Verlag GmbH & Co. KGaA, Weinheim.
Figure 16
Figure 16
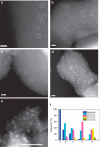
STEM images of various Pt/FeOx catalysts with different Pt loading. (a) Pt/FeOx with 0.08 wt % of Pt and reduced by H2 at 200 °C. (b) Pt/FeOx with 0.08 wt % of Pt and reduced by H2 at 250 °C. (c) Pt/FeOx with 0.31 wt % of Pt and reduced by H2 at 250 °C. (d) Pt/FeOx with 0.75 wt % of Pt and reduced by H2 at 250 °C. (e) Pt/FeOx with 4.30 wt % of Pt and reduced by H2 at 250 °C. The circles, squares, and triangles in the above images correspond to single Pt atoms, two-dimensional Pt clusters, and three-dimensional Pt nanoparticles, respectively. Adapted with permission from ref (106). Copyright 2014 Macmillan Publishers Limited, part of Springer Nature.
Figure 17
Figure 17
Catalytic performances of Pd1/graphene, Pd-NPs/graphene, Pd-NPs/graphene-500C, and Pd/carbon samples for selective hydrogenation of 1,3-butadiene. (a) Selectivity to butenes as a function of butadiene conversion by changing the reaction temperatures. (b) Distribution of butene products at 95% conversion of butadiene. Conversion of propene (c) and the distribution of butene products (d) at 98% conversion of butadiene in the presence of 70% of propene in the feed gas. (e) Schematic illustration of the reactivity of 1,3-butadiene on Pd nanoparticles and Pd single atoms, showing different chemoselectivity. Adapted with permission from ref (108). Copyright 2015 American Chemical Society.
Figure 18
Figure 18
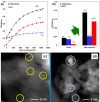
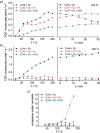
(a) TOFs of CO2, CO, and CH4 as a function of time-on-stream at 350 °C over Ru/Al2O3 catalyst (with 0.1% of Ru). (b) TOFs for CO2 conversion and CO/CH4 production at steady state over a fresh and used (after CO2 hydrogenation reaction at 350 °C) Ru/Al2O3 catalyst at 300 °C. (c) STEM image of the fresh Ru/Al2O3 catalyst, showing the presence of single Ru atoms in the catalyst. (d) STEM image of the Ru/Al2O3 catalyst after CO2 hydrogenation reaction at 350 °C, showing the presence of Ru clusters and nanoparticles. Adapted with permission from ref (111). Copyright 2013 American Chemical Society.
Figure 19
Figure 19
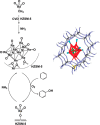
(A) Catalytic mechanism of heterolytic activation of H2 on Pd single atom stabilized by ethylene glycolate ligands in Pd1/TiO2 catalyst. (B) Primary isotope effect on Pd1/TiO2 catalyst in hydrogenation of styrene. (C) Catalytic performances of Pd1/TiO2, Pd/C, and H2PdCl4 for hydrogenation of benzaldehyde. Adapted with permission from ref (118). Copyright 2016 The American Association for the Advancement of Science.
Figure 20
Figure 20
Activities of MgO-supported Au catalysts with different sizes (from mononuclear Au complex to Au clusters and nanoparticles) for hydrogenation of ethene. Adapted with permission from ref (120). Copyright 2003 Wiley-VCH Verlag GmbH & Co. KGaA, Weinheim.
Figure 21
Figure 21
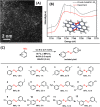
(A) High-resolution STEM image of singly dispersed Co atoms stabilized by N-doped carbon matrix (Co–N–C catalyst). (B) Determination of the coordination structure of Co–N–C catalyst according to the fitting and simulation of XANES spectrum. (C) Hydrogenation of nitroarenes to corresponding azo products using Co–N–C catalyst. Adapted with permission from ref (129). Copyright 2016 The Royal Society of Chemistry.
Figure 22
Figure 22
Schematic illustration of immobilization of single-site Co catalyst in porous metal–organic framework and its catalytic applications for hydrogenation reactions. The metal center in MOF is Zr or Hf, and the organic linker is p-biphenylcarboxylate. The single-site Co catalyst is stabilized by the secondary building unites. Adapted with permission from ref (133). Copyright 2016 American Chemical Society.
Figure 23
Figure 23
Transformation of surface Fe species in the presence of H2 at evaluated temperature to form isolated FeII sites (1-FeII). Mononuclear Fe complex (1-FeoCp) was reduced by H2 at 400 °C and formed nanosized FeOx (1-C). These nanosized FeOx were disintegrated into highly dispersed FeII species when the temperature reached 650 °C in H2. A TEM image of the Fe/SiO2 catalyst containing isolated FeII sites is also presented. Adapted with permission from ref (136). Copyright 2015 American Chemical Society.
Figure 24
Figure 24
(a) Atomic-resolution STEM image of single-layer Co–MoS2 catalyst. (b) Intensity profiles of four different lines and corresponding simulation results in the high-resolution STEM image. The location of Co atoms is determined according to the contrast. The dots with higher contrast intensity are ascribed to Co atoms. (c) Kinetic comparison between different types of catalysts for the hydrodeoxygenation of 4-methylphenol to toluene. (d) Stability test of single-layer Co–MoS2 catalyst for hydrodeoxygenation of 4-methylphenol to toluene. Adapted with permission from ref (130). Copyright 2017 Macmillan Publishers Limited, part of Springer Nature.
Figure 25
Figure 25
(A) Product distributions on various Fe-based catalysts. (B) Activity and distributions of the products on Fe@SiO2 (with 0.5% of Fe) at different reaction conditions and space velocities. (C) Long-term stability test of Fe@SiO2 (with 0.5% of Fe) at 1293 K. (D) Amount of H2 produced at different temperature on Fe@SiO2 (with 0.5% of Fe) catalyst. (E) High-resolution STEM image of Fe@SiO2 (with 0.5% of Fe) catalyst after the reaction. (F) Schematic illustration of the catalytic mechanism of CH4 activation on single-site Fe species confined in the SiO2 matrix according to theoretical calculations. Adapted with permission from ref (144). Copyright 2014 The American Association for the Advancement of Science.
Figure 26
Figure 26
(a) Coordination number of Pt–Pt bonding and Pt–Mo bonding in different supported Pt catalysts. It is clearly shown that the Pt–Pt contribution in Pt/α-MoC catalysts will increase with the Pt loading. (b) High-resolution STEM image of Pt/α-MoC with 2.0 wt % of Pt. Singly dispersed Pt atoms can be observed as bright dots in this image. (c) High-resolution STEM image of Pt/α-MoC with 0.2 wt % of Pt. Singly dispersed Pt atoms can be observed as bright dots in this image. (d) Aqueous reforming of methanol for H2 production on 0.2%Pt/α-MoC under practical conditions. Adapted with permission from ref (151). Copyright 2017 Macmillan Publishers Limited, part of Springer Nature.
Figure 27
Figure 27
(A) High-resolution STEM image of the catalyst containing singly dispersed Rh atoms in porous organic copolymers. (B) TOF values for hydroformylation of propene catalyzed by various Rh-biphephos&PPh3@copolymers catalysts with different loading of Rh. The catalyst with the lowest Rh loading shows the highest TOF values and higher linear/branched ratio in the products. (C) High-resolution STEM image of the same catalyst after 1008 h of time-on-stream for propene hydroformylation, showing the presence of singly dispersed Rh atoms. (D) Long-term stability test of the Rh-biphephos&PPh3@copolymers containing singly dispersed Rh atoms for hydroformylation of propene. Adapted with permission from ref (156). Copyright 2016 The Royal Society of Chemistry.
Figure 28
Figure 28
(a) High-resolution STEM image of PtO/TiO2 catalyst, showing the presence of single Pt atoms as well as Pt clusters. (b) Size distributions of PtO species in various PtO/TiO2 catalysts. (c) H2 evolution rates on PtO/TiO2 catalysts with different Pt loading. (d) H2 evolution rates normalized to the amount of Pt species in various PtO/TiO2 catalysts. Adapted with permission from ref (159). Copyright 2014 Wiley-VCH Verlag GmbH & Co. KGaA, Weinheim.
Figure 29
Figure 29
Photocatalytic hydrogen evolution rates from triethanolamine aqueous solution on various Pt/C3N4 catalysts with different loading of Pt. When the Pt loading is lower than 0.16 wt %, Pt mainly exist as singly dispersed atoms. When it increases to 0.38 wt %, Pt clusters will appear and Pt continues to grow into Pt nanoparticles in the Pt/C3N4 sample with 3.2 wt % of Pt. The H2 evolution rates have been normalized to the mass of Pt cocatalyst in various catalysts. Adapted with permission from ref (161). Copyright 2016 Wiley-VCH Verlag GmbH & Co. KGaA, Weinheim.
Figure 30
Figure 30
(a) TEM image and (b) high-resolution STEM image of single Co atoms dispersed on N-doped graphene (named as Co-NG). (c) Electrocatalytic hydrogenation evolution performances of different catalysts in 0.5 M H2SO4 at scan rate of 2 mV s–1. (d) The amount of evolved H2 gas measured by gas chromatograph (black plots) and the theoretical values by assuming 100% Faradaic efficiency (red line). (e) Tafel plots of the polarization curves. (f) Comparison between the Co-NG catalyst and reported non-noble metal catalysts for hydrogenation evolution reaction. Adapted with permission from ref (166). Copyright 2015 Macmillan Publishers Limited, part of Springer Nature.
Figure 31
Figure 31
Correlation between the amount of Fe–Nx species and ORR activity in terms of E1/2 values in three Fe–N–C catalysts with different compositions of atomically dispersed Fe–Nx and nanoparticulate Fe/FeCx species. Adapted with permission from ref (174). Copyright 2016 American Chemical Society.
Figure 32
Figure 32
(A) Hydrocarbonylation of terminal alkynes catalyzed by Pd catalyst. (B) Mechanism of the alkoxycarbonylation of alkynes in the presence of the Pd(OAc)2/2-PyPPh2/acidic promoters. (C) Synthesis of porous organic copolymers containing acid sites and phosphine ligands. (D) High-resolution STEM images of the as-prepared Pd-PyPPh2-SO3H@POPs catalyst, showing the presence of isolated Pd atoms. (E) High-resolution STEM image of the used Pd-PyPPh2-SO3H@POPs catalyst, showing the preservation of isolated Pd atoms. (F) Stability tests of Pd-PyPPh2-SO3H@POPs catalyst in the methoxycarbonylation of phenylacetylene for five cycles. Adapted with permission from ref (177). Copyright 2016 Wiley-VCH Verlag GmbH & Co. KGaA, Weinheim.
Figure 33
Figure 33
(A) Proposed catalytic cycle via Cossee–Arlman pathway for ethylene dimerization in Ni-MFU-4l. (B) The influences of reaction pressure and Ni contents in Ni-MFU-4l on the activity for ethylene dimerization reaction. (C) Selectivity to 1-butene, 2-butene, and hexenes at various ethylene pressures for Ni(10%)-MFU-4l at 25 °C with 100 equiv of methylaluminoxane. Adapted with permission from ref (179). Copyright 2016 American Chemical Society.
Figure 34
Figure 34
(a) Preparation of covalent triazine-based framework (CTF) as the solid support for mononuclear Pt complex, with coordination environment similar to that of its homogeneous analogue. Adapted with permission from ref (184). Copyright 2009 Wiley-VCH Verlag GmbH & Co. KGaA, Weinheim. (b,c) High-resolution STEM images of the as-prepared Pt/CTF catalyst before the reaction. (d,e) High-resolution STEM images of the as-prepared Pt/CTF catalyst after oxidation of methane in concentrated H2SO4. The bright dots in the above STEM images correspond to highly dispersed single Pt atoms. Adapted with permission from ref (185). Copyright 2016 American Chemical Society.
Figure 35
Figure 35
(A) STM image of single Pd atoms deposited on Cu(111) surface. (B) Schematic illustration of the activation of H2 molecules on isolated Pd atoms and the subsequent H-spill-over on Cu(111) surface. (C) STM image of the dissociated H on Pd/Cu(111) surface. (D) Activation energy of H2 on different types of surface. Adapted with permission from ref (189). Copyright 2012 The American Association for the Advancement of Science.
Figure 36
Figure 36
Comparison of the catalytic performances of various Au–Pd bimetallic nanostructures with different amounts and distributions of Au. The activity results have already been normalized to TOFs based on the amounts of Au atoms in the catalysts. Adapted with permission from ref (195). Copyright 2011 Macmillan Publishers Limited, part of Springer Nature.
Figure 37
Figure 37
Generation of singly dispersed bimetallic clusters containing isolated atoms on metal oxides. Adapted with permission from ref (199). Copyright 2015 Macmillan Publishers Limited, part of Springer Nature.
Figure 38
Figure 38
Evolution in selectivity of mononuclear Rh(C2H4)2 complexes supported on HY zeolite with time on stream during the consecutively changed feed gases (ethylene and H2). The coordination environment of Rh species is followed by EXAFS spectroscopy. In the bottom panel, the horizontal axis and vertical axis represent time on stream and the Rh-backscatter distance, and the intensity of various contributions is represented by colors (change from red to yellow to green to blue shows a decrease in intensity of the contribution). Adapted with permission from ref (203). Copyright 2011 American Chemical Society.
Figure 39
Figure 39
(a) High-resolution STEM images of the pristine Ir1/Y catalyst, showing the presence of single Ir atoms with fine dispersion. (b) High-resolution STEM images of the Ir/Y catalyst after the first run of hydrogenation of cyclohexene, showing the presence of Ir clusters around 0.4 nm with 4–6 Ir atoms. (c) High-resolution STEM images of the Ir/Y catalyst after the second run of hydrogenation of cyclohexene, showing the presence of Ir clusters around 1 nm with ca. 40 Ir atoms. (d) High-resolution STEM images of the Ir/Y catalyst after the third run of hydrogenation of cyclohexene, showing the presence of Ir clusters around 1.3 nm with ca. 70 Ir atoms. Adapted with permission from ref (205). Copyright 2015 American Chemical Society.
Figure 40
Figure 40
(a) Temperature-programmed reaction profiles for the CO oxidation on size-selected Aun (n = 2–20) clusters on defect-rich MgO(100) surface. The model catalysts were saturated at 90 K with 13CO and 18O2, and the reaction product (13C18O16O) was detected with a mass spectrometer, as a function of temperature. (b) The number of formed CO2 molecules on each Au cluster with different atomicity. Adapted with permission from ref (214). Copyright 1999 American Chemical Society.
Figure 41
Figure 41
(a) Correlation between CO oxidation activity observed during temperature-programmed reaction (TPR) and the shifts of the Pd 3d binding energy observed by XPS. The XPS and TPR data for each type of Pd cluster were taken on the same sample. Adapted with permission from ref (213). Copyright 2009 The American Association for the Advancement of Science. (b) Mechanism of CO oxidation on Pd clusters from low to high temperature. At low temperature, Pd clusters will be poisoned by CO and cannot catalyze the CO oxidation. When the temperature increases to ca. 300 K, part of the Pd clusters are exposed to O2 molecules and become able to activate O2 and catalyze the CO+O2 reaction. At ca. 400 K, a Langmuir–Hinshelwood-type reaction can be observed on Pd clusters for CO oxidation. Adapted with permission from ref (225). Copyright 2010 American Chemical Society.
Figure 42
Figure 42
(a) Total number of catalytically produced CO2 molecules as a function of cluster size of Pt. Total number of produced CO2 molecules per Pt atom as a function of cluster size. Adapted with permission from ref (229). Copyright 1999 American Chemical Society. (b) Evolution of the average size of deposited Pt7 clusters on TiO2(110) after annealing in a vacuum (black) and exposure to O2 (blue), CO (green), and both reactants (red). Adapted with permission from ref (230). Copyright 2014 American Chemical Society.
Figure 43
Figure 43
(A) High-resolution STEM image of Rh/TiO2 sample, containing subnanometric Rh species and small Rh nanoparticles. (B) Size distribution of Rh species in this Rh/TiO2 sample. (C) CO oxidation activity as a function of temperature on Rh/TiO2 catalyst. (D) Comparison of TOFs at 293 K on various supported Rh catalysts for CO oxidation reaction. Adapted with permission from ref (238). Copyright 2016 Wiley-VCH Verlag GmbH & Co. KGaA, Weinheim.
Figure 44
Figure 44
(a) Illustration of oxidation of CH4 with Cu-exchanged zeolites through a cyclic process. Adapted with permission from ref (242). Copyright 2016 Wiley-VCH Verlag GmbH & Co. KGaA, Weinheim. (b,c) Schematic illustration of Cu3 clusters located in the side pockets of MOR zeolites. The Cu3(μ-O)3 clusters are proposed to be the active sites for oxidation of CH4. Adapted with permission from ref (243). Copyright 2015 Macmillan Publishers Limited, part of Springer Nature.
Figure 45
Figure 45
Generation of Re10 clusters in ZSM-5 by chemical vapor deposition and the dynamic transformation of Re10 clusters and mononuclear Re species under reaction conditions. Adapted with permission from ref (250). Copyright 2007 American Chemical Society.
Figure 46
Figure 46
Activity and stability of Pt nanoclusters confined in carbon nanotubes (Pt@CNT) in comparison with Pt nanoclusters exposed on open surfaces of the carbon nanotubes exterior walls and carbon black (Pt/CNT and Pt/CB): (a) toluene conversion as a function of reaction temperatures; and (b) the stability test. Adapted with permission from ref (252). Copyright 2015 American Chemical Society.
Figure 47
Figure 47
Catalytic performances of size-selected Au clusters deposited on Al2O3 for epoxidation of propene. (a) Turnover frequency based on the formation of propene oxide as a function of reaction temperature (left) and time on stream at 200 °C (right) for various compositions of feed gas. (b) Turnover frequency based on the formation of acrolein as a function of temperature (left) and time on stream at 200 °C (right) for various compositions of feed gas. (c) Temperature-dependent ratio of propene oxide to acrolein. ■, C3H6/O2; ●, C3H6/O2/H2; ▲, C3H6/O2/H2O. Adapted with permission from ref (254). Copyright 2009 Wiley-VCH Verlag GmbH & Co. KGaA, Weinheim.
Figure 48
Figure 48
(A) Reaction rate of oxidation of propene to propene oxide (PO), acrolein (Acr), and CO2 on Ag3 clusters. (B) Selectivity toward different products at different temperature on Ag3 clusters supported on Al2O3. (C) Reaction rate of oxidation of propene to propene oxide (PO), acrolein (Acr), and CO2 on Ag nanoparticles (∼3.5 nm). (D) Selectivity toward different products at different temperature on Ag3 clusters supported on Al2O3. (E) Reaction mechanism of oxidation of propene to propene oxide catalyzed by Ag3 clusters based on DFT calculations. Adapted with permission from ref (256). Copyright 2010 The American Association for the Advancement of Science.
Figure 49
Figure 49
(a) TOF of hydrogenation of ethylene to ethane on Pt clusters with different atomicity at 300 K. The blue plots correspond to the TOF values measured for the fresh samples, and the red plots correspond to the TOF values measured after exposure to reaction gas at 400 K and then cooling to 300 K. (b) CO-IR spectra of Pt clusters and Pt(111) surface after hydrogenation of ethylene at 300 K (blue) and after exposure to reaction gas at 400 K and then cooling to 300 K (red). Adapted with permission from ref (262). Copyright 2016 Macmillan Publishers Limited, part of Springer Nature.
Figure 50
Figure 50
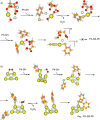
Proposed mechanism for selective hydrogenation of terminal alkynes to alkenes by the protected Au25 clusters. Left panel: Au25(SR)18 cluster. Right panel: Au25(PPh3)10(C≡CPh)5X2 (X = Cl, Br) cluster. The models of these two protected Au clusters are presented according to their crystal structure. Color code: Au, green; S, yellow; C, gray; P, pink; X, cyan. Hydrogen atoms are not shown. The areas marked with organic lines are the Au3 active sites (left panel) and the waist active sites (right panel) for the selective hydrogenation of alkyne, respectively. Adapted with permission from ref (274). Copyright 2014 American Chemical Society.
Figure 51
Figure 51
Schematic illustration of mononuclear Ir and Ir4 clusters supported on MgO and DAY Zeolite. The relative activities for ethene hydrogenation are also presented. Adapted with permission from ref (279). Copyright 2011 American Chemical Society.
Figure 52
Figure 52
(a) Tetrahedral Ir4 clusters stabilized by calixarene-phosphine ligands. Nine CO ligands are at first attached to the Ir4 clusters. The CO ligands attached to the basal-plane Ir atoms can be removed with a thermal or gas-flowing treatment, creating “CO vacancy” sites that can take up new CO molecules, but prevent ethylene adsorption. Alternatively, the CO ligands attached to the apical Ir atom can be removed by reactive decarbonylation, creating a CO vacancy site that can bind both CO and ethylene. (b,c) Molecular graphics: Lowest free-energy structures of ethylene bonded to apical (b) and basal-plane (c) Ir atoms, in the calixarene-phosphine capped Ir4 cluster. Adapted with permission from ref (280). Copyright 2014 Macmillan Publishers Limited, part of Springer Nature.
Figure 53
Figure 53
(a) Encapsulation of subnanometric Pt species in MCM-22 zeolite during the transformation of two-dimensional zeolite into three-dimensional. (b) High-resolution STEM images of Pt@MCM-22 catalyst, showing the presence of subnanometric Pt species (including Pt single atoms and Pt clusters). (c) Catalytic activity of Pt@MCM-22 and Pt/MCM-22-imp for hydrogenation of propene. (d) Catalytic activity of Pt@MCM-22 and Pt/MCM-22-imp for hydrogenation of isobutene. Adapted with permission from ref (282). Copyright 2017 Macmillan Publishers Limited, part of Springer Nature.
Figure 54
Figure 54
Single-step hydrogenation of some organic compounds using bimetallic cluster catalysts (Cu4Ru12C2, in this case) supported on mesoporous solid carriers. Adapted with permission from ref (283). Copyright 2003 American Chemical Society.
Figure 55
Figure 55
Catalytic performance for Fischer–Tropsch synthesis on Co4 and Co27 clusters supported on various supports. Co4±1/Al2O3, Co27±5/Al2O3, Co27±5/MgO, and Co27±5/UNCD at 225 °C (feed compostion, H2:CO:He = 1:0.5:98.5, pH2 = 0.01 bar, pCO = 0.005 bar). (a) Relative activity of different catalysts with respect to methane produced on the Co4±1/Al2O3 sample. (b) Selectivity to methane and higher hydrocarbons. In this case, only methane and C4–8 are considered for calculating the selectivity. The reactivity of various cluster catalysts is normalized by the number of total deposited Co atoms. Adapted with permission from ref (291). Copyright 2015 American Chemical Society.
Figure 56
Figure 56
Catalytic performances of Pt-based and VOx/Al2O3 catalysts for oxidative dehydrogenation of propane to propene. (a–c) Selectivity to different products by the Pt8–10 clusters deposited on various supports catalysts at different temperatures: (a) Pt clusters on SnO/Al2O3 at 400 °C, (b) SnO/Al2O3 at 500 °C, and (c) Al2O3 at 550 °C. (d) TOFs of propene produced on the Pt8–10 catalysts (green) and conventional VOx/Al2O3 and Pt/monolith catalysts for oxidative dehydrogenation of propane to propene. The TOF values have already been normalized to single metal atoms in all catalysts. Adapted with permission from ref (300). Copyright 2009 Macmillan Publishers Limited, part of Springer Nature.
Figure 57
Figure 57
Temperature programed reaction (TPR) profiles of the reaction products 13CO2 and 15N2 as a function of cluster size. The Pd clusters were deposited on a clean MgO film and then were first exposed to 13CO and then to 15NO at 90 K. The activity of various Pd clusters for 13CO2 and 15N2 expressed as the number of product molecules formed per cluster and normalized to the reactivity of Pd30 are presented. Adapted with permission from ref (304). Copyright 2004 American Chemical Society.
Figure 58
Figure 58
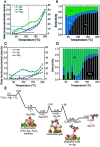
(a) Increment of NO conversion for C3H8-SCR with 0.5% H2 at 573 K as compared to the activity obtained in the absence of H2 as a function of adsorption heat of NH3 on H-form zeolites (○). The bars represent the intensity of UV–vis bands corresponding to different types of Ag species: 212 nm (Ag+, white bar), 260 nm (Agnδ+ cluster, gray bar), and 312 nm (metallic Agm cluster, black bar) under C3H8-SCR with 0.5% H2. Those intensity values have already been normalized to those bands obtained on the same catalyst under similar reaction conditions but in the absence of H2. (b) Schematic diagram of the evolution of Ag species, depending on the acidity of zeolite support and the reaction atmosphere. (OZ) represents the zeolite ion-exchange site in this figure. Adapted with permission from ref (310). Copyright 2005 Springer, Inc.
Figure 59
Figure 59
(a) Influences of Pt particle size on photocatalytic activity of the CdS nanorods with size-selected Pt clusters as cocatalysts. The average H2 evolution rate as well as the quantum efficiency clearly change with the size of Pt clusters. (b) Schematic illustration of the generation of electrons and holes in CdS after excitation by light. The photogenerated electrons will transfer to Pt clusters and then catalyze the reduction of protons for the evolution of H2. Adapted with permission from ref (313). Copyright 2012 American Chemical Society.
Figure 60
Figure 60
(a) Schematic illustration of the H2 evolution and the H2 oxidation by O2 on PtO clusters and metallic Pt nanoparticles, respectively. (b) Evolution of the amount of H2 and O2 on PtO/TiO2 and Pt/TiO2 photocatalysts under ultraviolet–visible light irradiation (>300 nm). In a typical experiment, 2 mL of H2 and 1 mL of O2 were injected into the reaction cell for photocatalytic water splitting at time zero. Adapted with permission from ref (316). Copyright 2013 Macmillan Publishers Limited, part of Springer Nature.
Figure 61
Figure 61
(A) Comparison of catalytic activity of different types of Au clusters for selective oxidation of methyl phenyl sulfide to sulfoxide under visible light (532 nm). (B) Photocatalytic oxidation of benzylamine to imine in the presence of O2 and Au38S2(SAdm)20 clusters under LED irradiation (455 nm) at 30 °C. (C) Illustration of Dexter-type electron exchange coupling between Au38 cluster and O2 for the generation of singlet O2. (D) Schematic illustration of conversion of 3O2 to 1O2 on Au38S2(SAdm)20 clusters under light irradiation. Adapted with permission from ref (318). Copyright 2017 American Chemical Society.
Figure 62
Figure 62
(a) Binding energy of Pt 4d3/2 in XPS spectra of Pt clusters with various sizes. (b) The electrocatalytic activity of Pt clusters with different atomicity for ethanol oxidation reaction (EOR). Red plot, first oxidation peak; green plot, second oxidation peak; blue plot, reactivation peak. Higher peak current corresponds to higher activity in EOR. Adapted with permission from ref (320). Copyright 2016 American Chemical Society.
Figure 63
Figure 63
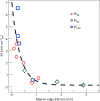
Relationship between specific activity (determined at 0.85 V) and edge-to-edge distance for Pt20, Pt46, and Pt>46 clusters. The activity is plotted versus the average nearest edge-to-edge distance calculated from the nanocluster density assuming a random nanocluster distribution on the glassy carbon surface. Adapted with permission from ref (323). Copyright 2013 Macmillan Publishers Limited, part of Springer Nature.
Figure 64
Figure 64
ORR activity of Pt clusters with different atomicity. These Pt clusters are prepared using dendrimer as template, and their atomicity can be tuned with high precision. Adapted with permission from ref (326). Copyright 2015 Wiley-VCH Verlag GmbH & Co. KGaA, Weinheim.
Figure 65
Figure 65
Comparison between the classic mechanism of Suzuki–Miyaura reaction and the newly proposed mechanism with Pd3Cl clusters. Adapted with permission from ref (346). Copyright 2017 American Chemical Society.
Figure 66
Figure 66
Plausible evolution of the palladium species transformation under reaction conditions (L, ligand; S, solvent; X, heteroatom). Adapted with permission from ref (347). Copyright 2013 American Chemical Society.
Figure 67
Figure 67
Conversion of CS2 into CO2 in HNO3 by Pd complex at room temperature. (a) The transformation of mononuclear Pd precatalyst under reaction conditions is described. Trinuclear Pd clusters are the key active species for the conversion of CS2 to CO2. Notably, attempts to make the reaction working in HNO3 aqueous were not successful. (b) Change of the CO2 concentration and the pH values of the reaction solution with reaction time. (c) Overall reaction of the conversion of CS2 to CO2 in HNO3. Adapted with permission from ref (349). Copyright 2017 Macmillan Publishers Limited, part of Springer Nature.
Figure 68
Figure 68
Ester-assisted hydration of alkyne by in situ formed Au clusters. (A) Scheme for the reaction. (B) Conversion for ester-assisted hydration of alkyne promoted by AuCl (squares) and HAuCl4 (diamonds) at 100 ppm, after correction with the blank experiment. (C) Turnover number (TON) and turnover frequency (TOF) for different amounts of AuCl, calculated as moles of product formed per mole of AuCl at final conversion (TON) and as the initial reaction rate after the induction time per mole of AuCl (TOF). (D) UV–vis spectra of the reaction mixture for the hydration of alkyne containing the Au active species along the induction time (curve A) and when the reaction proceeds (curve B) with the corresponding fluorescence spectrum (inset, irradiated at 349 nm). Adapted with permission from ref (350). Copyright 2012 The American Association for the Advancement of Science.
Figure 69
Figure 69
(A) Cyclooctene conversion with reaction time using different catalysts or without addition of Au catalyst. Au/SiO2-A (a, ■), 6 mg AuCl (b, ▲), 7 mg AuCl3 (c, ●), or no Au (d, ◆). (B) TEM images of filtrate solution from Au/SiO2-A collected after conversion reached 18%. Au single atoms as well as subnanometric Au clusters are observed. Adapted with permission from ref (356). Copyright 2017 Macmillan Publishers Limited, part of Springer Nature.
Figure 70
Figure 70
(a) Scheme of the C–N coupling reaction. (b) Kinetic results for the cross-coupling reaction between iodobenzene and amide catalyzed by commercially available 0.5 mol % of Cu compounds: Cu(OAc)2 (blue ◆), CuO nanoparticles of ∼50 nm (red ■), Cu(acac)2 (orange ●), and CuI (green ▲). The inset shows a magnification of the initial stage of the curves, where an induction period of ∼1 h can be observed for all of the Cu catalysts tested. (c) Left: Initial stage of the kinetic curves for the C–N cross coupling reaction in the presence of 0.05 mol % of Cu clusters. Right: Linear correlation between the initial reaction rate for the Goldberg reaction and the amount of Cu clusters containing ethylene-vinyl alcohol copolymer (EVOH) polymer (Cu@EVOH) used as a catalyst. No induction time was found in any case. Adapted with permission from ref (361). Copyright 2015 American Chemical Society.
Figure 71
Figure 71
Possible pathways for the hydrosilylation of alkynes to obtain β-vinylsilanes (left) and α-vinylsilanes (right) through both Chalk–Harrod and modified Chalk–Harrod mechanism. Adapted with permission from ref (362). Copyright 2017 Wiley-VCH Verlag GmbH & Co. KGaA, Weinheim.
Figure 72
Figure 72
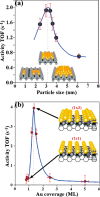
Catalytic activity for CO oxidation of different Au structures from single-layer to bilayer Au films and nanoparticles to three-dimensional hemispherical Au nanoparticles. (a) Influences of particle size on CO oxidation activity of Au supported on the TiO2(110) at 353 K. (b) Influences of Au coverage on Au films supported on the Mo-(112)-(8×2)-TiOx at room temperature. Adapted with permission from ref (367). Copyright 2006 American Chemical Society.
Figure 73
Figure 73
Calculated number of sites with a particular geometry (surface and perimeter or corner atoms in contact with the support) as a function of diameter and TOF at 80 °C of the nine ceria-based samples. Adapted with permission from ref (381). Copyright 2013 The American Association for the Advancement of Science.
Figure 74
Figure 74
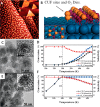
(A) STM image of 0.25 monolayer of FeO deposited on Pt(111). The inset image is a high-resolution STM image on the FeO monolayer nanoislands. (B) Schematic illustration of the coordinated-unsaturated ferrous (CUF) sites at the FeO–Pt interface and the transition states of O2 dissociation at the CUF sites according to DFT calculations. (C) TEM images of Pt/SiO2 catalyst and (D) its catalytic performance in CO-PROX reaction. (E) TEM images of bimetallic Pt–Fe/SiO2 catalyst and (F) its catalytic performance in CO-PROX reaction. Adapted with permission from ref (382). Copyright 2010 The American Association for the Advancement of Science.
Figure 75
Figure 75
Scanning electron microscopy images of various Ag nanostructures. (a) Ag nanocubes (90 nm) deposited on Si water, (b) Ag nanocubes (90 nm) deposited on alumina support, (c) Ag nanowires (125 nm) deposited on Si water, (d) Ag nanowires (125 nm) deposited on alumina support, (e) Ag nanocubes (90 nm) after 48 h on stream under epoxidation reaction conditions, and (f) Ag nanowires (125 nm) after 48 h on stream under epoxidation reaction conditions. (g) Selectivity to ethylene oxide at different O2 partial pressure for Ag nanocubes, nanowires, and spherical nanoparticles of different edge lengths and diameters. (h) Selectivity to ethylene oxide as a function of L–1 (inverse characteristic length) for Ag nanocubes, nanowires, and spherical Ag nanoparticles. Adapted with permission from ref (388). Copyright 2010 Wiley-VCH Verlag GmbH & Co. KGaA, Weinheim.
Figure 76
Figure 76
Dependence of turnover frequency on the mean size of Pd nanoparticles for the selective oxidation of benzyl alcohol. The TOF values for oxidation of benzyl alcohol to benzyl aldehyde from three different supported Pd catalysts are presented. Adapted with permission from ref (391). Copyright 2011 The Royal Society of Chemistry.
Figure 77
Figure 77
(a) Models of different Pt nanoparticles with similar particle size (∼0.8 nm for S1 and ∼1 nm for S2, S3, and S4) but different geometric shapes. The geometric shapes of different Pt/γ-Al2O3 samples (S1 to S4) were obtained on the basis of the fitting of EXAFS data as well as with the TEM measurements. The geometric shapes that give the best fitting results are shown in the left column. The color coding indicates the different number of first nearest neighbors (N1) of surface atoms in each Pt nanoparticle. (b) Catalytic activity for oxidation of 2-propanol to acetone by Pt/γ-Al2O3 samples measured in a packed-bed mass flow reactor by mass spectrometry. Adapted with permission from ref (395). Copyright 2010 American Chemical Society.
Figure 78
Figure 78
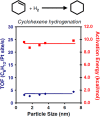
Turnover rate and activation energy over Pt nanoparticles as a function of particle size in cyclohexene hydrogenation to cyclohexane. Adapted with permission from ref (405). Copyright 2008 Springer.
Figure 79
Figure 79
Hydrogenation of pyrrole by Pt nanoparticles with different particle size. The distributions of hydrogenation products are presented. Adapted with permission from ref (408). Copyright 2008 American Chemical Society.
Figure 80
Figure 80
Morphology of Pt cuboctahedras and cubes and their catalytic performance for benzene hydrogenation. As it can be seen, only cyclohexane can be observed on Pt cubes, while both cyclohexane and cyclohexene can be observed on Pt cuboctahedras. Adapted with permission from ref (413). Copyright 2007 American Chemical Society.
Figure 81
Figure 81
Introduction of metal–ligand interaction to modulate the chemoselectivity of metal nanoparticles for selective hydrogenation reactions. (a) Surface modification with cinchona alkaloids on Pt surface to enhance the enantioselectivity for hydrogenation of C = O bonds. (b) Surface modification of Pd surface with thiol ligands to modulate the selectivity for hydrogenation of epoxybutene to epoxybutane. (c) Surface modification of PtCo bimetallic nanoparticles with amine ligands for selectivity hydrogenation of conjugated unsaturated aldehyde to corresponding unsaturated alcohol. Adapted with permission from ref (415). Copyright 2017 American Chemical Society.
Figure 82
Figure 82
(a) Schematic illustration and corresponding DFT calculations of isomerization of trans-2-butene and cis-2-butene on Pt(111) surface. (b) Morphologies of three Pt/SiO2 catalysts after calcination at different temperatures. The starting material consisted of Pt tetrahedras, with four (111) facets exposed. To remove the polymer capping agent, those Pt tetrahedras were calcined in air at 475, 525, and 575 K, followed by a reduction treatment with H2. As a result of such oxidation–reduction treatment, the shape of Pt nanoparticles would change from tetrahedral to spherical shape stepwisely. (c) Corresponding kinetic data for the isomerization of cis- and trans-2-butene promoted by the Pt/SiO2 catalyts with different shapes. The reaction conditions are also included. Adapted with permission from ref (422). Copyright 2009 Macmillan Publishers Limited, part of Springer Nature.
Figure 83
Figure 83
Influence of particle morphology and chemical compositions on the activity of Pt and Pt3Ni for oxygen reduction reaction (ORR). Adapted with permission from ref (424). Copyright 2016 Macmillan Publishers Limited, part of Springer Nature.
Figure 84
Figure 84
(a–g) Structural characterizations and determination of icosahedral Pt3Ni nanocrystals. (h) Activity of icosahedral and octahedral Pt3Ni nanocrystals as well as commercial Pt/C for oxygen reduction reaction. (i) Theoretical modeling of surface strain of icosahedral and octahedral Pt3Ni nanocrystals. Adapted with permission from ref (431). Copyright 2012 American Chemical Society.
Figure 85
Figure 85
(a) Faradaic current densities at E = −1.2 V vs RHE on Au nanoparticles with different particle size. (b) Particle size dependence of the composition of gaseous products during electrocatalytic CO2 reduction over Au nanoparticles. (c) Faradaic selectivity toward H2 and CO as a function of size of Au nanoparticles in KHCO3 solution (0.1 M) at E = −1.2 V vs RHE. (d) Ratio of gaseous CO/H2 produced at E = −1.2 V vs RHE as a function of particle size of Au nanoparticles. Adapted with permission from ref (438). Copyright 2014 American Chemical Society.
Figure 86
Figure 86
(a) Reaction scheme of aerobic dehydrogenation of cyclohexanone to cyclohexenone and then to phenol by Pd catalyst. (b) Kinetic results for the transformation from cyclohexanone to cyclohexanone (blue) and from cyclohexanone to phenol (red). (c) Summary of the evolution of Pd species under reaction conditions and their activity in the above two steps. Adapted with permission from ref (454). Copyright 2013 American Chemical Society.
Figure 87
Figure 87
Schematic illustration of bimetallic nanoparticles with different types of spatial distributions of two elements. (a) Random alloyed, (b) intermetallic, (c) core–shell, and (d) heterojunction nanoparticles. Adapted with permission from ref (462). Copyright 2008 American Chemical Society.
Figure 88
Figure 88
Selectivities to trans-alkenes during cis-stilbene and cis-methylstyrene isomerizations catalyzed by various Rh- and Ru-based intermetallic compounds and monometallic Rh supported on SiO2. The reaction was performed under atmospheric pressure of H2. Adapted with permission from ref (467). Copyright 2015 Wiley-VCH Verlag GmbH & Co. KGaA, Weinheim.
Figure 89
Figure 89
TEM micrographs and chemical analysis of nanoporous Au. (a,b) Low-magnification TEM image and the corresponding 3D tomographic reconstruction of nanoporous Au. (c) HAADF image of a gold ligament and the corresponding elemental mapping of Au (d) and Ag (e) in this area. (f) Line profile across the ligament, showing the relative amounts of Au and Ag in this area. Adapted with permission from ref (481). Copyright 2012 Macmillan Publishers Limited, part of Springer Nature.
Figure 90
Figure 90
(a,b) Oxidative coupling of methanol and ethanol on Au(111) surface in UHV and on nanoporous Au in a fixed-bed flow reactor at atmosphere pressure. (c,d) Oxidative coupling of allylic alcohol and methanol on Au(111) surface in UHV and on nanoporous Au in a fixed-bed flow reactor at atmosphere pressure. Adapted with permission from ref (484). Copyright 2016 American Chemical Society.
Figure 91
Figure 91
(a) Temporal oscillations of the production rate of CO2 on Pt(110) surface at 470 K with a CO pressure of 3 × 10⁻⁵ mbar. (b) Surface reconstruction of Pt(110) surface between 1×1 and 1×2 structure under different CO coverage. Adapted with permission from ref (499). Copyright 2008 Wiley-VCH Verlag GmbH & Co. KGaA, Weinheim.
Figure 92
Figure 92
Visualization of the dynamic refacetting process of a Pt nanoparticle during the oscillatory CO oxidation at atomic scale by in situ high-resolution TEM. The TEM images show the more spherical shape (a,c,e, corresponding to lower CO conversion) and the more faceted shape (b,d, corresponding to higher CO conversion) during the oscillatory reaction. Adapted with permission from ref (498). Copyright 2014 Macmillan Publishers Limited, part of Springer Nature.
Figure 93
Figure 93
(a) High-resolution STEM image of PtNi bimetallic octahedral nanoparticle. The step sites on the surface of this particle are indicated by white arrows. Furthermore, local enrichment of Ni can also be found in this particle, suggesting the inhomogeneous distribution of Pt and Ni elements. (b,c) Elemental linescan of Pt and Ni and the corresponding schematic illustration of a PtNi bimetallic octahedral nanoparticle, showing the partially separation of Ni and Pt in a single nanocrystal. (d,e) High-resolution STEM image a typical Pd/C catalyst with a Pd loading of 5 wt % prepared by conventional wet impregnation. It can be clearly seen that Pd nanoparticles with irregular shapes are present in this sample. Those Pd nanoparticles show spherical shapes, with a large number of coordination unsaturated surface sites. Besides, some single Pd atoms also appear in this Pd/C catalyst. (a–c) Adapted with permission from ref (504). Copyright 2013 Macmillan Publishers Limited, part of Springer Nature. (d,e) Adapted with permission from ref (508). Copyright 2014 Wiley-VCH Verlag GmbH & Co. KGaA, Weinheim.
Figure 94
Figure 94
(a–h) High-resolution STEM images of various Au/CeO2 and (i–l) corresponding schematic illustration of different types of Au species supported on CeO2. (m) CO oxidation activity of various Au/CeO2 catalysts. (n) Arrhenius plots of CO reaction rates of Au/CeO2 catalysts with different types of Au species. IA/ceria, atomically dispersed Au; MO/ceria, single-layer Au; MU/ceria, multilayer Au; NP/ceria, Au nanoparticles. Adapted with permission from ref (512). Copyright 2015 American Chemical Society.
Figure 95
Figure 95
(a–c) High-resolution STEM images of single Au atoms, Au clusters, and nanoparticles supported on CeO2 nanorods, respectively. (d) Reaction rates of three Au/CeO2 samples for CO oxidation at room temperature. (e) Au oxidation state and (f) coordination number of Au–O/Au–Au as a function of reaction time, measured by XANES and EXAFS, respectively. (g) Schematic illustration of different types of Au species supported on CeO2. In the case of Au single atoms, they exist as cationic Au ions. Au clusters exist as a mixture of metallic Au and cationic Au, and Au nanoparticles show metallic state. Adapted with permission from ref (513). Copyright 2016 Macmillan Publishers Limited, part of Springer Nature.
Figure 96
Figure 96
(a) High-resolution STEM image of 2%Au/α-MoC sample, showing the presence of both Au nanoparticles (∼2 nm) and individual Au atoms. (b) High-resolution STEM image of 0.9%Au/α-MoC sample obtained by the NaCN leaching treatment on 2%Au/α-MoC sample. In this sample, only isolated Au atoms are observed. (c) Catalytic performance of different Au catalysts and the α-MoC support for water–gas shift reaction. Reaction condition: 10.5% CO, 21% H2O, 20% N2 in Ar; GHSV, 180 000 h–1. Adapted with permission from ref (516). Copyright 2017 The American Association for the Advancement of Science.
Figure 97
Figure 97
Relationships between the size of Au and the activity in the selective oxidation of cyclohexene into cyclohexenyl hydroperoxide. Adapted with permission from ref (519). Copyright 2013 American Chemical Society.
Figure 98
Figure 98
(a) Oxidative coupling of dimethyl phthalate with different Au catalysts. (b) STEM images of Au/Co3O4 catalyst (b) and Au(OAc)3+Co3O4 (c) after the coupling of dimethyl phthalate. Adapted with permission from ref (522). Copyright 2015 Wiley-VCH Verlag GmbH & Co. KGaA, Weinheim.
Figure 99
Figure 99
Oxidative coupling of phenylacetylene using mononuclear Cu(Ac)2 or bulk CuCl as the starting catalyst. These Cu compounds would transform into monodispersed CuOx nanoparticles (∼2 nm) under reaction conditions, which serve as the active species. Besides, small CuOx nanoparticles (∼2 nm) would further grow into large CuOx nanoparticles when a large amount of Cu catalyst is introduced into the reaction mixture. Larger CuOx nanoparticles can transform back to small CuOx nanoparticles under suitable reaction conditions. Adapted with permission from ref (524). Copyright 2016 American Chemical Society.
Figure 100
Figure 100
(a) Reaction scheme for the oxidative coupling of phenylacetylene with supported CuOx/TiO2 catalysts. (b) Initial reaction rates of CuOx/TiO2 catalysts with different Cu loading for oxidative coupling of phenylacetylene. (c) STEM image of CuOx/TiO2 sample with CuOx nanoparticles of ∼2 nm. (d) Schematic illustration of the proposed mechanism on CuOx/TiO2 sample with CuOx nanoparticles of ∼2 nm for oxidative coupling of phenylacetlyene. O2 molecules are activated through the formation of peroxides. (e) Schematic illustration of the proposed mechanism on CuOx/TiO2 sample with CuOx nanoparticles of 5–10 nm for oxidative coupling of phenylacetlyene. Adapted with permission from ref (524). Copyright 2016 American Chemical Society.
Figure 101
Figure 101
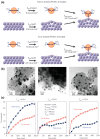
(a) Oxidation of thiophenol to disulfide in the presence of O2 by Au catalysts. Single isolated gold atoms (sample A) are not active in the oxidation of thiophenol during the induction period of 6 min, which indicates that other types of Au species are being formed under reaction conditions. The evolution of the gold species was followed by stopping the reaction at different times. The catalyst (named as samples B, C, and D taken at 6, 12, and 120 min, respectively, during the reaction of sample A) were isolated from the reaction mixture and used to carry out a new reaction under the same conditions. The yields of disulfide with reaction time using samples A, B, C, and D as catalyst are shown. Inset shows the kinetic curve of sample A at the beginning of the reaction. (b–g) Evolution of the gold species present on the catalyst studied by high-resolution STEM. (b) Isolated gold atoms present on the as-prepared catalyst. (c) Catalyst taken after reaction for 6 min shows the presence of small clusters with 4–13 atoms. (d,e) Two different images of sample C taken at 12 min in which both small clusters and some Au nanoparticles can be observed. (f) In sample D, taken after 120 min of reaction, most of the gold aggregated into nanoparticles larger than 2 nm. (g) Size distribution of the Au species in samples A, B, and C. Adapted with permission from ref (525). Copyright 2013 Macmillan Publishers Limited, part of Springer Nature.
Figure 102
Figure 102
Structures involved in the mechanism of thiol oxidation catalyzed by (a) AuI species and (b) Au5 cluster. Au, S, C, O, and H atoms are depicted in gold, yellow, orange, red, and white, respectively. Adapted with permission from ref (525). Copyright 2014 American Chemical Society.
Figure 103
Figure 103
Evolution of mononuclear Rh complex supported on HY zeolite during the catalytic hydrogenation of ethylene and ethylene dimerization. In the presence of H2, Rh atoms will agglomerate gradually into Rh clusters. The activity toward hydrogenation of ethylene and selectivity toward ethylene dimerization will also change with the atomicity of Rh species. Adapted with permission from ref (526). Copyright 2016 American Chemical Society.
Figure 104
Figure 104
High-resolution STEM images of Pt single atoms (a) and Pt nanoparticles (b) before the hydrogenation reaction. Catalytic activity expressed as yield of p-chloroaniline after hydrogenation of p-chloronitrobenzene per Pt specie (c) and per Pt atom (d). (e–h) High-resolution STEM images of Pt single atoms and Pt nanoparticles after the hydrogenatrion of p-chloronitrobenzene. Adapted with permission from ref (528). Copyright 2017 American Chemical Society.
Figure 105
Figure 105
Particle size effect on catalytic properties of Pt nanoparticles for cyclohexene dehydrogenation to benzene. Adapted with permission from ref (531). Copyright 2008 Springer.
Figure 106
Figure 106
Reaction scheme for Au-catalyzed Sonagashira reaction (product DPA) including the illustration for activation of iodobenzene and phenylacetylene. The competitive homocoupling reactions of phenylacetylene (product DPDA) and iodobenzene (product BP) are also described. Adapted with permission from ref (537). Copyright 2012 American Chemical Society.
Figure 107
Figure 107
Mechanistic proposal for the Sonogashira coupling with Au clusters and Au Nanoparticles as bifunctional catalyst. Adapted with permission from ref (541). Copyright 2017 Wiley-VCH Verlag GmbH & Co. KGaA, Weinheim.
Figure 108
Figure 108
(a) Yield–time profile for the hydroamination of o-(phenylacetylen)aniline catalyzed by PtCl2. The photograph on the left shows the precipitate of PtCl2 in toluene under reaction conditions, and the illustration on the right describes the equilibrium-controlled dissolution of PtCl2 with the substrates under reaction conditions. (b) Schematic illustration using metal-exchanged zeolite as substitute catalysts for hydroamination reactions with high activity. Adapted with permission from ref (547). Copyright 2015 American Chemical Society.
Figure 109
Figure 109
Hydroalkoxylation using surface-oxidized Pt nanoparticles. To obtain electrophilic activity from the Pt nanoparticles, treatment with mild oxidant (PhICl2) was performed. Afterward, the Pt40/G4OH/SBA-15 sample was further reduced under H2 atmosphere at 100 °C for 24 h before being used for catalytic tests. Adapted with permission from ref (548). Copyright 2010 Macmillan Publishers Limited, part of Springer Nature.
Figure 110
Figure 110
Schematic illustration of size-dependent optical properties of Cu clusters and nanoparticles. Estimated wavelengths of the plasmon band for Cu clusters or nanoparticles are shown at the bottom. Adapted with permission from ref (555). Copyright 2009 American Chemical Society.
Figure 111
Figure 111
(a–c) Schematic illustrations and structural characterizations of plasmon-mediated overall water splitting on Au nanorods modified with cocatalysts. (d) Amount of H2 produced on Au nanorods under visible light (>410 nm) irradiation. (e) H2 production rate on Au nanorods under irradiation of light of different wavelength. (f) Measured O2 and H2 photoproducts as a function of time for a second device illuminated by 300 mW/cm2 of white light (AM 1.5). Adapted with permission from ref (560). Copyright 2013 Macmillan Publishers Limited, part of Springer Nature.
Figure 112
Figure 112
(a) Reaction rate for epoxidation of ethylene to ethylene oxide on Ag nanocubes with and without visible light irradiation at 450 K. (b) Isotopic studies on the influences of light intensity for epoxidation of ethylene on Ag nanocubes. (c) Influences of reaction temperature and light intensity on quantum efficiency for epoxidation of ethylene on plasmonic Ag nanocubes. (d) Schematic illustration of single-electron driven and multielectron driven reactions on metal surface under light irradiation. (e) Schematic illustration on the plasmon-mediated electron transfer from Ag to O2. When the rate of plasmon excitation, Δt–1, is lower than the vibrational decay rate of O2, τv–1, the photocatalytic rate is linear with respect to the light intensity. On the other hand, when Δt–1 > τv–1, the photocatalytic rate shifts to a superlinear dependence on light intensity. (f) Formation of a hot spot in a complex structure of Ag nanocubes for activation of O2 under low-intensity visible light irradiation. Adapted with permission from refs (562) and (563). Copyright 2011 and 2012 Macmillan Publishers Limited, part of Springer Nature, respectively.
Figure 113
Figure 113
(a) UV–vis spectra of Cu nanoparticles under different conditions. (b) Selectivity to propene epoxide under photothermal and thermal conditions on Cu nanoparticles. (c) Influences of light irradiation on preferential oxidation of CO in rich H2 on small and big Pt nanoparticles. (d) Normalized quantum yields for CO and H2 oxidation driven by hot electrons after excitation of Pt states with a low intensity laser pulse obtained by theoretical calculations. The physical models of H2 and CO adsorbed on Pt surface are also presented. The shaded regions represent variations in calculated quantum yield due to uncertainty in physical parameters used in the model. (a,b) Adapted with permission from ref (564). Copyright 2013 The American Association for the Advancement of Science. (c,d) Adapted with permission from ref (565). Copyright 2014 American Chemical Society.
Figure 114
Figure 114
(A) High-resolution STEM image of atomically Pt species on S-functionalized carbon. A large number of Pt single atoms as well as a small fraction of Pt clusters can be seen. (B) A schematic illustration of the coordination environment of atomically dispersed Pt species in S-functionalized carbon. (C) Selectivity to H2O2 on three Pt catalysts estimated by rotating ring disk electrode experiments (Pt ring potential: 1.2 VRHE). Pt/ZTC corresponds to Pt nanoparticles (ca. 4 nm) supported on zeolite-templated carbon without the functionalization with S. Pt/LSC corresponds to Pt nanoparticles (ca. 1–2 nm) supported on zeolite-templated carbon with 4 wt % of S. Pt/HSC corresponds to atomically dispersed Pt supported on zeolite-templated carbon with 17 wt % of S. (D) Accumulated H2O2 concentrations with reaction time on three Pt catalysts under short-circuit condition (at V = 0) at room temperature. (E) Proposed catalytic mechanism on atomically dispersed Pt catalysts for oxygen reduction to H2O2. Adapted with permission from ref (572). Copyright 2016 Macmillan Publishers Limited, part of Springer Nature.

References

    1. Boudart M. Catalysis by Supported Metals. Adv. Catal. 1969, 20, 153–166. 10.1016/S0360-0564(08)60271-0. - DOI
    1. Boudart M. Heterogeneous Catalysis by Metals. J. Mol. Catal. 1985, 30, 27–38. 10.1016/0304-5102(85)80014-6. - DOI
    1. Ertl G., Knözinger H., Weitkamp J., Eds. Handbook of Heterogeneous Catalysis; Wiley-VCH: New York, 1997.
    1. Čejka J., Corma A., Zones S., Eds. Zeolites and Catalysis: Synthesis, Reactions and Applications; Wiley-VCH: New York, 2010.
    1. Čejka J., Morris R. E., Nachtigall P., Eds. Zeolites in Catalysis: Properties and Applications; Royal Society of Chemistry: UK, 2017.

Publication types