. 2018 Aug;17(4):e12764.
doi: 10.1111/acel.12764. Epub 2018 Apr 16.

Advanced oxidation protein products induce pre-osteoblast apoptosis through a nicotinamide adenine dinucleotide phosphate oxidase-dependent, mitogen-activated protein kinases-mediated intrinsic apoptosis pathway

Affiliations

Advanced oxidation protein products induce pre-osteoblast apoptosis through a nicotinamide adenine dinucleotide phosphate oxidase-dependent, mitogen-activated protein kinases-mediated intrinsic apoptosis pathway

Si-Yuan Zhu et al. Aging Cell. 2018 Aug.

Abstract

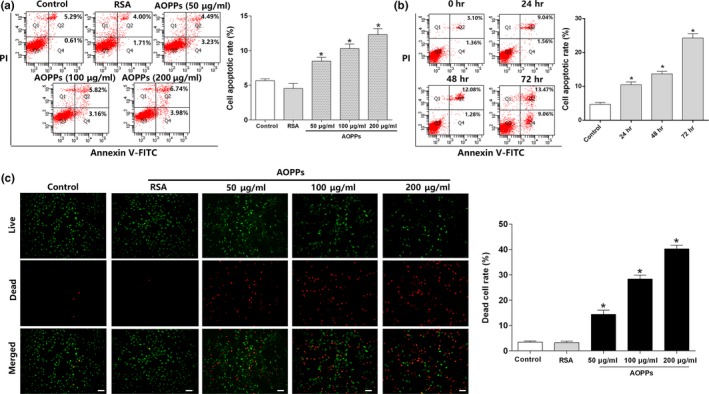
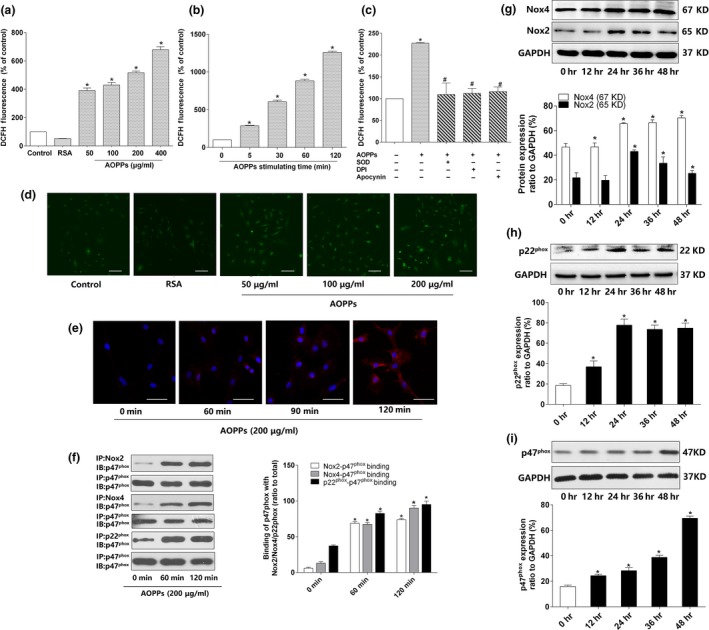
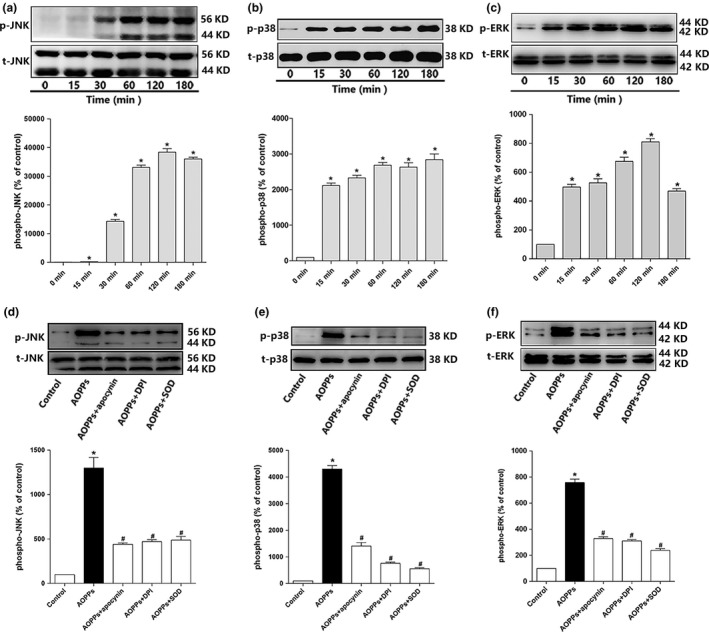
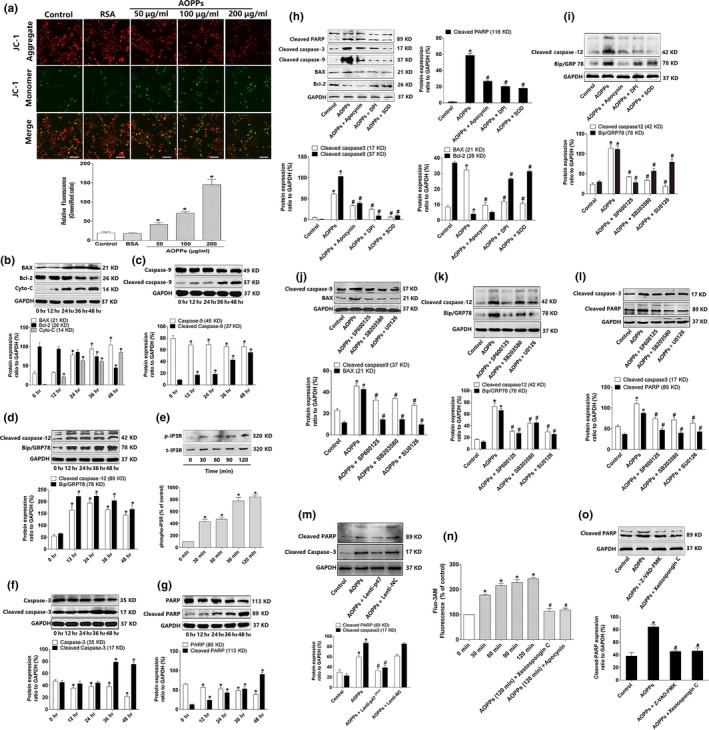
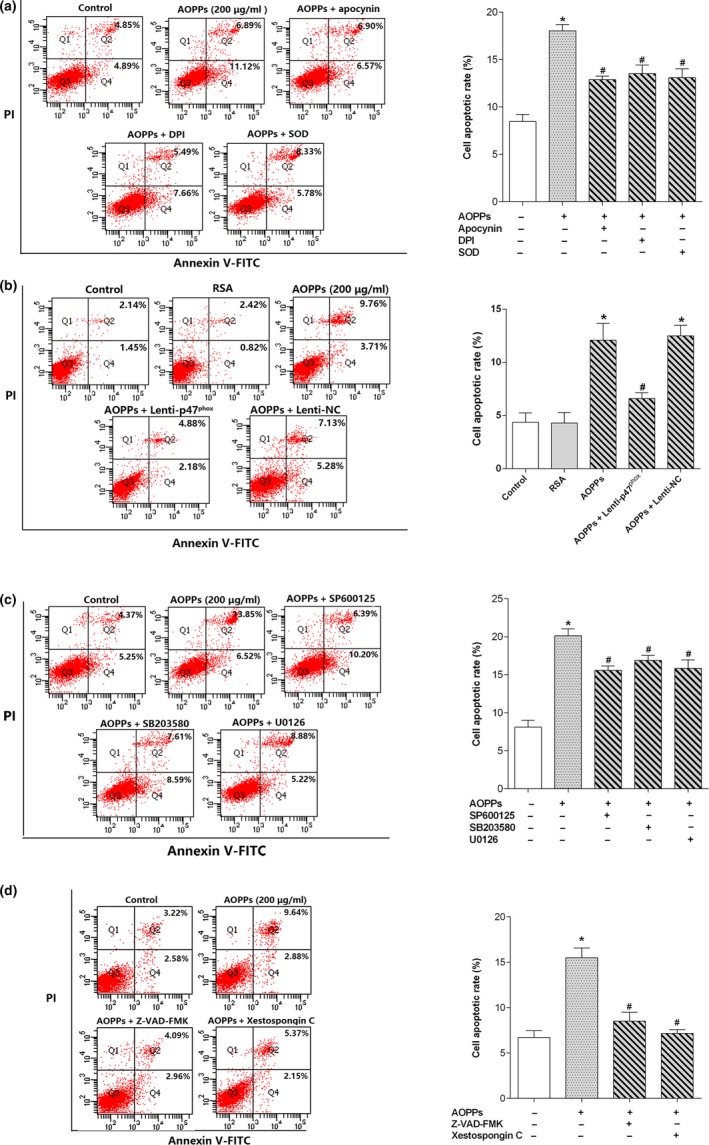
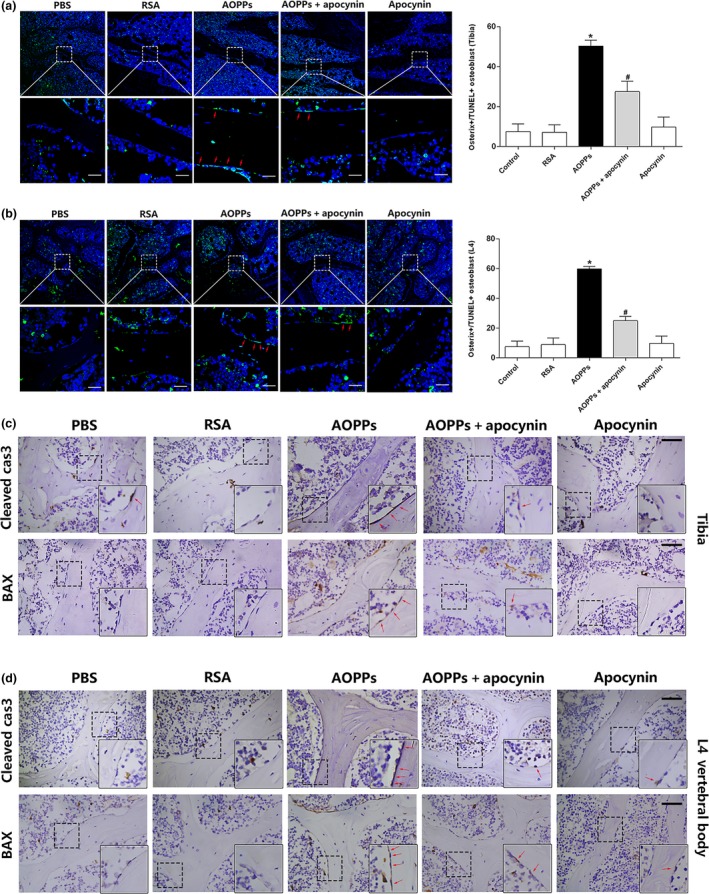
Osteoblast apoptosis contributes to age-related bone loss. Advanced oxidation protein products (AOPPs) are recognized as the markers of oxidative stress and potent inducers of apoptosis. We have demonstrated that AOPP accumulation was correlated with age-related bone loss. However, the effect of AOPPs on the osteoblast apoptosis still remains unknown. Exposure of osteoblastic MC3T3-E1 cells to AOPPs caused the excessive generation of reactive oxygen species (ROS) by activating nicotinamide adenine dinucleotide phosphate (NADPH) oxidases. Increased ROS induced phosphorylation of mitogen-activated protein kinases (MAPKs), which subsequently triggered intrinsic apoptosis pathway by inducing mitochondrial dysfunction, endoplasmic reticulum stress, and Ca2+ overload and eventually leads to apoptosis. Chronic AOPP loading in aged Sprague-Dawley rats induced osteoblast apoptosis and activated NADPH oxidase signaling cascade, in combination with accelerated bone loss and deteriorated bone microstructure. Our study suggests that AOPPs induce osteoblast apoptosis by the NADPH oxidase-dependent, MAPK-mediated intrinsic apoptosis pathway.

Keywords: advanced oxidation protein products; apoptosis; osteoblast; osteoporosis; oxidative stress; reactive oxygen species.


Figures

Figure 1
Figure 1
AOPPs induced apoptosis in MC3T3‐E1 cells. (a,b) Flow cytometry assay using Annexin V‐FITC/PI staining showed that AOPP treatment increased apoptosis in MC3T3‐E1 cells in a dose‐ and time‐dependent manner. Three independent technical replicates for each of the flow cytometry experiment were conducted. (c) Fluorescent microscopy analysis using Live and Dead Assay Stain showed AOPP treatment (0–200 μg/ml) for 24 hr increased apoptosis in MC3T3‐E1 cells in a dose‐dependent manner. Live cells stain green, and dead cells stain red (Scale bar = 100 μm). (d) Flow cytometry analysis of Live and Dead Assay Stain showed that the ratio of dead cells increased with the AOPP concentration. Data were presented as mean ± SD. *p < .05 vs. control
Figure 2
Figure 2
AOPPs increased intracellular ROS generation via the activation of NADPH oxidase. (a) AOPPs (0–400 μg/ml, 120 min) could induce intracellular ROS production in a concentration‐dependent manner. (b) AOPPs (0–120 min, 200 μg/ml) could induce intracellular ROS production in a time‐dependent manner. (c) AOPP‐induced intracellular ROS production was significantly decreased by pretreatment with apocynin (100 μm), DPI (10 μm), and SOD (50 U/ml). (d) Representative confocal microscope images using DCFHDA revealed that AOPPs induced ROS production in MC3T3‐E1 cells in a concentration‐dependent manner (Scale bar = 100 μm). (e) Representative confocal microscope images of AOPP‐induced (200 μg/ml) membrane translocation of p47phox in 120 min (Scale bar = 100 μm). (f) Results of coimmunoprecipitation showed that AOPP treatment (200 μg/ml) enhanced binding of p47phox to Nox2, Nox4, and p22phox in 120 min. (g–i) MC3T3‐E1 cells were incubated with AOPPs (200 μg/ml) for different time periods (0–48 hr). Immunoblotting revealed that NADPH oxidase subunits Nox2, Nox4, p22phox, and p47phox significantly increased compared with control group. Cells in the inhibitor group were pretreated with apocynin, DPI, and SOD, respectively, for 40 min before AOPP administration, and SOD was present during AOPP incubation. Data were presented as mean ± SD. *p < .05 vs. control. #p < .05 vs. AOPP group
Figure 3
Figure 3
AOPPs activated MAPKs by NADPH oxidase‐dependent ROS generation. (a–c) AOPP (200 μg/ml) treatment significantly increased JNK, p38, and ERK1/2 phosphorylation of MC3T3‐E1 cells in 180 min. (d–f) Apocynin (100 μm), DPI (10 μm), and SOD (50 U/ml) significantly blocked AOPP‐induced phosphorylation of JNK, p38, and ERK1/2. Cells in the inhibitor group were pretreated with apocynin, DPI, and SOD, respectively, for 40 min before AOPP administration, and SOD was present during AOPP incubation. Data were presented as mean ± SD. *p < .05 vs. control. #p < .05 vs. AOPP group
Figure 4
Figure 4
AOPPs triggered intrinsic apoptosis pathway by NADPH oxidase‐dependent, MAPK signaling. (a) Confocal microscopy analysis using JC‐1 staining revealed that AOPP challenge for 24 hr decreased the ▵Ψm level of MC3T3‐E1 cells in a dose‐dependent manner (Bar = 100 μm). Numerical data were expressed in terms of the ratio of JC‐1 aggregates to JC‐1 monomers, the increased ration stand for the decreased ▵Ψm. (b–g) AOPP treatment (200 μg/ml) significantly increased the expression of BAX, cytochrome c, cleaved caspase‐9, cleaved caspase‐12, BiP/GRP78, phosphorylated Ca2+ channel IP3R, cleaved caspase‐3, and cleaved PARP, while decreased the expression of Bcl‐2, intact caspase‐9, intact caspase‐3, and intact PARP in 48 hr. (h,i) Pretreated with apocynin (100 μm), DPI (10 μm), and SOD (50 U/ml) significantly decreased AOPP‐induced (200 μg/ml, 48 hr) expression of cleaved caspase‐3, cleaved PARP, cleaved caspase‐9, BAX, cleaved caspase‐12, and BiP/GRP78, while increased the expression National Natural Science Foundation of Bcl‐2. (m) p47phox lentiviral RNAi vector transfection significantly decreased AOPP‐induced expression of cleaved caspase‐3 and cleaved PARP. (j–l) JNK inhibitor SP600125 (10 μm), p38 inhibitor SB203580 (10 μm), and ERK inhibitor U0126 (10 μm) significantly decreased AOPP‐induced (200 μg/ml, 48 hr) expression of cleaved caspase‐9, BAX, cleaved caspase‐12, BiP/GRP78, cleaved caspase‐3, and cleaved PARP. (n) Intracellular calcium level was determined by Fluo‐3/AM. AOPP (200 μg/ml) treatment induced Ca2+ overload in a time‐dependent manner, while this effect could be blocked by IP3R inhibitor Xestospongin C (5 μm) and NADPH oxidase inhibitor apocynin (100 μm). (o) Pretreated with caspase inhibitor Z‐VADFMK (20 μm) and IP3R inhibitor Xestospongin C (5 μm) significantly decreased AOPP‐induced (200 μg/ml, 48 hr) cleaved PARP expression. Cells in the inhibitor group were pretreated with apocynin, DPI, SOD, SP600125, SB203580, U0126, Xestospongin C, and Z‐VADFMK, respectively, for 40 min before AOPP administration, and all of them were present during AOPP incubation. Data were presented as mean ± SD. *p < .05 vs. control. #p < .05 vs. AOPP group
Figure 5
Figure 5
AOPPs induced osteoblast apoptosis through a NADPH oxidase‐dependent, MAPK‐mediated intrinsic apoptosis pathway. (a) Flow cytometry results revealed that AOPP‐induced (200 μg/ml, 24 hr) cell apoptosis could be blocked by preincubating with apocynin (100 μm), DPI (10 μm) and SOD (50 U/ml). (b) Flow cytometry results revealed that p47phox lentiviral RNAi vector transfection markedly decreased AOPP (200 μg/ml, 24 hr)‐induced cell apoptosis. (c) Flow cytometry data indicated that JNK inhibitor SP600125 (10 μm), p38 inhibitor SB203580 (10 μm), and ERK inhibitor U0126 (10 μm) significantly decreased AOPP‐induced (200 μg/ml, 24 hr) cell apoptosis. (d) Flow cytometry results revealed that AOPP‐induced (200 μg/ml, 48 hr) cell apoptosis could be blocked by caspase inhibitor Z‐VADFMK (20 μm) and IP3R inhibitor Xestospongin C (5 μm). Cells in the inhibitor group were pretreated with apocynin, DPI, SOD, SP600125, SB203580, U0126, Xestospongin C, and Z‐VADFMK, respectively, for 40 min before AOPP administration, and all of them were present during AOPP incubation. Three independent technical replicates for each of the flow cytometry experiment were conducted. Data were presented as mean ± SD. *p < .05 vs. control. #p < .05 vs. AOPP group
Figure 6
Figure 6
Chronic AOPP loading‐induced osteoblast apoptosis in aged rats. (a,b) Confocal images showed that AOPPs could induce osteoblast apoptosis both in proximal tibias and L4 vertebral bodies in vivo, whereas the effect could be attenuated by apocynin (TUNEL‐positive cells were marked by a red arrow, scale bar = 20 μm). Data were expressed as a % ratio of TUNEL‐positive cells of various groups and mean ± SD. *p < .05 vs. control; #p < .05 vs. AOPP group. (c,d) Immunohistochemical staining results showed that AOPPs increased apoptosis‐related protein cleaved caspase‐3 and BAX expression in proximal tibias and L4 vertebral bodies at 16 weeks, but were ameliorated by apocynin. Higher magnification of the boxed areas is shown on the bottom to the right, and positive staining is indicated by red arrow (Scale bars represent 50 μm for the main panel)
Figure 7
Figure 7
AOPPs deteriorated bone microstructure and accelerated bone loss in aged rats. (a–d) AOPP challenge decreased the BV/TV (Bone Volume/Total Volume), Tb.N (Trabecular Number), but increased Tb.Sp (Trabecular Spacing) in proximal tibias. (e–h) AOPP challenge decreased the BV/TV (Bone Volume/Total Volume), Tb.N (Trabecular Number) and Tb.Th (Trabecular Thickness), but increased Tb.Sp (Trabecular Spacing) in L4 vertebral bodies. (i,j) Micro‐CT three‐dimensional reconstruction and cross‐sectional images showed that AOPP administration caused a severe deterioration to bone microstructure of proximal tibia and L4 vertebral body. (k,l) AOPP accumulation significantly decreased the trabecular BMD (Bone Mineral Density) of the proximal tibias and L4 vertebral bodies. Data were presented as mean ± SD. *p < .05 vs. control; #p < .05 vs. AOPP group

References

    1. Almeida, M. , & O'Brien, C. A. (2013). Basic biology of skeletal aging: Role of stress response pathways. Journals of Gerontology. Series A, Biological Sciences and Medical Sciences, 68, 1197–1208. 10.1093/gerona/glt079 - DOI - PMC - PubMed
    1. Brown, C. (2017). Osteoporosis: Staying strong. Nature, 550, S15–S17. 10.1038/550s15a - DOI - PubMed
    1. Cagnol, S. , & Chambard, J. C. (2010). ERK and cell death: Mechanisms of ERK‐induced cell death–apoptosis, autophagy and senescence. FEBS Journal, 277, 2–21. 10.1111/j.1742-4658.2009.07366.x - DOI - PubMed
    1. Capeillere‐Blandin, C. , Gausson, V. , Descamps‐Latscha, B. , & Witko‐Sarsat, V. (2004). Biochemical and spectrophotometric significance of advanced oxidized protein products. Biochimica et Biophysica Acta, 1689, 91–102. 10.1016/j.bbadis.2004.02.008 - DOI - PubMed
    1. Chen, J. R. , Lazarenko, O. P. , Blackburn, M. L. , Mercer, K. E. , Badger, T. M. , & Ronis, M. J. (2015). p47phox‐Nox2‐dependent ROS signaling inhibits early bone development in mice but protects against skeletal aging. Journal of Biological Chemistry, 290, 14692–14704. 10.1074/jbc.m114.633461 - DOI - PMC - PubMed

Publication types

Substances

LinkOut - more resources