. 2018 Apr 16;14(4):e1005996.
doi: 10.1371/journal.pcbi.1005996. eCollection 2018 Apr.

Origins of scale invariance in vocalization sequences and speech

Affiliations

Origins of scale invariance in vocalization sequences and speech

Fatemeh Khatami et al. PLoS Comput Biol. .

Abstract

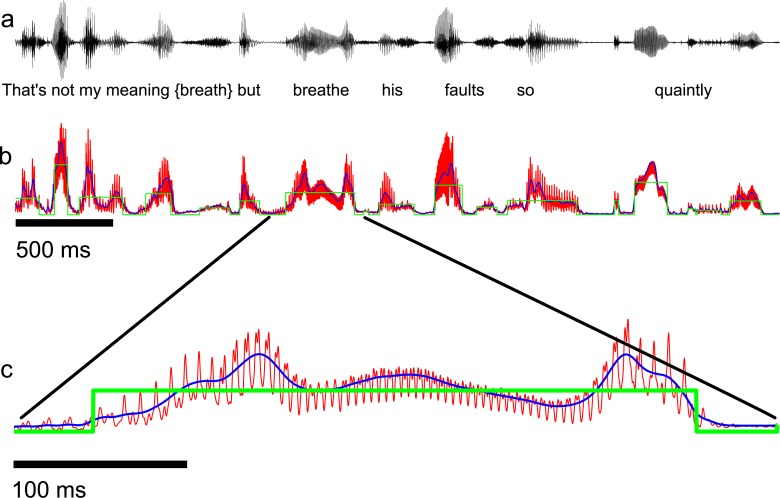
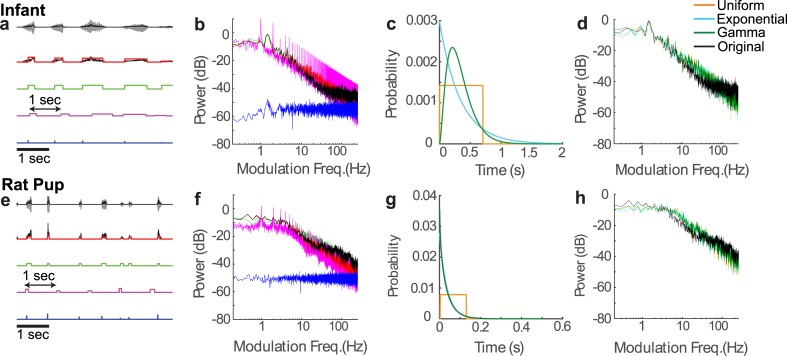
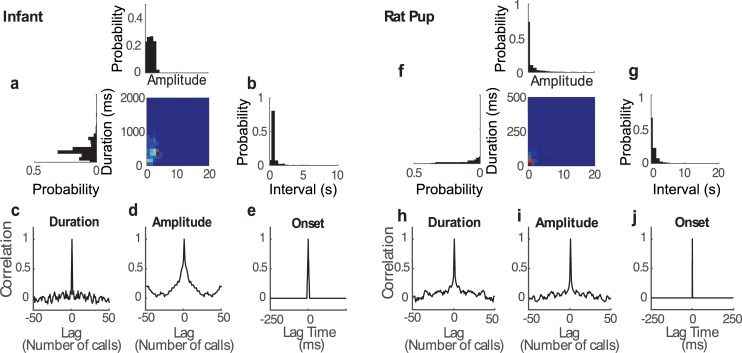
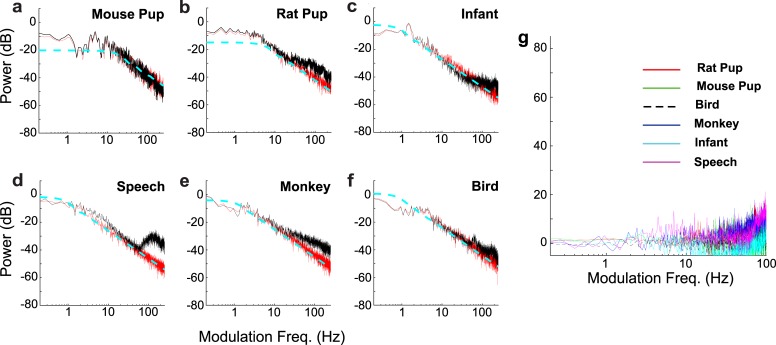
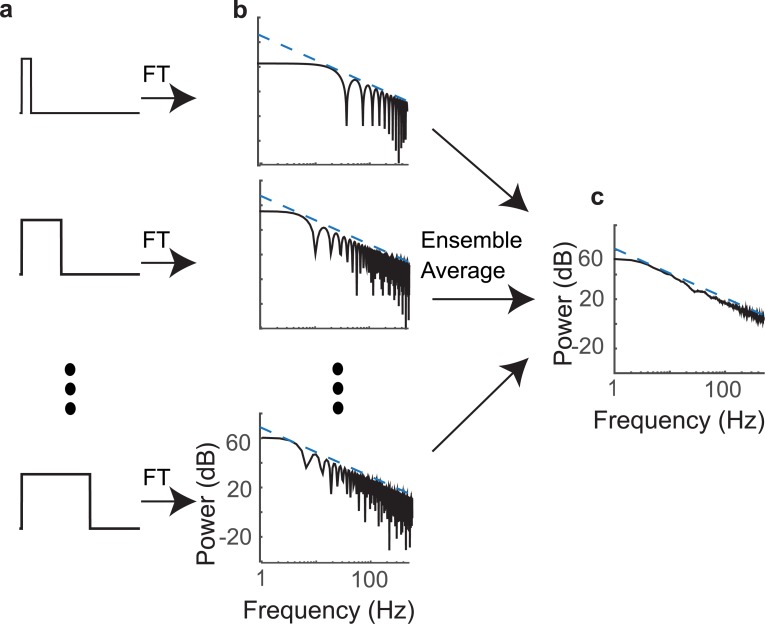
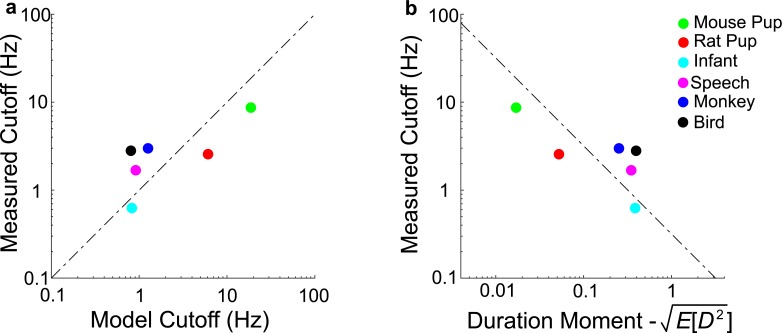
To communicate effectively animals need to detect temporal vocalization cues that vary over several orders of magnitude in their amplitude and frequency content. This large range of temporal cues is evident in the power-law scale-invariant relationship between the power of temporal fluctuations in sounds and the sound modulation frequency (f). Though various forms of scale invariance have been described for natural sounds, the origins and implications of scale invariant phenomenon remain unknown. Using animal vocalization sequences, including continuous human speech, and a stochastic model of temporal amplitude fluctuations we demonstrate that temporal acoustic edges are the primary acoustic cue accounting for the scale invariant phenomenon. The modulation spectrum of vocalization sequences and the model both exhibit a dual regime lowpass structure with a flat region at low modulation frequencies and scale invariant 1/f2 trend for high modulation frequencies. Moreover, we find a time-frequency tradeoff between the average vocalization duration of each vocalization sequence and the cutoff frequency beyond which scale invariant behavior is observed. These results indicate that temporal edges are universal features responsible for scale invariance in vocalized sounds. This is significant since temporal acoustic edges are salient perceptually and the auditory system could exploit such statistical regularities to minimize redundancies and generate compact neural representations of vocalized sounds.


Conflict of interest statement

No

Figures

Fig 1
Fig 1. Envelope extraction, segmentation, and model fitting.
(a) Acoustic waveform for a speech sample from the BBC reproduction of Hamlet containing the phrase “That’s not my meaning: but breathes his faults so quaintly.” (b) The envelope used for segmentation (blue) was obtained by lowpass filtering the analytic signal amplitude at 30 Hz whereas the envelope used for data analysis and model fitting was filtered at 250 Hz (red). The optimized model envelope for this example consists of sequence of non-overlapping rectangular pulses of variable duration and amplitude (green). (c) Zoomed-in view of a short segment of the corresponding envelopes in (b). The model (green) captures the transient onsets and offsets between consecutive speech elements and words, but is unable to capture other envelope features such as the fast-periodic fluctuations created through vocal fold vibration (~190 Hz fundamental in c) that are evident in the original envelope (red).
Fig 2
Fig 2. Relationship between sounds’ acoustic envelope parameters and AMPS illustrated for a crying infant and a rat pup vocalization sequences.
(a and e) The original sound waveforms (gray line) and envelopes (black line) are shown along with the pulsed vocalization model (red line). Three models are also shown where one of the three parameters (amplitude, inter-vocalization interval, and duration) was perturbed. The perturbed pulse sequences have either constant pulse amplitudes (green), constant inter-vocalization intervals (magenta line), or zero durations (blue line). (b and f) Amplitude modulation power spectrum for original vocalization envelope and corresponding models (same color convention) show that manipulating durations has the most pronounced effect on the AMPS. (c and g) Vocalizations are also perturbed by synthetically modifying the duration distributions for infant (c) or rat (g) vocalization (uniform, exponential, or gamma distribution with matched mean and variance as the original vocalization). The duration distribution has minimal effect on the AMPS (d and h).
Fig 3
Fig 3
Vocalization parameters and serial statistics for a crying infant (a-e) and rat pup call (f-j). (a and f) Joint distribution of vocalization duration and amplitude is tightly distributed. The duration and amplitude marginal distributions are shown to the left and above the joint distribution. Inter-vocalization interval distributions (b and g) exhibit long exponential-like tails and a refractory region at short intervals. Serial statistics of the vocalization parameters exhibit weak temporal autocorrelation (c-e for a crying infant and h-j for rat pup call). Duration (c and h) and amplitude (d and i) parameters are largely serially uncorrelated. (e and j) Normalized autocorrelation for a point process consisting of onset times for each vocalization exhibits an impulsive autocorrelation.
Fig 4
Fig 4. Comparison of AMPS from different species with the simulated model and the analytical solutions.
AMPS (black) are shown for a mouse pup (a), rat pup (b), crying infant (c), speech (d), new world monkey (e), and bird (f) vocalizations. The simulated pulse vocalization model (red curves) has lowpass structure and 1/f2 trend at high frequencies that mirrors the scaling observed in the actual AMPS. The analytical solution likewise exhibits a lowpass structure with 1/f2 trend at high frequencies (Eq 3; dotted blue). (g) The residual error between the actual vocalization AMPS and simulated model AMPS lack the 1/f2 trend for different species.
Fig 5
Fig 5. Ensemble averaging of vocalization pulse spectra predicts the observed vocalization AMPS.
(a) Three example pulses from the speech ensemble. (b) The AMPS for each pulse consists of a sinc2 function with side lobe peaks and notch locations that depend on the vocalization duration and the side-lobe amplitudes that drop off proportional to 1/f2 (blue dotted lines). (c) The AMPS is obtained as the ensemble average across all durations, which produces an AMPS with lowpass structure and 1/f2 trend at high frequencies.
Fig 6
Fig 6. Time-frequency resolution tradeoff is predicted by the model.
(a) The predicted cutoff frequencies from the vocalization duration statistics (Eq 7) for different vocalization recordings closely match the actual measurements. (b) Empirically measured fc and duration second moment follow an inverse relationship as predicted by the model (Eq 7; dashed dot line).

References

    1. Barlow H. Possible principles underlying the transformation of sensory messages Sensory Communication: MIT Press; 1961.
    1. Ruderman DL, Bialek W. Statistics of natural images: Scaling in the woods. Physical Review Letters. 1994;73(6):814–7. doi: 10.1103/PhysRevLett.73.814 . - DOI - PubMed
    1. Field DJ. Relations between the statistics of natural images and the response properties of cortical cells. J Opt Soc Am A. 1987;4(12):2379–94. Epub 1987/12/01. . - PubMed
    1. Zylberberg J, Pfau D, Deweese MR. Dead leaves and the dirty ground: low-level image statistics in transmissive and occlusive imaging environments. Phys Rev E Stat Nonlin Soft Matter Phys. 2012;86(6 Pt 2):066112 doi: 10.1103/PhysRevE.86.066112 . - DOI - PubMed
    1. Hsiao WH, Millane RP. Effects of occlusion, edges, and scaling on the power spectra of natural images. J Opt Soc Am A Opt Image Sci Vis. 2005;22(9):1789–97. . - PubMed

Publication types

LinkOut - more resources